


INTRODUCTION
Reduced hemoglobin concentrations are common findings in diabetic patients [1]. Previous studies have demonstrated a strong association between low hemoglobin levels and cardiovascular disease in diabetic patients [2,3]. A low hemoglobin concentration has been reported to be an independent risk factor for left ventricular hypertrophy and cardiovascular mortality [4,5]. It may also be an important determinant of the adverse outcomes of hypoxia-induced organ damage, such as angina, claudication, and heart failure [6]. Several studies have also suggested an association between low hemoglobin concentrations and microangiopathy in type 2 diabetic patients [7,8].
Type 2 diabetes mellitus is typically a progressive disease [9]. Pancreatic ╬▓-cell dysfunction may contribute to its progression; however, the natural history of ╬▓-cell function in type 2 diabetes remains poorly understood. Plasma C-peptide levels have been used as an indirect measure of insulin secretory reserve [10,11]. Several studies have reported that susceptibility of the pancreatic islet cells to hypoxia resulted in ╬▓-cell dysfunction [12,13]. Thus, from a clinical viewpoint, it is interesting to evaluate hemoglobin concentrations in relation to ╬▓-cell function and microangiopathy in type 2 diabetic patients.
In the present study, we investigated possible associations between hemoglobin concentrations and various parameters, including metabolic factors, plasma C-peptide responses after a meal tolerance test, and microvascular complications in Korean type 2 diabetic patients.
METHODS
This study was conducted from February 2009 to January 2011. The study was approved by the local ethics committee. All participants gave informed consent.
We investigated 337 men with type 2 diabetes mellitus who visited our hospital. We excluded patients with positive glutamic acid decarboxylase autoantibodies, glucocorticoid use, red cell transfusion, history of blood loss (gastrointestinal or genitourinary bleeding), history of taking medicines to affect hemoglobin concentrations, such as erythropoietin or iron supplements, and renal impairment (< 60 mL/min/1.73 m2). Patients with a continuous requirement for insulin within 1 year of diagnosis were also excluded. A history and physical examination, including measurements of blood pressure (BP), height, and body weight, were performed. Body mass index (BMI) was calculated as the weight (kg) divided by the square of the height (m2). After 30 minutes of rest, BP was measured twice in a sitting position with a 5-minute interval. Mean values were recorded. Smoking was defined as current, never, or past.
Blood samples were taken from the antecubital vein in the overnight fasting state between the hours of 8:00 and 10:00 AM. For this test, patients did not take insulin or oral hypoglycemic agents, but these antidiabetic drugs were maintained until 1 day before to prevent hyperglycemia.
After fasting blood samples were taken, patients were allowed to eat a standardized meal, calculated on the basis of body weight (10 kcal/kg; carbohydrate 60%, protein 20%, and fat 20%) [14]. The concentrations of plasma glucose and C-peptide were measured 2 hours after ingestion of the meal. Δ C-peptide was calculated as the postprandial 2-hour C-peptide concentration minus the fasting C-peptide concentration. Pancreatic β-cell responsiveness was calculated using the formula of Hovorka et al. [11] with some modifications. Fasting β-cell responsiveness (M0) represents the ability of fasting glucose to stimulate β-cell secretion, and postprandial β-cell responsiveness (M1) represents the ability of postprandial glucose to stimulate β-cell secretion [11].
M0 = 100 ├Ś fasting C-peptide level (ng/mL) / fasting glucose level (mg/dL)
M1 = 100 ├Ś [postprandial 2-hour C-peptide level (ng/mL) - fasting C-peptide level (ng/mL)] / [postprandial 2-hour glucose level (mg/dL) - fasting glucose level (mg/dL)]
Plasma glucose was measured by the hexokinase method (Daiichi, Tokyo, Japan). Hemoglobin concentrations were measured using cyanmethemoglobin spectrophotometry (LH750, Beckman-Coulter Inc., Miami, FL, USA). Serum C-peptide was measured by radioimmunoassay (Biosource Europe S.A., Nivelles, Belgium). Glycated hemoglobin (HbA1C) was measured by ion exchange liquid chromatography (HLC-723-GHbV, Tosoh, Tokyo, Japan). We also determined levels of total cholesterol (AU5400, Olympus, Tokyo, Japan), high-density lipoprotein cholesterol (AU5400), low-density lipoprotein cholesterol (LDL-C, AU5400), triglycerides (AU5400), and free fatty acids (NEFA-HR kit, Wako, Osaka, Japan).
Urinary albumin excretion (UAE) was determined in random urine samples using the urinary albumin : creatinine ratio. The urinary albumin concentration was measured with an immunoturbidimetric method (Randox, Antrim, UK). The estimated glomerular filtration rate was calculated using the equation from the Modification of Diet in Renal Disease study [15,16]. Nephropathy was defined as UAE Ōēź 30 mg/gCr in two of three urine collections. To evaluate retinopathy, an ophthalmologist performed fundoscopy, after pupillary dilation. In addition to a clinical neurological examination, peripheral polyneuropathy was assessed by measurements of peripheral nerves with an electroneuromyographic device (Medelec Synergy, Oxford, UK). Motor and sensory amplitudes, conduction velocities, F responses, and latencies were recorded. If two or more different nerves showed abnormal findings above two standard deviations from the normal range in three or more of four parameters, the patient was determined to have neurophysiologically diagnosed peripheral polyneuropathy [16].
Subjects were divided into three groups according to tertiles of hemoglobin concentrations.
Statistical analysis
Data are expressed as means ┬▒ SD unless otherwise stated. Linear trends were tested for hemoglobin concentrations in the regression models. Multivariate logistic regression analyses were performed to provide odds ratios (ORs) between categorized variables and diabetic microvascular complications, according to the tertiles of hemoglobin levels. Multiple linear regression models were used to determine associations between hemoglobin concentrations and postprandial C-peptide responses. Non-normally distributed variables were logarithmically transformed before the analysis. Statistical analyses were performed using the SPSS version 17.0 (SPSS Inc., Chicago, IL, USA). A p values of less than 0.05 were considered to indicate statistical significance.
RESULTS
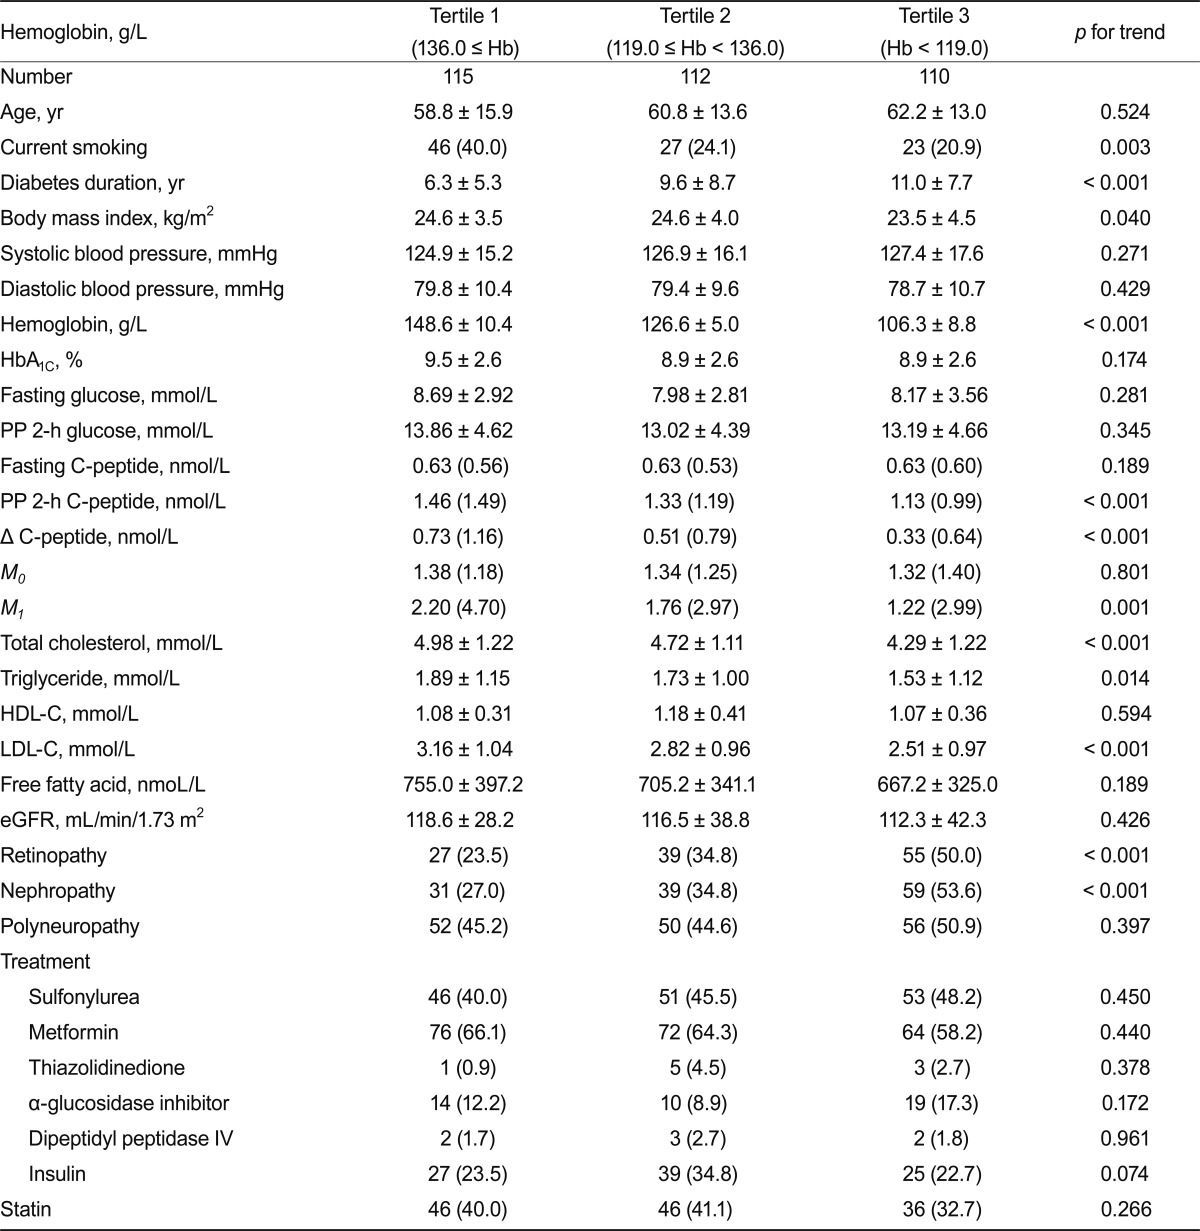
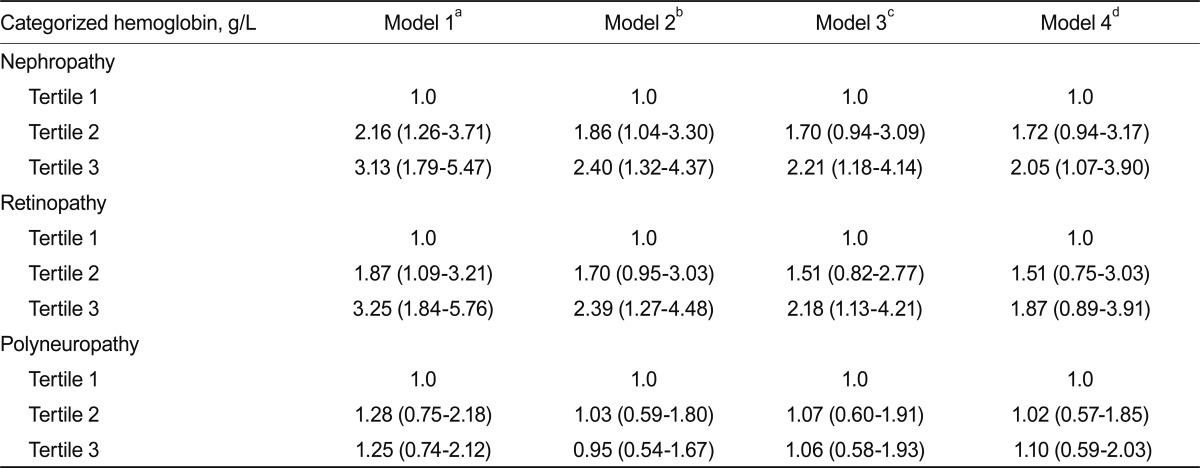
Clinical characteristics of the study subjects are shown in Table 1. The mean age of the subjects was 59.9 ± 14.2 years; diabetes duration and HbA1C levels were 8.9 ± 8.1 years and 9.1 ± 2.6%, respectively. The mean hemoglobin concentration was 127.5 ± 19.2 g/L. Patients with lower hemoglobin concentrations had a lower prevalence of current smoking, longer duration of diabetes, lower BMI, and lower concentrations of total cholesterol, triglycerides, and LDL-C (Table 2). Such patients also had lower levels of postprandial C-peptide, Δ C-peptide, and postprandial β-cell responsiveness. These patients had a higher prevalence of retinopathy and nephropathy. However, there was no significant difference in the prevalence of polyneuropathy. The ORs for microvascular complications according to tertiles of hemoglobin concentrations are shown in Table 3. For nephropathy, the crude ORs for increasing tertiles of hemoglobin levels were statistically significant. After adjusting for other covariates, including age, BMI, HbA1C, systolic BP, total cholesterol, and diabetes duration, the OR showed that hemoglobin levels were significantly associated with nephropathy (OR, 2.05; 95% confidence interval [CI], 1.07 to 3.90 for the highest vs. the lowest hemoglobin tertile). For retinopathy, the crude ORs for increasing tertiles of hemoglobin levels were significantly associated, and after adjusting for other covariates, including age, BMI, HbA1C, systolic BP, and total cholesterol, hemoglobin levels were still significantly associated with retinopathy (OR, 2.18; 95% CI, 1.13 to 4.21 for the highest vs. the lowest hemoglobin tertile). However, when adjusted for diabetes duration, hemoglobin levels were not significantly associated with retinopathy. For polyneuropathy, the crude and adjusted ORs for increasing tertiles of hemoglobin levels were not statistically significant.
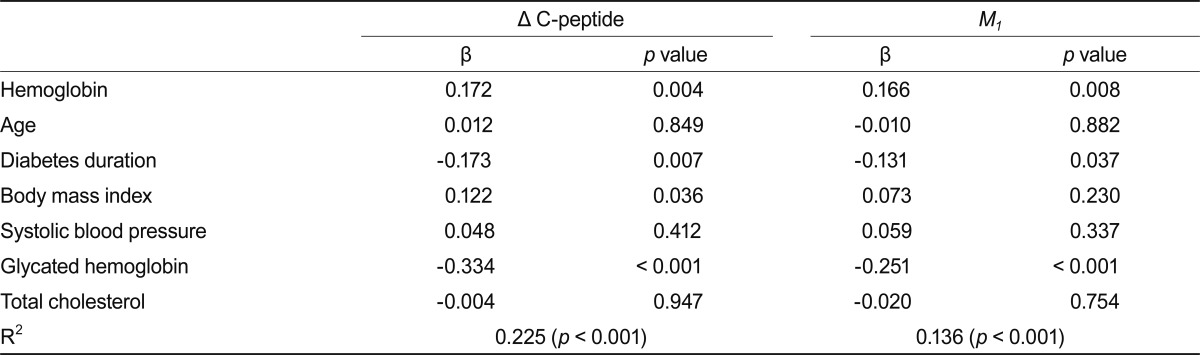
Linear regression models were used to determine the association between Δ C-peptide level and hemoglobin concentration (Table 4). There was a significant association between Δ C-peptide levels and hemoglobin concentrations, after adjustments for several variables, including age, diabetes duration, HbA1C, systolic BP, total cholesterol, and BMI. There was also a significant independent association between M1 index and hemoglobin concentration.
DISCUSSION
Our results showed that hemoglobin concentration was positively associated with smoking, BMI, total cholesterol, triglyceride, and LDL-C, whereas diabetes duration was negatively associated with hemoglobin concentrations. A higher prevalence of diabetic retinopathy and nephropathy was related to lower concentrations of hemoglobin. Furthermore, our study demonstrated that hemoglobin concentrations were independently associated with postprandial C-peptide response (Δ C-peptide and M1 index).
Low hemoglobin concentrations are common findings in patients with diabetes. Ishimura et al. [17] showed that hemoglobin levels were lower in diabetic patients than in non-diabetic subjects. Redondo-Bermejo et al. [18] reported that red cell survival decreased by about 13% in hyperglycemic states. In the present study, hemoglobin concentrations decreased with increased diabetes duration, suggesting an ongoing decline of hemoglobin levels over time in type 2 diabetic patients, consistent with previous studies [19,20]. Ranil et al. [7] also reported that patients with diabetes durations of more than 5 years have about a 1.5-fold higher risk of developing anemia than those with diabetes durations of less than 5 years. Our results showed that hemoglobin concentrations were associated with BMI, serum total cholesterol, and triglyceride concentrations in patients with type 2 diabetes. These findings support, partly, reports that hemoglobin levels are associated with nutritional status [21].
Several studies have suggested that anemia may exacerbate the severity and impair outcomes of microangiopathy in diabetic patients. Adetunji et al. [22] reported a negative correlation between hemoglobin level and the urinary albumin creatinine ratio in diabetic patients, and an increased prevalence of anemia in microalbuminuria compared with normoalbuminuria, despite there being no significant difference in glomerular filtration rate between the two groups. Ueda et al. [8] reported that in diabetic patients with chronic renal insufficiency (serum creatinine > 1.5 mg/dL), a low hemoglobin level was a significant predictor of progression to renal failure. In a prospective observation study, Rossing et al. [23] demonstrated that a lower hemoglobin concentration was associated with a more rapid decline in glomerular filtration. Cusick et al. [24] reported that anemia was a risk factor for the need for renal replacement therapy in diabetic patients. In a cross-sectional study of 1,691 subjects with diabetes, Qiao et al. [25] reported an OR of 2.0 for the presence of diabetic retinopathy in subjects with hemoglobin levels below 120 g/L. Davis et al. [26] showed that the hematocrit was associated with retinopathy and, in the lowest hematocrit group, the OR for the development of high-risk proliferative diabetic retinopathy was 1.52 during a 5-year follow-up. In some cases, anemia treatment was related to an improvement in diabetic retinopathy [27,28]. In the present study, the increased prevalence of diabetic nephropathy and retinopathy was associated with lower hemoglobin concentrations. The association between retinopathy and hemoglobin levels diminished after further adjustment for diabetes duration as an independent variable (Table 3), while hemoglobin concentrations showed an independent association with diabetic nephropathy, regardless of glycemic status, diabetes duration, systolic BP, or total cholesterol (OR, 2.05; 95% CI, 1.07 to 3.90 for the highest vs. the lowest tertile of hemoglobin levels). These findings suggest that lower hemoglobin concentrations might not only be a consequence of diabetes [29], but may also accelerate microvascular damage in diabetes mellitus. However, prospective studies are necessary to further assess these relationships in diabetic patients.
Type 2 diabetes is a progressive disorder. Pancreatic ╬▓-cells may have an important role in the progression as well as the initiation of type 2 diabetes. Thus, it is important to evaluate pancreatic ╬▓-cell function in clinical practice. However, the natural history of ╬▓-cell function in type 2 diabetes is not fully understood.
The meal tolerance test is known as a physiological test evaluation of pancreatic ╬▓-cell function [11]. The oral load of a meal results in typical postprandial exposure of the pancreas to glucose, nutrients (protein and fat), and various hormones (from the gut and vagus). Thus, the measurement of pancreatic responsiveness may closely reflect the ability of the pancreas to secrete insulin under normal physiological conditions [11].
Our results show that postprandial C-peptide level, Δ C-peptide, and the M1 index decreased with decreasing hemoglobin concentrations. To determine the association between hemoglobin levels and C-peptide responses, multivariate analyses, including HbA1C, BMI, and diabetes duration as independent factors, were conducted, because these factors have been reported to be important determinants of pancreatic β-cell function [30,31]. In the multivariate analysis, a strong association between hemoglobin concentrations and postprandial C-peptide responses was seen, even after adjustments for age, HbA1C, BMI, total cholesterol, systolic BP, and diabetes duration, indicating that these did not significantly affected the relationship. Thus, our results suggest that decreasing hemoglobin concentrations make β-cell function more vulnerable in Korean type 2 diabetic patients.
Recently, reduced oxygen delivery and hypoxia of pancreatic islets were suggested as possible etiologic factors in ╬▓-cell failure in type 2 diabetes mellitus [12,13]. Pancreatic islets comprise only approximately 2% of the pancreas mass, but they consume about 20% of the arterial blood supply, suggesting that the islets rely on an extensive blood supply. Several studies have reported that pancreatic ╬▓-cells may be highly susceptible to hypoxia [32-34]. Diabetic erythrocytes were also reported to show impaired deformability and increased hemoglobin-oxygen affinity, which impairs oxygen delivery to tissues [35,36]. Thus, a subtle reduction in oxygen delivery to the islets may impair ╬▓-cell function under conditions of pancreatic microvascular changes due to chronic hyperglycemia. Furthermore, the demand for increased blood flow to the stomach and intestine, especially following ingestion of a meal, might aggravate the disturbance in impaired microvascular flow to the islets in type 2 diabetes. These findings appear to support the concept that blunted postprandial C-peptide responses are associated with reduced hemoglobin levels. However, further investigation is needed to establish this relationship.
This study has some limitations. Due to its cross-sectional design, the causative nature of the associations between hemoglobin concentrations, C-peptide response, and microangiopathy could not be established. While clinical conditions associated with acute changes in hemoglobin concentration were excluded, a work-up of anemia observed in a significant proportion was not performed. Also, although nerve electrophysiological studies used for the measurement of peripheral polyneuropathy are sensitive, objective, and reproducible methods of investigating diabetic polyneuropathy, they have limitations in the assessment of small-fiber dysfunction.
In conclusion, our results suggest that hemoglobin concentrations were associated with postprandial C-peptide responses as well as diabetic nephropathy in type 2 diabetic patients. Further studies are necessary to determine the mechanisms underlying the relationships between hemoglobin concentration and ╬▓-cell function in type 2 diabetic patients.

 PDF Links
 PubReader
 ePub Link
 Full text via DOI
 Download Citation
 Print
Print


