


INTRODUCTION
Pancreatic cancer (PC) is one of the most lethal cancers, causing an estimated 338,000 new cases and 331,000 cancer deaths annually worldwide [1]. In the Republic of Korea, PC accounts for about 3% of all prevalent cancers and approximately 5,000 cancer deaths annually (6.7% of all cancer-related mortalities) [2]. Most patients with PC (> 60%) are diagnosed in advanced stages, resulting in poor prognosis. Therefore, PC has a relatively low prevalence with a high mortality rate. Surgical resection followed by adjuvant treatment is the only chance to cure PC. However, this is only possible in about 10% of cases [3]. Gemcitabine has been the treatment of choice for metastatic or recurred PC. Several chemotherapeutic agents have been added to this regimen, including capecitabine, erlotinib, and nanoparticle albumin-bound paclitaxel (nab-paclitaxel) [4-6]. A phase III trial has also shown improved survival using a FOLFIRINOX (5-fluorouracil, leucovorin, irinotecan, and oxaliplatin) regimen in metastatic PC compared to gemcitabine alone [7]. Despite these efforts, long-term survival remains disappointingly low while new regimens still have considerable toxicities and side effects.
To formulate therapeutic strategies in the field of oncology, it is crucial to identify prognostic markers. Reliable and easily obtainable prognostic markers may help avoid unnecessary toxicities and adverse effects from aggressive treatment in advanced or metastatic PC patients. Recently, several inflammatory prognostic markers have been found in many cancers. A number of studies have suggested that systemic inflammation plays a crucial role in carcinogenesis and cancer progression [8]. Markers such as white blood cell (WBC) count, neutrophil to lymphocyte ratio (NLR), platelet to lymphocyte ratio (PLR), C-reactive protein (CRP), and CRP to albumin ratio can be easily measured from routine blood samples [9]. Each of these factors has been studied at length as an indicator of PC prognosis. However, no comprehensive study has considered all these inflammatory markers in a homogenous patient group.
Thus, the aim of the current study was to comprehensively evaluate the value of baseline markers of systemic inflammation as independent factors affecting progression free survival (PFS) and overall survival (OS) in patients with unresectable or recurred PC treated with gemcitabine-based chemotherapy as the first-line regimen.
METHODS
Study patients
A single-center retrospective study was performed after obtaining approval from the Institutional Review Board (IRB) of Korea University Guro Hospital (KUGH17070-001). Written informed consent by the patients was waived due to a retrospective nature of our study. We enrolled PC patients who began gemcitabine-based palliative chemotherapy (gemcitabine only or combined with erlotinib, fluoropyrimidine, oxaliplatin, carboplatin, or nab-paclitaxel) as first-line treatment between November 2004 and August 2016. For patients who received adjuvant chemotherapy or concurrent chemoradiotherapy (CCRT) after curative resection, only patients who relapsed at least 6 months after the end of treatment were included in this study. All patients were included if they were diagnosed with PC by tissue biopsy, cytology, or surgical excision. Only carcinoma cases were enrolled. We excluded patients with uncommon histology types (e.g., neuroendocrine tumors or lymphomas), any history of other cancers, abnormal hepatic function, or abnormal renal function. All clinical data were collected by retrospectively reviewing medical records.
Measured parameters
Laboratory data including WBC, neutrophil, lymphocyte, CRP, serum sodium (Na), albumin, platelet (PLT), and carbohydrate antigen 19-9 (CA 19-9) levels were obtained at the start of the first cycle of chemotherapy. NLR was calculated as absolute neutrophil count divided by absolute lymphocyte count. PLR was calculated as PLT count divided by absolute lymphocyte count. CRP-albumin ratio was calculated as serum CRP level (mg/L) divided by serum albumin level (g/dL). Baseline data including age, sex, body surface area, body mass index, smoking, alcohol, diabetes mellitus, Eastern Cooperative Oncology Group (ECOG) performance status, and number of metastatic lesions were also documented at the start of chemotherapy.
All patients underwent computed tomography (CT) examination of the abdomen, pelvis, and chest as well as 18F-fluorodeoxyglucose positron emission tomography to evaluate distant metastasis. Response to treatment was examined by CT every two cycles of chemotherapy using the Response Evaluation Criteria in Solid Tumors (RECIST) 1.1. It was classified as complete response, partial response (PR), stable disease (SD), or progressive disease (PD) [10].
Analyses in subgroups
Levels of inflammatory markers could be affected by infection, the number of metastasized organs, and whether any invasive procedures including surgery were performed recently [9,11]. We performed additional subgroup analyses to assess possible bias of the current study. Because any patient with currently documented infection has no chance of receiving chemotherapy in any case, we can say that there are no infected patients at the time of the analysis of inflammatory markers. In cases of febrile patients, we ruled out true infection by routine tests including blood culture, sputum culture, and simple chest imaging. We divided these patients into subgroups according to the number of metastasized organs and whether they received any invasive procedures within 30 days before the start of 1st line palliative chemotherapy.
Statistical analysis
We assessed PFS and OS as outcome variables. PFS was defined as the period from the start of chemotherapy until the time of the first detection of PD or death from any cause. OS was defined as the period from the start of chemotherapy to death from any cause. We censored data for cases without PD or death at the last follow-up. Survival curves were generated using the Kaplan-Meier method and analyzed by log-rank test. Multivariate survival analyses were performed by CoxŌĆÖs proportional hazard regression. Significant parameters in univariate analysis were entered into multivariate analyses for PFS and OS. Some clinical data (WBC, CRP, and PLT) were categorized by their upper normal values while others (Na and albumin) were categorized by their lower normal values. We performed receiver operating curve (ROC) analysis using 1-year survival rates to determine optimal cut-off levels of clinical data without known normal ranges (NLR, PLR, and CRP-albumin ratio). We considered a p < 0.05 as statistically significant and used a Bonferroni corrected p value (Pc) for multiple comparisons. All statistical analyses were performed using SPSS version 20.0 for Windows (IBM Co., Armonk, NY, USA).
RESULTS
Patient characteristics
A total of 302 patients who had been diagnosed with advanced PC at Korea University Guro Hospital were evaluated. Baseline characteristics of patients are shown in Table 1. Their median age was 64 years (range, 38 to 83). There were 189 males (62.6%) and 113 females (37.4%). Prior to the initiation of first-line palliative chemotherapy, 59 patients (19.5%) had undergone curative resection, 16 (5.3%) had received palliative surgery, and three (1.0%) had received CCRT alone while 224 (74.1%) had not received any local treatment. Among those patients who had undergone curative surgery, 11 received post-operative adjuvant treatment, including CCRT with fluoropyrimidine (n = 9) and chemotherapy with gemcitabine (n = 2). In terms of disease status at the beginning of first-line chemotherapy, 41 patients (13.6%) showed locally advanced disease, including local recurrence after curative resection (n = 17) while 261 (86.4%) patients showed metastatic disease including metastatic recurrence after curative resection (n = 42). More than half of all patients had primary pancreatic head cancer (n = 164, 54.3%). As described previously, all patients received gemcitabine-based chemotherapy as the first-line regimen. Forty-eight patients (15.9%) received gemcitabine alone, 118 (39.1%) received gemcitabine plus erlotinib, 130 (43.0%) received gemcitabine plus fluoropyrimidine, three received gemcitabine plus nab-paclitaxel, and three received gemcitabine plus a platinum-based agent as the first-line treatment. The median number of first-line chemotherapy cycles administered was 4 (range, 2 to 36). In 20 patients (6.6%), the best response was PR. In 166 patients (55.0%), the best response was SD.
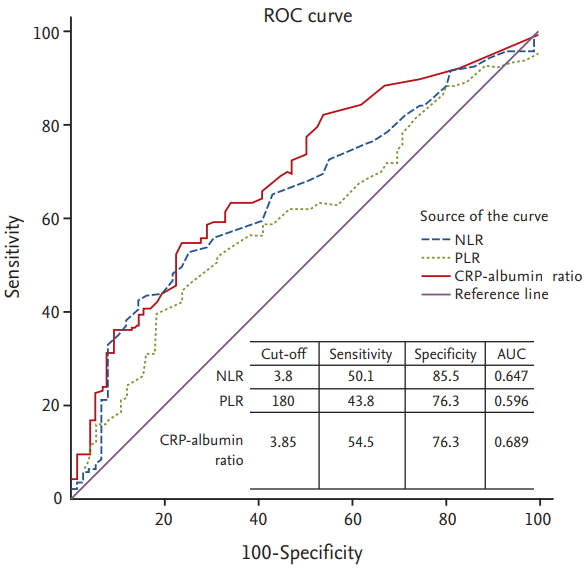
Determination of cut-off for NLR, PLR, and CRP-albumin ratio
Median values of NLR, PLR, and CRP-albumin ratio were 3.0 (range, 0.3 to 30.9), 153 (range, 16 to 2,312), and 3.4 (range, 0.03 to 73.4), respectively. To examine the prognostic value of these markers, 1-year survival was chosen as the stratifying point for ROC analysis. OS rate or PFS rate is one of the most appropriate measures of prognosis. Considering that it is unusual to designate more than two cut-off levels in the same biomarker and OS is commonly selected as primary endpoint in most famous trials rather than PFS [4,6], we chose 1-year survival as stratifying point. ROC curves of each of these three parameters showed statistical utility. They were drawn above the reference line (Fig. 1). We used cut-off values to make the sum of sensitivity and specificity the greatest. Determined optimal cut-offs of NLR, PLR, and CRP-albumin ratio were 3.8, 180, and 3.85, respectively, with areas under the curve (AUCs) of 0.647, 0.596, and 0.689, respectively.
Survival analysis in the whole cohort
The median follow-up time from the start of first-line chemotherapy was 6.7 months (range, 0.1 to 63.7). At the time of analysis, 288 patients (95.4%) had died and the cancer had progressed in all patients after first-line treatment. After progression, 116 patients (38.4%) received second-line chemotherapy and 32 (10.6%) received third-line chemotherapy. Regimens of chemotherapy after first-line treatment included FOLFOX (fluorouracil, leucovorin, and oxaliplatin), FOLFIRINOX, EPUL (epirubicin, cisplatin, oral uracil/ftorafur [UFT], and leucovorin), fluoropyrimidine mono (capecitabine, fluorouracil, or TS-1), mitomycin C plus fluorouracil, and paclitaxel plus cisplatin.
Prognostic factor analysis in the whole cohort
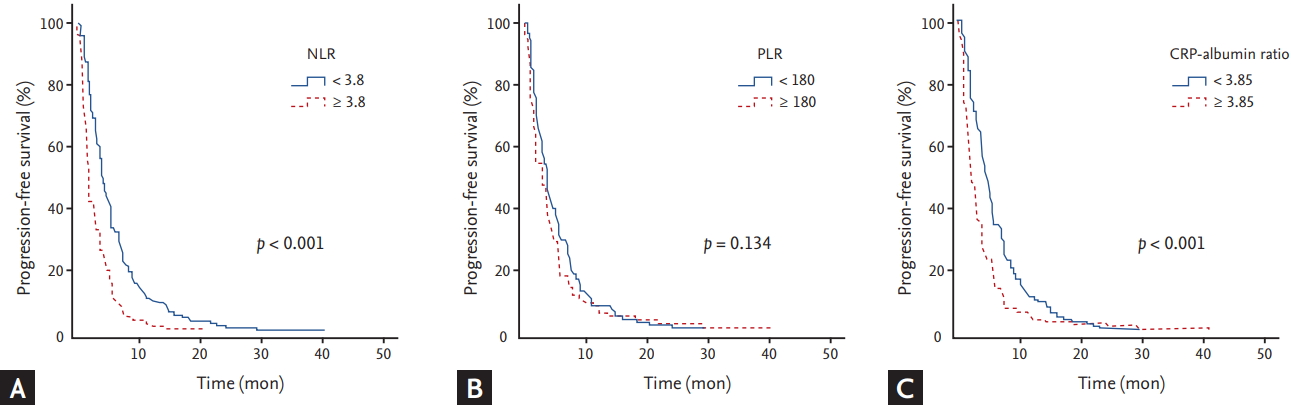
Analyses for PFS with respect to clinical parameters and inflammatory markers are shown in Tables 2 and 3, respectively. The median PFS was 3.4 months (95% confidence interval [CI], 2.9 to 3.9). By univariate analysis with log rank test, worse ECOG performance status (p < 0.001), WBC Ōēź 10,000/╬╝L (p < 0.001), NLR Ōēź 3.8 (p < 0.001), CRP Ōēź 10.5 mg/L (p < 0.001), CRP-albumin ratio Ōēź 3.85 (p < 0.001), CA 19-9 Ōēź 1,000 U/mL (p = 0.001), and more than two metastatic lesions (p = 0.013) were significantly associated with shorter PFS (Fig. 2). By multivariate analysis using a CoxŌĆÖs proportional hazard regression model, worse ECOG performance status (p = 0.001; hazard ratio [HR], 2.018; 95% CI, 1.314 to 3.101), NLR Ōēź 3.8 (p < 0.001; HR, 1.837; 95% CI, 1.432 to 2.356), CRP-albumin ratio Ōēź 3.85 (p < 0.001; HR, 1.48; 95% CI, 1.166 to 1.878), and CA 19-9 Ōēź 1,000 U/mL (p = 0.014; HR, 1.326; 95% CI, 1.039 to 1.694) were significantly associated with shorter PFS.
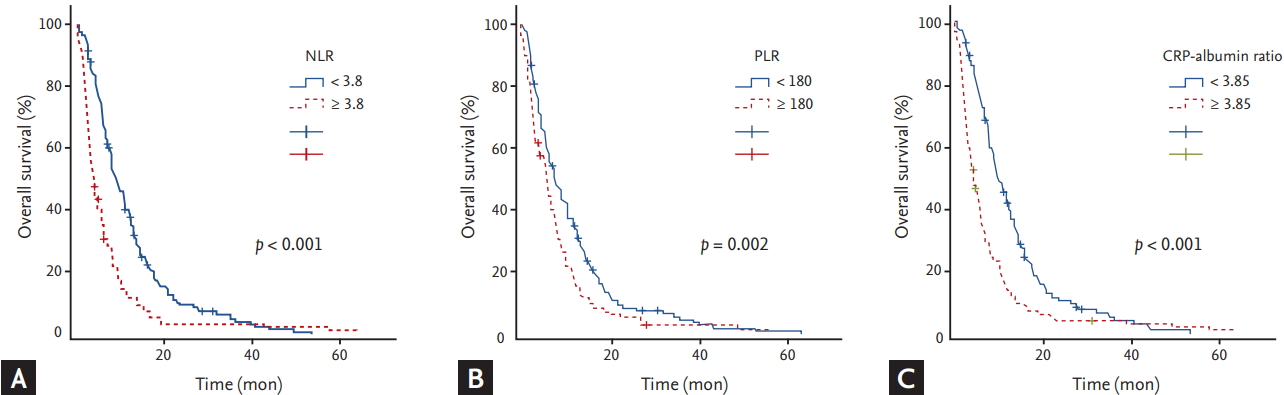
Analyses of OS with respect to clinical parameters and inflammatory markers are summarized in Tables 2 and 3, respectively. The median OS was 6.8 months (95% CI, 5.9 to 7.7). By univariate analysis with log rank test, age Ōēź 70 (p = 0.024), metastatic disease compared with locally advanced disease (p = 0.047), WBC Ōēź 10,000/╬╝L (p = 0.003), NLR Ōēź 3.8 (p < 0.001), PLR Ōēź 180 (p = 0.002), CRP Ōēź 10.5 mg/L (p < 0.001), CRP-albumin ratio Ōēź 3.85 (p < 0.001), Na level with < 135 mmol/L (p = 0.001), albumin level < 3.5 g/dL (p = 0.012), CA 19-9 Ōēź 1,000 U/mL (p = 0.001), and more than two metastatic lesions (p < 0.001) were significantly associated with shorter OS (Fig. 3). By multivariate analysis with CoxŌĆÖs proportional hazard regression model, age Ōēź 70 (p = 0.029; HR, 1.345; 95% CI, 1.03 to 1.757), NLR Ōēź 3.8 (p < 0.001; HR, 1.712; 95% CI, 1.326 to 2.211), PLR Ōēź 180 (p = 0.02; HR, 1.345; 95% CI, 1.048 to 1.726), CRP-albumin ratio Ōēź 3.85 (p < 0.001; HR, 1.454; 95% CI, 1.106 to 1.911), CA 19-9 Ōēź 1,000 U/mL (p = 0.014; HR, 1.373; 95% CI, 1.066 to 1.768), and more than two metastatic lesions (p = 0.002; HR, 1.537; 95% CI, 1.179 to 2.005) were significantly associated with shorter OS.
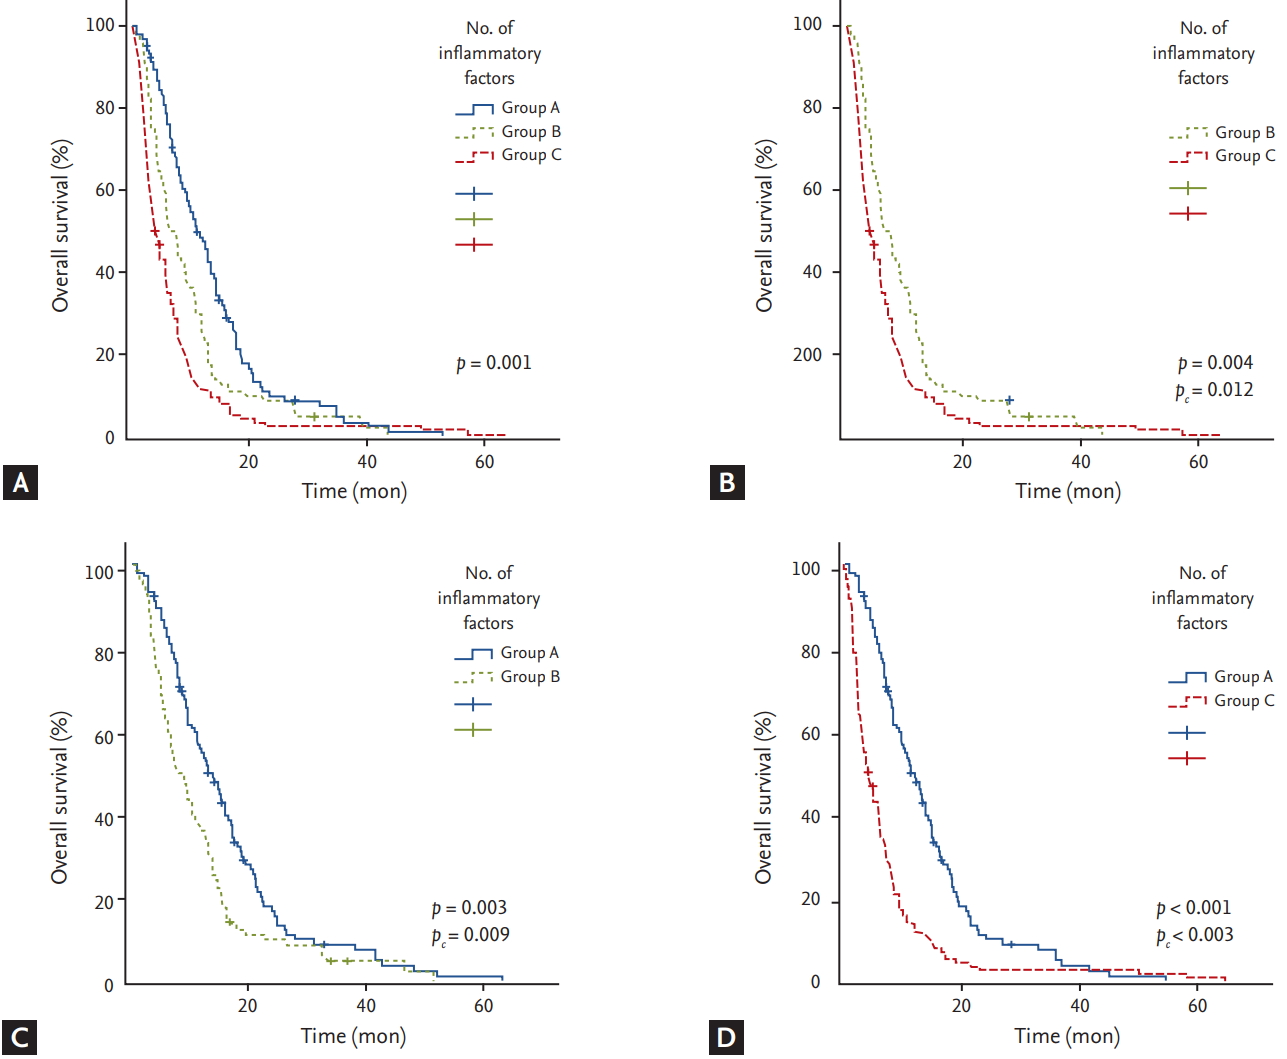
Based on the number of inflammatory markers identified as independent risk factors affecting OS, NLR, PLR, and CRP-albumin ratio, patients were divided into three groups (group A, 0 risk factor; group B, 1 risk factor; group C, Ōēź 2 risk factors) and OS for each group was compared (Fig. 4). OS was significantly longer in group A compared to that in group B (pc = 0.009) or C (pc < 0.003). Group B also showed significantly longer OS than group C (pc = 0.012).
Survival analyses in subgroups
In addition, we performed subgroup analyses to avoid possible biases. The group of patients who had not received any invasive procedures within 30 days prior to the start of chemotherapy (n = 239, subgroup 1A) showed significantly higher level of inflammatory markers including WBC, NLR, CRP, and CRP-albumin ratio compared to other patients (n = 63, subgroup 1B). Invasive procedures noted above included palliative surgery (n = 16) and laparoscopic biopsy (n = 47). The group of patients with more than two metastasized organs (n = 205, subgroup 2A) showed significantly higher level of inflammatory markers including WBC, NLR, PLR, CRP, and CRP-albumin ratio compared to other patients (n = 97, subgroup 2B) (Table 4).
Survival analyses for subgroups are summarized in Tables 5 and 6. Median PFS was 2.8 months in subgroup 1A (n = 239) and 4.1 months in subgroup 1B (n = 63). By multivariate analysis using a CoxŌĆÖs proportional hazard regression model, NLR Ōēź 3.8 and CRP-albumin ratio Ōēź 3.85 were significantly associated with shorter PFS in both groups. Median OS was 5.7 months in subgroup 1A (n = 239) and 11.4 months in subgroup 1B (n = 63). By multivariate analysis using a CoxŌĆÖs proportional hazard regression model, NLR Ōēź 3.8, PLR Ōēź 180, and CRP-albumin ratio Ōēź 3.85 were significantly associated with shorter OS in both subgroups.
Median PFS was 2.7 months in subgroup 2A (n = 205) and 4.6 months in subgroup 2B (n = 97). By multivariate analysis using a CoxŌĆÖs proportional hazard regression model, NLR and CRP-albumin ratio Ōēź 3.85 were significantly associated with shorter PFS in both subgroups. Median OS was 5.6 months in subgroup 2A (n = 205) and 10.5 months in subgroup 2B (n = 97). By multivariate analysis using a CoxŌĆÖs proportional hazard regression model, NLR Ōēź 3.8, PLR Ōēź 180, and CRP-albumin ratio Ōēź 3.85 were significantly associated with shorter OS in both subgroups.
DISCUSSION
Identification of patients who might have poor outcomes is crucial in developing therapeutic strategies for cancer patients, especially in fatal cancers such as advanced or metastatic PC. Therapeutic strategies considering proper prognostic markers could help clinicians bypass worthless toxicities of aggressive therapies. Recently, various inflammatory markers have been validated as prognostic indicators in many cancers including PC [12-15]. However, few studies have systematically evaluated these markers. Therefore, the supremacy of one over another is currently unclear. In this study, we comprehensively evaluated these markers in patients with advanced or metastatic PC to identify which markers might be independent risk factors. To the best of our knowledge, this study was conducted in the biggest and homogenous cohort composed of advanced PC patients treated with gemcitabine-based chemotherapy as a first-line regimen. As inflammation itself (or immunotherapeutic field deeply related to inflammation) is in the spotlight [16-18], systematical evaluation and comparative analysis of these inflammatory markers is thought to be meaningful, besides exploring possibilities as prognostic indicators.
We analyzed PFS and OS with respect to clinical parameters including several markers of systemic inflammation (WBC, NLR, PLR, CRP, albumin, and CRP-albumin ratio). In multivariate analyses, out of all systemic inflammatory markers, only calculated parameters (NLR and CRP-albumin ratio for PFS; NLR, PLR, and CRP-albumin ratio for OS) significantly affected PFS and OS. Further studies are mandated to investigate why PLR, unlike NLR and CRP-albumin ratio, showed no significant difference related with PFS. NLR, PLR, and CRP-albumin ratio were shown to be independent risk factors even after adjusting for each other. Individual mechanism might exist for each of these three markers. For this reason, we hypothesized that grouping patients according to these three markers could be more helpful in determining their prognosis. Using these three markers, we found a significant difference in survival rates of three groups depending on the number of marker-related risks. Thus, combining these inflammatory markers might play a crucial role in predicting clinical outcomes in advanced or metastatic PC patients who received gemcitabine-based chemotherapy as a first-line regimen.
In addition, we performed subgroup analyses to avoid possible biases. We designated invasive procedures in this study as surgical procedures including palliative surgery or laparoscopic biopsy, rather than non-surgical procedures including percutaneous biopsy and endoscopic retrograde cholangiopancreatography, while there was no reference that specifies criteria. Regarding the effect of invasive surgical procedures, the authors thought that higher levels of inflammatory markers would be observed in subgroup 1B compared with subgroup 1A. However, results were opposite. Subgroup 1B included patients who had no distant metastatic lesions, which are easily approachable for tissue biopsy. Thus, most of subgroup 1B patients received surgical procedure, laparoscopic biopsy. By PearsonŌĆÖs chi-square test, patients in subgroup 1A showed significantly higher tumor burden (p = 0.001). It has been reported that pro-inflammatory factors are correlated with tumor burden [19], consistent with our findings. It was shown in the current study that inflammatory biomarkers were affected by tumor burden rather than whether surgical procedure was performed. Perhaps in the same vein, this study also showed that inflammatory markers are related to the number of metastatic organs. Nevertheless, NLR, PLR, and CRP-albumin ratio still seemed to be useful prognostic indicators in subgroup analyses that considered possible biases.
Persistent inflammation is a well-known trademark of malignancy [16]. Inflammatory conditions have both cancer-inhibiting and cancer-promoting properties. It is best explained by two types of inflammation. Chronic inflammation promotes carcinogenesis while acute inflammation destroys cancer cells [17]. Chronic inflammation commonly causes chronic oxidative stress that produces reactive oxygen species (ROS) and proinflammatory cytokines, both of which can promote carcinogenesis, proliferation, and progression of malignancies [18]. Understanding these mechanisms has led to clinical investigations into immunotherapeutic approaches that antagonize tumor-developing inflammation and/or promote cytotoxic activities of antigen-specific T-cells [17]. Inflammation itself is thought to play a meaningful role as a prognostic indicator. It has become a target of treatment. Several traditional markers have been used to assess the status of inflammation.
Neutrophilia is commonly seen in cancer. Cancer itself is thought to release granulocyte colony stimulating factor that causes proliferation of neutrophils [20]. The most common genetic issue in PC is KRAS mutation [21] that may attract neutrophils. Several studies have shown that neutrophils are involved in various cytokine and chemokine pathways, including vascular endothelial growth factor (VEGF) and matrix metalloproteinase [22,23], both of which can promote tumor growth and metastasis. On the other hand, cytolytic ability of lymphocytes can lead to cancer cell death, thus suppressing cancer growth and metastasis. Intensive systemic inflammation induces lymphocytopenia and loss of innate cellular immunity by decreasing T4 helper lymphocytes but increasing T8 suppressor lymphocytes [24]. According to in vitro studies, neutrophils from inflammatory reactions can suppress cytolytic activities of lymphocytes [25]. Thrombocytosis is another index of a systemic inflammatory reaction to cancer. Tumor-induced release of PLT-derived proangiogenic mediators can promote aggregation and degranulation of PLTs [26]. Although the exact mechanism of PLT-tumor interaction is still unclear, a number of proinflammatory mediators that can induce megakaryocyte proliferation have been suggested [27]. In response to various inflammatory conditions including malignancy, macrophages and adipocytes produce interleukin-6 (IL-6) which regulates the level of CRP [28]. Recently, CRP and IL-6 have been reported to be associated with poor prognosis in many cancers [29]. In addition, low levels of serum albumin commonly accompany both poor nutritional status and systemic inflammation. Tumor-elicited inflammatory processes not only decrease albumin production by the liver, but also increases microvascular permeability, resulting in extravasation of albumin [30].
As described above, cancer-associated inflammatory conditions increase neutrophils, PLT, and CRP but decreases lymphocytes and albumin by different pathways. In many studies, these values are combined into calculated inflammatory variables (NLR, PLR, and CRP-albumin ratio). These variables have been validated as prognostic markers [12-15]. Based on results of the present study, these calculated variables (NLR, PLR, and CRP-albumin ratio) were found to be more predictive than other markers of inflammation. Furthermore, each of them (NLR, PLR, and CRP-albumin ratio) was shown to be significant independent risk factor after they were adjusted for each other in this study. The precise mechanism by which cancer affects NLR, PLR, and CRP-albumin ratio remains unclear. Further studies are needed to examine the exact clinical significance of these markers.
Several drugs targeting inflammation have been approved by the U.S. Food and Drug Administration (FDA). They modulate proinflammatory pathways [31]. Because unwanted chronic ROS stress is considered to be carcinogenic, several antioxidants have been evaluated for cancer treatment in various trials. However, most of these have conclusively failed [32]. Rather than eradicating ROS, controlling ROS modulator-1 (Romo1), its upstream regulator [33], could be another choice. Due to the fact that a corrupted tumor microenvironment with inflammation is one of barriers against major anti-cancer effector cells like CD8+ T-cells [17], regulating harmful inflammation could benefit these immunotherapeutic approaches. The increase of inflammatory markers in the current study might indicate that harmful chronic inflammation increase while beneficial acute inflammation decrease, even though further studies are mandated to verify this. Measuring these markers can help investigators better decide when to use treatments aimed at inflammation in future studies.
The current study has several limitations. First, this study was a single-center retrospective study. However, on the other hand, this limitation would be advantageous, since consistent standard of analysis and the same testing equipment were used in this single center, from 2004 to 2016. Second, patients underwent various treatments before the first-line palliative chemotherapy which might have altered the effect on survival. This effect was compromised because all survival analyses and laboratory data collections including the inflammatory markers started with the beginning of first-line chemotherapy. Not only that, in order to conduct the current study in as homogenous patients' group as possible, we enrolled only unresectable treatment-naïve patients or patients who relapsed at least 6 months after the end of treatment with curative intent including surgical resection and adjuvant treatment. To the best of our knowledge, this study estimated the prognostic value of inflammatory markers in the largest homogenous PC cohort, in which all patients underwent gemcitabine-based first-line chemotherapy. Third, the specificity of the inflammatory markers chosen in the current study is comparatively low. This limitation is expected to be complemented by further studies to identify cytokine levels such as interferon α or gene signatures, which are currently being spotlighted in the field of immunotherapy. There has been no optimal cut-off levels for NLR, PLR, or CRP-albumin ratio yet. Thus, we used ROC analyses to determine their ideal cut-off levels and found that AUCs of NLR, PLR, and CRP-albumin ratio were comparable to those reported in previous studies [12]. Further study is needed to verify these cut-off values.
In conclusion, of various inflammatory markers, NLR, PLR, and CRP-albumin ratio were found to be independent prognostic indicators of OS while NLR and CRP-albumin ratio were found to be independent prognostic indicators of PFS in unresectable or recurred PC patients treated with gemcitabine-based chemotherapy as a first-line regimen. While each of these three markers (NLR, PLR, CRP-albumin ratio) has value to independently predict outcomes in patients with advanced and metastatic PC, they might have more values when they are combined and analyzed together.
KEY MESSAGE
1. Of various inf lammatory markers, neutrophil to lymphocyte ratio (NLR), platelet to lymphocyte ratio (PLR), and C-reactive protein (CRP)-albumin ratio were found to be independent prognostic indicators of overall survival in pancreatic cancer (PC) patients treated with gemcitabine-based chemotherapy as a first-line regimen.
2. NLR and CRP-albumin ratio were found to be independent prognostic indicators of PFS in PC patients treated with gemcitabine-based chemotherapy as a first-line regimen.
3. While each of these three markers (NLR, PLR, CRP-albumin ratio) has value to independently predict outcomes in patients with advanced and metastatic PC, they might have more values when they are combined and analyzed together.
 PDF Links
 PubReader
 ePub Link
 Full text via DOI
 Download Citation
 Print
Print


