


INTRODUCTION
Liver cirrhosis remains a major cause of death worldwide [1]. Although the pathogenesis of cirrhosis is complex, liver fibrosis due to various causes is a major contributor [2]. Liver biopsy is the gold standard for assessing liver fibrosis, but it has several limitations such as invasiveness, sampling error, and intra- and inter-observer variation [3,4]. Liver stiffness (LS) measurement using ultrasound-based elastography to assess liver fibrosis is now a well-accepted alternative, and its diagnostic accuracy has been confirmed [5-9]. Furthermore, it is able to predict cirrhosis-related complications and mortality [10-12]. To date, most studies assessing liver fibrosis by measuring LS have used transient elastography (TE) [13]. TE is the prototype introduced for this purpose and is the most widely used tool, but it has the disadvantage of not being able to measure LS in patients with ascites [14]. Recently, real-time two-dimensional shear wave elastography (2D-SWE) has been introduced, which has the advantage of accurately measuring LS in patients with ascites. In addition, several studies showed that LS measurements of liver fibrosis using 2D-SWE were not inferior to TE [5,6,15].
Portal hypertension can cause cirrhosis-related complications such as ascites, variceal bleeding and portosystemic encephalopathy, which eventually increase mortality [16]. Measurement of the hepatic venous pressure gradient (HVPG) is the most accurate and direct method of assessing portal hypertension and is a useful surrogate marker for predicting the development of cirrhosis-related complications and mortality in patients with cirrhosis [17-19]. HVPG value of 16 mmHg has been suggested to be a good cut-off for predicting death [20-22].
Although there is a good correlation between LS and HVPG [23-25], both are affected by the clinical course of chronic liver disease, and we have often observed discrepancies between HVPG and LS in real-life clinical practice, especially in cirrhotic patients with clinically significant or severe portal hypertension (HVPG Ōēź 10 or 12 mmHg) [26,27]. In addition, LS cannot completely replace HVPG as a tool for measuring portal hypertension because it reflects portal hypertension indirectly [9]. Therefore, both HVPG and LS on their own may have limitations in predicting mortality in patients with cirrhosis.
To date, there is no published study of the combined effect of HVPG and LS on mortality in patients with cirrhosis. We therefore performed this study to investigate the mortality of patients with cirrhosis as a combination of both HVPG and LS, and examined how mortality might change in patients in whom HVPG and LS were not well-correlated.
METHODS
Patients
We retrospectively identified patients with cirrhosis who underwent measurements of both HVPG and LS in Hanyang University Guri Hospital, between December 1st, 2009 and September 31st, 2013. Cirrhosis was diagnosed clinically, histologically, or radiologically. HVPG was measured in patients with esophageal or gastric varices, or a history of decompensation to evaluate the degree of portal hypertension for the first time. Patients in whom HVPG and LS were measured within 1 week of each other were enrolled. Those with unstable hemodynamic status, active infection, acute gastrointestinal bleeding within 4 weeks, recent heavy alcohol consumption, or malignancy including hepatocellular carcinoma were excluded. The primary outcome was all-cause mortality. All patients were followed-up from the date of index presentation until the date of death or June 31st, 2017.
Data collection
Clinical data were obtained from the electronic medical record system of our institution. The following variables were obtained: age, gender, causes of cirrhosis, HVPG, LS, severity of ascites, presence of hepatic encephalopathy, and laboratory data (platelet count, serum creatinine, sodium, bilirubin, albumin, aminotransferase, prothrombin time with international normalized ratio [INR]). These variables were recorded when HVPG was measured.
Patients were classified as class A, B, and C according to their Child-Pugh scores [28]. Model for end-stage liver disease (MELD) scores were also calculated [29]. The severity of ascites was classified as grade 1, 2 or 3, as documented in the medical records [30]. The presence or absence of hepatic encephalopathy was evaluated according to the West-Haven criteria [31], excluding structural disorders of the brain.
Measurement of LS and HVPG
2D-SWE was performed to assess LS using an Aixplorer US system (SuperSonic Imagine S.A, Aix-en-Provence, France) and a convex broadband probe (1 to 6 MHz). All procedures were carried out by one of three experienced operators as part of their regular practice. All the operators were certified abdominal radiologists with at least 5 yearsŌĆÖ experience of liver ultrasonography, and had used 2D-SWE to measure LS in at least 100 cases at the outset of the study. The transducer was placed in the right intercostal space to visualize the right lobe of the liver, and the target area was set at a depth of at least 2 cm from the hepatic capsule to avoid major vessels. Patients were asked to hold their breath after exhaling for about 5 seconds, during which time a cine loop was obtained, including a 2D-SWE color map. It was measured five times for each patient, and the results were expressed in kilopascals (kPa). The median value was considered to represent the LS.
HVPG was measured by an experienced interventional radiologist. A 6-Fr balloon-tip catheter (Arrow Interventional Inc., Cleveland, OH, USA) was inserted into the right internal jugular vein under ultrasound guidance, and advanced to the intrahepatic inferior vena cava and placed right or mid-hepatic vein with guidance from fluoroscopy. After inflating the balloon with air, a small amount of contrast agent was injected to confirm that the catheterized vein was adequately occluded without intrahepatic venous shunts. Free and wedged hepatic pressures were measured while deflating and inflating the balloon. HVPG was obtained three times, by subtracting the free hepatic venous pressure from the wedged hepatic venous pressure, and the mean value was used.
Stratification of patients
An HVPG value of 16 mmHg is considered a good cutoff for predicting long-term mortality in patients with cirrhosis [20-22], and we adopted this value. However, since there is no known cut-off value for LS for predicting death in patients with cirrhosis, we divided individuals using a median value of LS of 26.5 kPa.
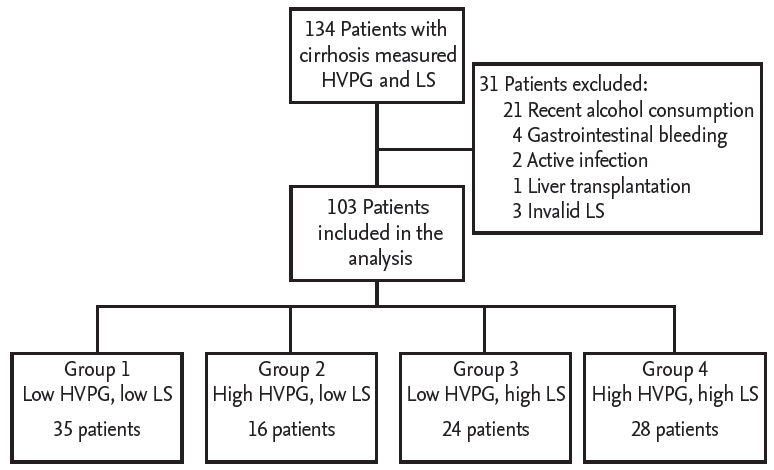
Patients were categorized as follows: patients with H VPG < 16 mmHg and LS < 26.5 kPa were classified as group 1; patients with HVPG Ōēź 16 mmHg and LS < 26.5 kPa were classified as group 2; patients with HVPG < 16 mmHg and LS Ōēź 26.5 kPa were classified as group 3; patients with HVPG Ōēź 16 mmHg and LS Ōēź 26.5 kPa were classified as group 4.
Statistical analysis
The normality of the quantitative variables was evaluated using the Shapiro-WilkŌĆÖs test. Data are presented as mean and standard deviation for variables that follow a normal distribution, as median and interquartile range (IQR) for variables that do not follow a normal distribution, and as frequencies and percentages for categorical variables. Characteristics of groups 1, 2, 3, and 4 were compared using the chi-square or Kruskal-Wallis test and the one-way analysis of variance (ANOVA) test with the post hoc test (TukeyŌĆÖs test using ranks) as appropriate. Kaplan-Meier survival analysis and log-rank test were used to obtain survival curves and statistical significance, respectively. Univariable and multivariable analyses were performed using Cox regression models to identify predictors of death. Risk of death was presented as hazard ratio (HR) with 95% confidence interval (CI). A p value of less than 0.05 was considered to be statistically significant. To evaluate the prognostic performances of HVPG and LS for mortality, we performed time-dependent receiver operating characteristic (ROC) curve analysis. The best cut-off values were calculated based on Youden index. A formula for predicting mortality by combining HVPG and LS was calculated using a logistic regression model. All statistical analyses were performed using IBM SPSS Statistics version 20.0 (IBM Corp., Armonk, NY, USA) and the R statistical language R Studio version 3.4.3 (R Foundation for Statistical Computing, Vienna, Austria).
Ethical approval
This study conformed to the ethical guidelines of the 1975 Declaration of Helsinki, and was approved by the Institutional Review Board of Hanyang University Guri Hospital (IRB No. 2014-04-007-007). Informed consent was waived by the IRB because the study was conducted retrospectively with the previously measured HVPG and LS according to the appropriate clinical judgment.
RESULTS
Clinical characteristics
The data of 134 patients with liver cirrhosis were collected. After excluding 31 patients, 103 were finally analyzed (Fig. 1). Of the 103, 67 (65%) were male, and the median age was 53.0 years (IQR, 47.5 to 58.5). The causes of liver cirrhosis were alcohol in 53 cases (51.5%), hepatitis B virus in 31 (30.1%), hepatitis C virus in eight (7.8%), and other causes in 11 (10.7%). Twenty-six patients (29%) were using non-selective beta blockers (NSBB) at baseline. The median MELD and Child-Pugh scores were 9 (IQR, 7 to 14) and 7 (IQR, 6 to 9), respectively. The mean HVPG was 15.2 ┬▒ 5.2 mmHg, and the median LS was 26.5 kPa (IQR, 15.9 to 35.8).
Over a median of 47.3 months (range, 0.8 to 90.6; total person-years, 365.2) of follow-up, there were 18 deaths (17.5%). Causes of death were spontaneous bacterial peritonitis (22.2%), hepatorenal syndrome (27.8%), hepatic encephalopathy (27.8%), gastrointestinal bleeding (5.6%), and others (16.6%). The survivors had significantly lower INR, Child-Pugh score, HVPG and LS, and higher serum albumin than non-survivors (Table 1).
Independent predictors of mortality
Table 2 shows the results of univariable and multivariable analyses of potential mortality predictors. In the univariable analysis, the following variables were significantly associated with death: presence of grade 3 ascites, serum albumin, prothrombin time, serum sodium, HVPG, LS, MELD score, and Child-Pugh score. Multivariable analysis including age, sex, presence of grade 3 ascites, serum albumin, prothrombin time, and sodium showed that both HVPG and LS were significantly associated with increased mortality (HVPG: HR, 1.127 [95% CI, 1.020 to 1.245]; LS: HR, 1.062 [95% CI, 1.015 to 1.110]).
Survival according to the combination of HVPG and LS
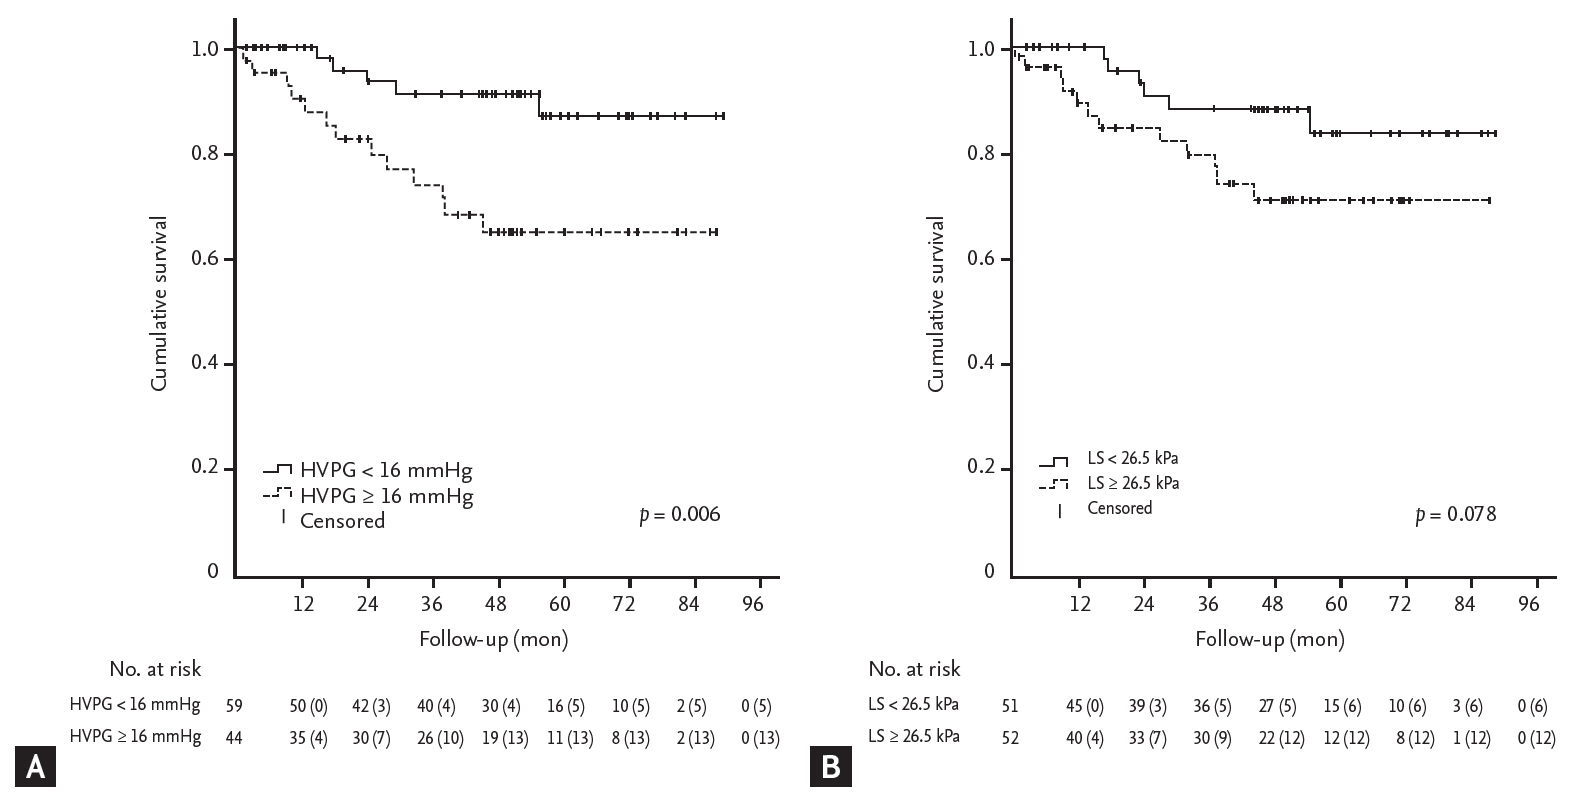
All patients were dichotomized based on the reference values of HVPG, 16 mmHg, and LS, 26.5 kPa, and a survival analysis was performed. The mortality rate was significantly higher in patients with HVPG Ōēź 16 mmHg than in those with HVPG < 16 mmHg (p = 0.006), but there was no statistically significant difference in mortality between patients with LS Ōēź 26.5 kPa and those with LS < 26.5 kPa (p = 0.078) (Fig. 2).
Patients were classified into four groups according to LS and HVPG, as mentioned above. There were 35 (34.0%), 16 (15.5%), 24 (23.3%), and 28 patients (27.2%) in groups 1, 2, 3, and 4, respectively. The four groups were comparable with regard to age, sex, body mass index, presence of diabetes, etiology of liver disease, and the use of NSBB at baseline. There were significant differences in platelet count, albumin, total bilirubin, sodium level, Child-Pugh score, and MELD score between the four groups. Grade 3 ascites was more common in group 4 than in group 1, 2, and 3. Platelet count was higher in group 3 than in group 1, 2 and 4. Child-Pugh and MELD scores were higher in group 4 than in groups 1 and 2, and higher in group 3 than in group 1 (Table 3).
The mortality of group 4 patients was significantly higher than that of the other groups (vs. group 1, p = 0.005; vs. group 2, p = 0.049; vs. group 3, p = 0.004), and there were no significant differences in mortality between groups 1, 2, and 3 (Fig. 3).
HVPG and LS according to etiology of cirrhosis
We investigated the differences of HVPG and LS between patients with alcoholic cirrhosis (n = 53) and hepatitis B and C virus-associated cirrhosis (n = 39). The mean HVPG was not different between patients with alcoholic cirrhosis and hepatitis virus-associated cirrhosis (15.4 ┬▒ 4.4 mmHg vs. 15.4 ┬▒ 5.5 mmHg, p = 0.998). However, the median LS was significantly higher in patients with alcoholic cirrhosis than in those with hepatitis virus-associated cirrhosis (29.1 kPa [IQR, 20.6 to 39.9] vs. 21.4 kPa [IQR, 15.1 to 30.9], p = 0.004).
HVPG and LS according to the use of NSBB at baseline
We investigated the differences of HVPG and LS between NSBB users (n = 26) and non-users (n = 77). Propranolol was used as NSBB, with the median dose of 80 mg (IQR, 80 to 120), for more than 3 months before enrollment. The mean HVPG was not different between NSBB users and non-users (15.9 ┬▒ 5.8 mmHg vs. 15.4 ┬▒ 5.0 mmHg, p = 0.677). The median LS was relatively lower in NSBB users than in non-users, but it was not statistically significant (21.0 kPa [IQR, 15.7 to 30.1] vs. 27.6 kPa [IQR, 15.9 to 37.3], p = 0.105).
Performance of HVPG and LS for predicting mortality
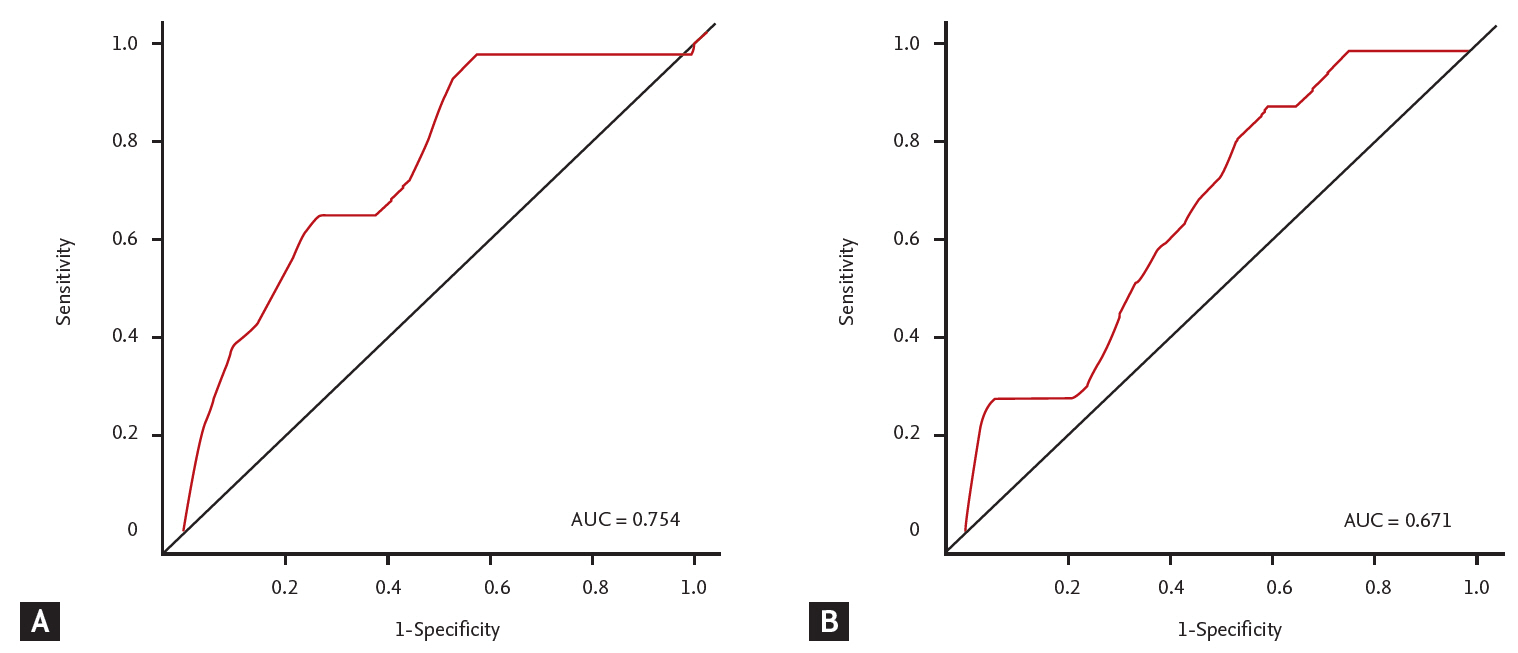
To evaluate the operating characteristics of HVPG and LS as predictors of death, we conducted a time-dependent ROC analysis. The areas under the ROC curve (AUROC) for HVPG and LS predicting mortality at 2 years were 0.754 and 0.671, respectively (Fig. 4). The best cutoff values of HVPG and LS for predicting mortality at 2 years were 13.7 mmHg and 20.9 kPa, respectively. Patients were dichotomized using these cut-off values and further analyzed for mortality predictors. Multivariable analysis including age, sex, presence of grade 3 ascites, serum albumin, prothrombin time, and sodium showed that patients with HVPG > 13.7 mmHg were significantly associated with increased mortality (HR, 3.848; 95% CI, 1.102 to 13.442; p = 0.035), but patients with LS > 20.9 kPa were not (HR, 0.861; 95% CI, 0.229 to 3.239; p = 0.825).
An analysis of maximum likelihood estimates was performed to calculate a formula for predicting mortality by combining HVPG and LS. The formula was as follows:
ROC curve analysis was performed using this formula. For predicting mortality, the AUROC was 0.740, the calculated best cut-off value was ŌĆō1.820, with sensitivity of 66.7% and specificity of 74.1%.
DISCUSSION
We investigated the combined effect of HVPG and LS on long-term mortality of patients with cirrhosis. Patients with high HVPG and high LS (group 4) had higher mortality than the other patients. We found that high HVPG and high LS were both independent risk factors for death, as previously reported [10-12,20-22]. However, there were no significant differences in mortality between patients in groups 1, 2, and 3. Because HVPG and LS were known to be independent risk factors for death, it was predictable that patients with both high HVPG and high LS should have the highest mortality. Interestingly, however, mortality in patients in groups 2 and 3, in which HVPG and LS are discrepant, was not significantly higher than in group 1 (HVPG and LS both low).
The natural history of cirrhosis is strongly dependent on portal hypertension and related complications [18,21]. Therefore, many researchers have aimed to predict mortality in patients with cirrhosis by measuring the degree of portal hypertension. HVPG directly measures the degree of portal hypertension, and an HVPG value of 16 mmHg is a well-established cut-off for predicting mortality in patients with cirrhosis [20-22]. In addition, since liver fibrosis contributes significantly to the development of portal hypertension, death of cirrhotic patients has been predicted by measuring the extent of liver fibrosis [10-12]. LS, as an alternative to liver biopsy, is the most reliable non-invasive measure of liver fibrosis [32,33], and has been identified as an independent risk factor for death in patients with cirrhosis [10-12]. However, the best cut-off value of LS for predicting mortality in patients with cirrhosis is not known, and there are often discrepancies between HVPG and LS in real-life practice, especially in patients with clinically significant or severe portal hypertension.
Portal hypertension develops as a result of structural distortion by fibrosis, as well as of microvascular thrombosis, dysfunction of liver sinusoidal endothelial cells, and hepatic stellate cell activation [34]. Stellate cell contractility is regulated by endothelin and nitric oxide and appears to play important roles in modulating local sinusoidal blood flow [35]. Moreover, the vascular endothelial growth factor and platelet-derived growth factor pathways are crucial for angiogenesis, which contributes significantly to the development of portal hypertension [36]. Since many of these factors contribute to the development of portal hypertension, the extent of fibrosis is not consistent with the extent of portal hypertension.
LS and HVPG are generally well-correlated [23-25], but the association between them is weakened when HVPG is Ōēź 10 to 12 mmHg, because splanchnic vasodilatation and hyperdynamic circulation become important secondary events in the late phase of portal hypertension, whereas simple accumulation of fibrillary extracellular matrix is predominant in the early phase. This implies that portal hypertension is only partially caused by the amount of fibrosis [26,27]. Furthermore, LS varies widely depending on the underlying cause of the liver disease, and it is reported that the cut-off value of LS that predicts clinically significant portal hypertension (CSPH; defined as HVPG > 10 mmHg) varies across the studies [37]. Previous studies have reported that the cut-off value of LS predicting CSPH is higher in patients with alcohol-related cirrhosis than in patients with hepatitis C virus-related cirrhosis [38]. Liver fibrosis in alcoholic liver disease is perivenular and pericellular with central expansion, implying that the overall extent of liver fibrosis is higher in patients with alcoholic liver disease than in those with hepatitis C virus infection, and consequently with higher LS [39,40]. Therefore, patients with alcoholic cirrhosis may have relatively high LS but relatively low HVPG. Conversely, patients with chronic hepatitis B virus-associated cirrhosis who have been treated with long-term antiviral agents may have relatively low LS but relatively high HVPG, because long-term antiviral therapy can improve LS [41]. The fact that the underlying causes of cirrhosis were heterogeneous in this study may explain why there were patients with severe fibrosis but no severe portal hypertension (group 3), and vice versa (group 2). Although there was no statistically significant difference in etiology of cirrhosis between groups, the proportion of hepatitis virus-associated cirrhosis was relatively high in group 2 and alcoholic cirrhosis was relatively high in group 3 (Supplementary Fig. 1).
Thus it is not appropriate to use one specific LS value for predicting death, without considering the underlying cause of the chronic liver disease. In addition, as a time-dependent ROC analysis showed, performance of LS for predicting mortality was inferior to that of HVPG. However, LS has the advantage of being noninvasive, easy to implement, and reproducible for monitoring. Furthermore, the result of this study suggests that the long-term prognosis may be relatively good if either LS or HVPG is below a certain level. Thus it may be a useful strategy to measure LS first as a noninvasive test, and to predict prognosis by measuring HVPG as well if LS is high.
This study has some limitations. Because it was a retrospective study with a relatively small sample size, statistical power was not adequate, and we could not analyze the impact of ongoing alcohol consumption. Second, study population was heterogeneous in etiology and included a significant number of NSBB users. Because there was no significant difference in HVPG between NSBB users and non-users, it was considered that significant number of non-responders to NSBB were included. Third, we divided the groups using the median LS value of 26.5 kPa, which is an arbitrary reference value, because there was no known cut-off value of LS to predict mortality in patients with cirrhosis and an independent reference LS value that did not interact with HVPG in a single dataset was required. Further study is needed to validate the cut-off value of LS we have proposed to predict mortality in patients with cirrhosis.
However, to our knowledge, this was the first study to analyze the combined effect of HVPG and LS, using 2D-SWE, on mortality in patients with cirrhosis. To date, most studies on the usefulness of LS for predicting portal hypertension and mortality have been done using TE. However, TE cannot measure LS in patients with ascites because the low frequency elastic waves do not propagate through liquids [42]. To overcome this disadvantage, we used 2D-SWE to measure LS. In this way we could measure LS in patients with ascites, and therefore we could analyze the mortality of all cirrhotic patients with or without ascites.
In conclusion, we found that HVPG and LS can be combined to predict the mortality of patients with cirrhosis. Patients with concurrent elevation of HVPG and LS showed the worst prognosis. However, mortality did not increase significantly when either HVPG or LS alone was elevated.
KEY MESSAGE
1. Hepatic venous pressure gradient (HVPG) and liver stiffness (LS) can be combined to predict the mortality of patients with cirrhosis. Concurrent elevation of HVPG and LS showed the highest long-term mortality rates in patients with cirrhosis.
2. However, when either HVPG or LS alone was elevated, mortality did not increase significantly.

 PDF Links
 PubReader
 ePub Link
 Full text via DOI
 Download Citation
 Supplement 1
 Print
Print


