


INTRODUCTION
Metabolic syndrome (MetS) is composed of multiple risk factors including high blood pressure, abdominal obesity, dyslipidemia, and abnormal glucose metabolism. There is no unified definition of MetS [1]. However, all of the above conditions are useful indicators to help identify patients at increased risk for not only cardiovascular disease but also for all-cause mortality [2].
MetS has emerged as a major public health concern worldwide. The prevalence of MetS has increased by more than 25% in the United States [3]. There have been several studies on medical costs of MetS and related diseases because the economic burden of MetS has been greatly increasing. In the Cardiovascular Health Study (CHS), the total costs to Medicare were 20% higher among participants with MetS than that of those without MetS [4,5]. The economic burden of medical care for MetS in patients with hypertension is forecasted to increase by 59%, 179%, and 157% in Germany, Spain, and Italy, respectively, by 2020 [5].
In this global trend, South Korea is no exception. The age-adjusted prevalence of MetS increased sharply from 24.9% in 1999 to 31.3% in 2007 according to data from the Korean National Health and Nutrition Examination Survey conducted between 1998 and 2007 [6]. The local government of Seoul has operated public health centers participating in the MetS management program since 2010 [7]. In a cross-sectional study, Kong et al. [8] reported that workers in small-scale enterprises were more likely to have MetS and to spend more on medical costs for major diseases related to MetS. However, nationwide cost analyses of MetS using a longitudinal database are lacking.
The aim of this study was to analyze the direct medical costs of MetS using longitudinal data of the South Korean population and to examine the influence of each component of MetS on medical costs in South Korea.
METHODS
Statement of ethics
This study adhered to the tenets of the Declaration of Helsinki and was approved by the Institutional Review Board of Catholic Kwandong University International St. Mary’s Hospital, South Korea (IS14EISI0015). The requirement for written informed consent was waived.
Database
This study used a retrospective cohort design and included data from the National Sample Cohort database, collected from 2002 to 2013 which was released by the Korean National Health Insurance Service (KNHIS). It is compulsory for all citizens and medical providers in South Korea to participate in the Medical Assistance Program or the Medical Care for Patriots and Veterans Affairs Scheme conducted by the KNHIS. Therefore, a complete enumeration of medical costs, except any unsubsidized costs such as those of cosmetic surgery or novel, unproven treatment, is centralized in the KNHIS databases. Claims submitted by medical providers are accompanied by data, including diagnostic codes, procedures, prescription drugs, personal information of the patient, and direct medical costs of both inpatient and outpatient care. The KNHIS uses the Korean Classification of Diseases (KCD) [9], which is similar to the International Classification of Diseases (ICD).
The KNHIS has managed national health checkup programs biennially for all insured individuals and their dependents since 1980. Approximately, 66% of the target population was reported to have participated in these health checkup programs in 2009 [10].
Study sample
The National Sample Cohort database represented approximately 2.2% of the entire population in the KNHIS in 2002. The database was sampled systematically to represent the individual total annual medical expenses within each of the 1,476 strata defined by age, sex, employment condition, and income level combinations (n = 46,605,433). Subjects who underwent a national health checkup and were older than 20 years in 2009 were enrolled (n = 204,768). Patients who had been treated for cancer (denoted by KCD codes C, corresponding to ICD, 9th Revision, Clinical Modification [ICD-9-CM] codes 140-239) between 2007 and 2008 or who died between 2009 and 2013 were excluded because of a sudden increase in medical care costs near the verge of death and after cancer diagnosis.
Definitions of metabolic syndrome and related diseases
We defined MetS according to the modified National Cholesterol Education Program-Adult Treatment Panel III criteria, the abdominal obesity criteria of the Korean Society for the Study of Obesity [11], and the usage of anti-hyperlipidemic drugs. The following components were considered:
(1) Abdominal obesity (waist circumference ≥ 90 cm in men and ≥ 85 cm in women);
(2) Elevated triglycerides (≥ 150 mg/dL) or use of anti-hyperlipidemic drugs;
(3) Low level of high density lipoprotein cholesterol (HDL-C) (< 40 mg/dL in men and < 50 mg/dL in women);
(4) Elevated blood pressure (systolic blood pressure ≥ 130 mm Hg; diastolic blood pressure ≥ 85 mmHg) or use of antihypertensive drugs;
(5) Elevated fasting plasma glucose levels (≥ 100 mg/dL) or use of hypoglycemic drugs.
Individuals having three or more of the above components were defined as having MetS.
We used the health checkup data of 2009 because the KNHIS did not include data of waist circumference and HDL-C and triglyceride levels until late 2008. Patients using antihyperglycemic, antihypertensive, and antihyperlipidemic agents were considered to have diabetes mellitus, hypertension, and dyslipidemia, respectively, even though they showed normal clinical values for the associated tests. All diagnosis codes were collected from claims in 2007-2008 for cardiac disorders (KCD codes I20-25, corresponding to ICD-9-CM codes 410-414), stroke (KCD codes I60-169, corresponding to ICD-9-CM codes 430-438), hypertension (KCD codes I10-13, corresponding to ICD-9-CM codes 401-404), dyslipidemia (KCD codes I20-25 and I60-69, corresponding to ICD-9-CM codes 272.4), and diabetes mellitus (KCD codes E10-14, corresponding to ICD-9-CM codes 249-259). The questionnaires of national health checkups were also used to define the underlying diseases of the subjects.
Cardiovascular and cerebrovascular diseases that are not directly related with MetS or have ambiguous definition were not considered in this study. More specifically, cardiac disorders such as valvular heart disease (KCD codes I05-09 and I35-39) and arrhythmia (KCD codes I44-49) and cerebrovascular diseases such as cerebral hemorrhage (KCD codes I60-62) and cerebral aneurysm (KCD codes I64-69) were excluded.
Lifestyle assessment
Lifestyle factors like smoking status [12], alcohol consumption [13], and level of physical exercise [14] are associated with MetS. For lifestyle assessment, a health checkup questionnaire that gathered data about smoking, drinking, and exercise status was used [15]. Exercise status was reclassified according to the recommendations of the World Health Organization [16]. Drinking levels were redefined according to the criteria of the National Institute on Alcohol Abuse and Alcoholism [17].
(1) Smoking: Subjects were classified as nonsmokers, past smokers, and current smokers. Nonsmokers were subjects who had never smoked a cigarette. Past smokers were subjects who had smoked but quit prior to 2009. Current smokers were subjects who smoked consistently in 2009.
(2) Alcohol consumption: Drinking was classified by the frequency of alcohol consumption and the number of glasses of alcohol consumed on each occasion. Nondrinkers were subjects who drank less than once a week and one glass at a time. Social drinkers were subjects who drank one to two times a week and one to four glasses at a time. Heavy drinkers were subjects who drank three or more times a week and five or more glasses at a time.
(3) Exercise status: Physical activity was classified into nonactive and active categories. The nonactive category included subjects who performed < 150 minutes of moderate-intensity exercise or 75 minutes of vigorous-intensity exercise per week. The active category included subjects who performed > 300 minutes of moderate-intensity exercise or 150 minutes of vigorous-intensity exercise per week.
Household income level
Low income appears to be associated with a high prevalence of MetS [18]. The major sources of KNHIS financing are contributions from insured individuals and from government subsidies. Almost all citizens are registered with and contribute to the KNHIS. Contributions differ according to income and wealth [19]. The National Sample Cohort database classified insured individuals and their dependents into 11 levels according to the amount of contribution [20]. We used their classification as a substitute variable for household income level.
Costs and statistical analysis
Direct medical costs included the cost of a defined intervention and all follow-up costs including those for other medications and health care interventions in ambulatory, inpatient, and nursing care. Direct non-medical costs included costs for transportation and additional paid caregiver time. Indirect costs included the value of lost output (impairment or disability to work) due to a disease or disorder [21].
We obtained medical claims data from the KNHIS to describe direct medical costs, including inpatient, outpatient, laboratory, and pharmacy utilization, which covered all subsidized medical services of medical institutions, pharmacies, and dental and oriental medicine clinics, for each subject from 2009 to 2013. Patient copayments and deductibles were included in the direct medical costs.
These costs were valued in 2013 Korean won [22] and then converted to US dollar (USD) according to the exchange rate in 2009 to 2013 (1 USD = 1,152 Korean won) [23].
Descriptive statistics of the study population at baseline were presented using numbers and frequencies for categorical variables and using geometric means with standard deviations (SD) for continuous variables. Student’s t tests were performed to compare continuous variables. The chi-square test and analysis of variance were performed for comparing between categorical variables of the two groups. Medical costs were presented as unadjusted means with standard errors.
We used generalized linear mixed models to analyze trends of direct medical costs on a yearly basis or by the number of MetS components. Simple and multiple regression models were used to assess the independent contributions of each MetS component. We used SAS version 9.4 (SAS Institute, Cary, NC, USA) for all analyses, and p < 0.05 was considered to be statistically significant.
RESULTS
Baseline characteristics
Characteristics of subjects at baseline are listed in Table 1. Twenty-two percent of the subjects met the modified National Cholesterol Education Program-Adult Treatment Panel III criteria for MetS. The proportion of subjects older than 65 years was higher in the MetS group than in the non-MetS group. The number of men was slightly higher than the number of women in the MetS group. As expected, the subjects with MetS were more likely to have high blood pressure, high levels of fasting blood glucose and triglycerides, greater waist circumference, and low levels of HDL-C than subjects without MetS. Among the parameters evaluated using blood test, serum creatinine level, which reflects renal function, was the only parameter that was not significantly different between the two groups (p = 0.336). Furthermore, subjects with MetS had a higher chance of having hypertension, diabetes mellitus, cardiac disorders, and stroke than those without MetS. Subjects without MetS were more physically active. Unexpectedly, subjects in the MetS group were less likely to smoke or drink alcohol, compared to non-MetS group. Furthermore, subjects with MetS had higher house-hold income than those without MetS. Similar patterns were observed after stratification by sex (Supplementary Tables 1 and 2).
The direct medical costs of metabolic syndrome
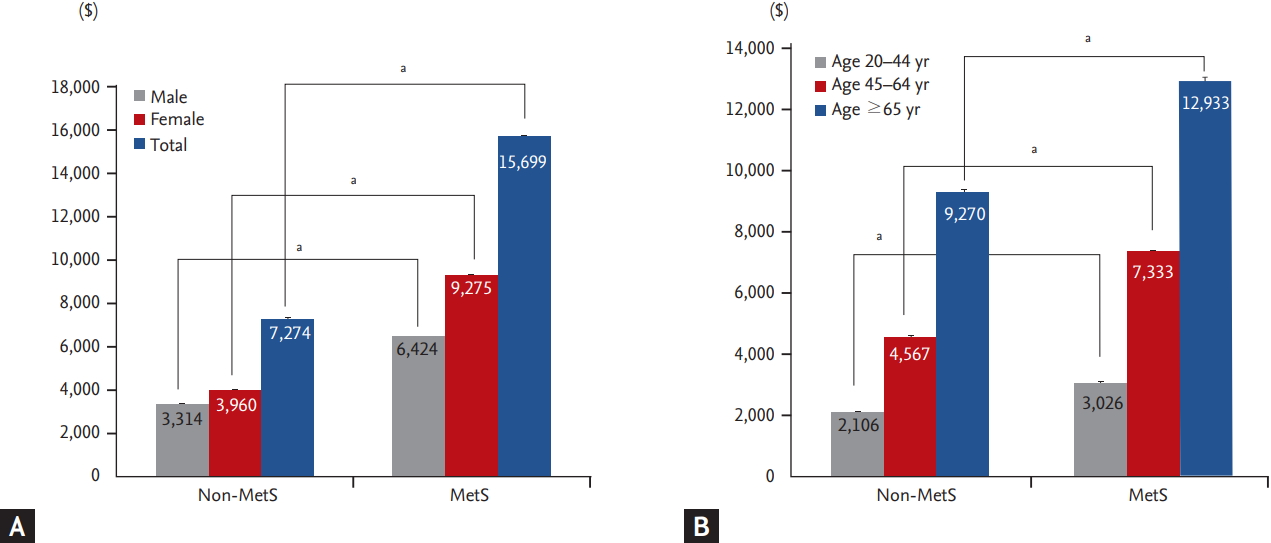
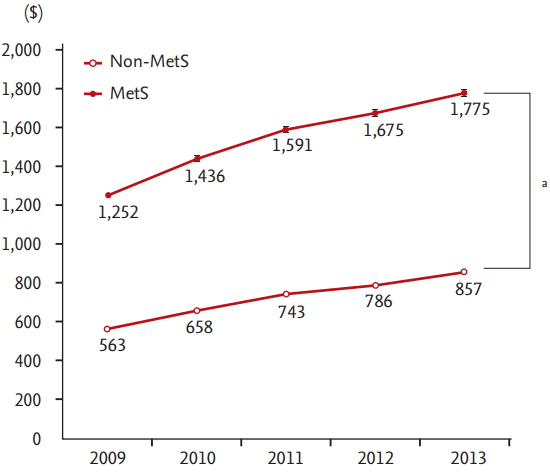
Fig. 1 shows the direct medical costs subsidized by the KNHIS from 2009 to 2013. The direct medical costs of subjects with MetS for 5 years were 2.16 times higher than that of those without MetS. Women and older individuals spent more than males and young individuals, respectively, in both groups in total and in each year. The annual costs increased consistently in 5 years in both groups (Fig. 2). The intra- and inter-group differences of yearly costs were significant (p < 0.001).
The influence of metabolic syndrome components on medical costs
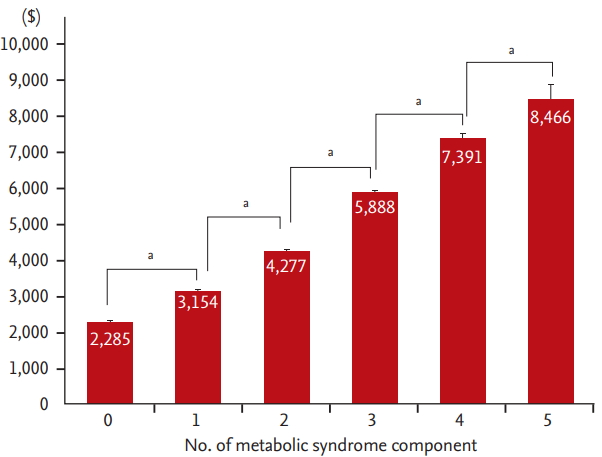
Fig. 3 shows annual costs according to the number of MetS components. The medical care costs incurred over 5 years increased with each additional MetS component present. Presence of every additional risk factor resulted in a significant increase in medical costs (p < 0.05), even if the patient had less than three of the mentioned MetS components.
Table 2 shows the results of the simple and multiple regression models. In models I to VI, we examined how much the cost increased by each MetS component using the simple regression model. MetS and all five of its components were significantly associated with higher medical costs over the 5 years. Even after controlling for age, sex, household income level, smoking status, drinking level, and exercise status, MetS and each of its components had incurred more medical costs, except low HDL-C level (p = 0.601). The parameter estimates of each component ranged from 1,335 USD for abdominal obesity to 2,401 USD for MetS per se in multiple regression models I to VI. When we analyzed the effects of multiple risk factors simultaneously using model VII, the parameter estimates decreased but remained highly statistically significant (p < 0.001 for all components except p = 0.485 for low HDL-C level). After further adjustment for cardiac disorders and stroke in the multiple regression model VIII, a modest but not significant decrease was observed in the size of estimates for MetS per se and for each component. After stratifying by sex, low HDL-C level was statistically significant but had no economic impact (Supplementary Tables 3 and 4).
DISCUSSION
In this retrospective cohort study, we found that the direct medical costs subsidized by the KNHIS were associated with MetS per se and with each of its components during a 5-year period. There have been several studies investigating the relationship between medical costs and MetS. However, they either covered only an age group and region [4,8,24] or were cross-sectional studies [8,25]. To our knowledge, this is the first study using a nationwide and longitudinal database in South Korea.
Our results are consistent with those of previous studies examining the impact of MetS and its components on medical costs. However, the specific figures are somewhat different. In the CHS, total costs to Medicare were 20% higher among participants with MetS than among those without MetS (40,873 USD vs. 33,010 USD, p < 0.001) [4]. Korean workers with MetS paid a minimum of 2.0 times to a maximum of 16.4 times more than those without MetS for treatment of major diseases related to MetS [8]. In our study that covers both study populations, subsidized medical costs between the two groups differed by a magnitude of 2.61. The conjectured reasons are that the difference in costs is reduced with age and that the study of Korean workers excluded the costs unrelated to MetS. Boudreau et al. [25] found that total costs increased by an average of 24% per additional risk factor (p < 0.001). The average rate of increase was 30.6% per additional risk factor in our study (p < 0.001). We attributed this difference to our study population that had more subjects with cardiac disorders in the MetS group than in the non-MetS group (15.7% vs. 9.1%). In fact, another study, in which the proportion of subjects with cardiac disorders in the MetS group was 17.6%, found an approximate 60% increase in medical costs per additional risk factor [24].
The results of previous studies have been inconsistent regarding the association between medical costs and MetS components. In the CHS, abdominal obesity, low HDL-C level, and elevated blood pressure, but not MetS per se, were independent predictors of cost in the Medicare population [4]. While an impaired level of fasting glucose was not significantly and positively associated with high annual costs in a study of Kaiser Permanente Northwest (KPNW) members, high triglyceride levels were associated with high annual costs [24]. However, in our study, MetS and its five components were important predictors of medical costs, but low HDL-C level was not associated with high costs after a full adjustment (Table 2). In our opinion, it is because no specific medication is prescribed for low HDL-C level. Furthermore, the diagnosis of low HDL-C level can push patients towards a healthier life style, and that offsets the additional medical expenses. In fact, subjects in the MetS group were less likely to smoke or drink alcohol than those in the non-MetS group (Table 1). Even female subjects with low HDL-C levels paid lesser for medical expenses than females with normal HDL-C levels; however, this difference was too small to be economically meaningful (Supplementary Table 3). This is not relevant to the investigation of KPNW members because it excluded subjects with prior evidence of diabetes mellitus or any of the MetS components during the 2 years before the index year [24]. In the CHS, the researchers reported that unmeasured factors that are important to define “metabolically healthy” status in the elderly population, such as presence of sarcopenia, would have affected their results.
This study has several limitations. First, direct medical costs unsubsidized by the KNHIS and indirect costs such as transportation fees were excluded because the KNHIS only collected the data about the costs that were claimed. According to the Healthcare Bigdata Hub, 97.6% of the direct medical costs, as judged by the Health Insurance Review and Assessment Service of Korea, were claimed from the KNHIS, and the rest were claimed from private care insurance companies during 2014. The medical costs not examined by the Health Insurance Review and Assessment Service accounted for 44.7% of the total medical costs [26]. Therefore, we assumed that subjects with MetS spent approximately 15,235 USD more than those without MetS, including for items unsubsidized by the KNHIS, for 5 years. Second, because we only included subjects who had participated in a national health checkup in 2009, the number of young individuals was high in this study; this is because retired individuals are not forced to participate in regular health checkups as they are typically not employed. However, no other datasets have included a wider range of population than the National Sample Cohort database in South Korea. Third, a follow-up period of 5 years is relatively short to observe a trend in MetS-related costs. Because the national health checkup did not collect data on waist circumference, and triglyceride and HDL-C levels until late 2008, we necessarily discarded the medical cost data collected from 2002 to 2008. Fourth, we did not use the whole health checkup data from 2009 to 2013 because not all subjects had the health checkup regularly. Of the subjects, 32.89% underwent health checkups less than three times during the 5 years.
Our study had multiple strengths. The availability of data for all five components of MetS enabled us to accurately evaluate the economic impact of each MetS component. Nichols and Moler [24] substituted waist circumference with body mass index in their study because waist circumference was rarely measured or recorded in their medical records. Furthermore, we used data of prescription drugs with all disease codes for supplementing the health checkup data. Many studies in South Korea have only used the first two disease codes for convenience and also, did not use the data of prescription drugs [27,28]. Thus, we believe that our methods to identify subjects with MetS were sufficiently accurate. Other strengths of our study include the largest sample size studied in South Korea so far and the use of a longitudinal study design.
In conclusion, we found that the presence of MetS and each of its components was associated with high medical costs, even after adjustment with several variables. Future research should include direct health care expenses that are not subsidized by the KNHIS and all indirect medical costs, so that the financial impact of programs that prevent or treat MetS can be calculated correctly.
KEY MESSAGE
1. Metabolic syndrome, by itself, and each of its components were associated with high medical costs.
2. Healthcare professionals working in public health should try to reduce the medical costs on metabolic syndrome.
3. The national health system to prevent the metabolic syndrome should be established and provided.
 PDF Links
 PubReader
 ePub Link
 Full text via DOI
 Download Citation
 Supplement 1
 Print
Print


