


INTRODUCTION
The pulmonary function test (PFT) is an important tool used to identify and monitor patients with respiratory disease. This test reveals the statuses of the small and large airways and the integrity of the pulmonary parenchyma [1]. Although the PFT itself is not diagnostic, an abnormal result can help establish confirmative diagnoses of many respiratory diseases when combined with the patientŌĆÖs history. The PFT also helps to predict the risk and prognosis associated with lung resection [2]. Chronic obstructive pulmonary disease can be diagnosed using the ratio of forced expiratory volume in 1 second (FEV1) and the forced vital capacity (FVC) [3]. Furthermore, improvement of FEV1 is an important target of asthma treatments [4]. The PFT results therefore provide important information about these major chronic respiratory diseases.
Abnormal spirometry is usually defined as an FEV1, FVC, or FEV1/FVC value below the normal range. Although unusually high values may also be encountered during PFT, the clinical meaning of this type of abnormality has not been evaluated and is not usually mentioned in the guidelines. Only one guideline briefly comments on the unusual nature of a percent predicted value > 140% and instructs clinicians to ensure that the employeeŌĆÖs age or height has been measured and entered correctly in such cases. If the unusually high percent predicted value cannot be explained by an error, the guideline recommends recalibration of the spirometer [5].
One might assume that such unusually high spirometry values merely represent a few exceptional cases, mistakes in the input of demographic data, or calibration errors. The reference equations were developed using data collected from representative healthy populations. In other words, the references for minority populations, such as people with unusual heights and weights or ages > 80 years, are based on small numbers of subjects or extrapolations [6,7]. We therefore hypothesized that the reference equations might not be sufficiently accurate, and this limitation could lead to the underestimation of predicted values in some minority populations. Therefore, an unusually high predictive value may be possible in specific groups and should not be considered merely an error of demographics or calibration. This study aimed to characterize the demographic features of subjects with a high percent predicted pulmonary function value.
METHODS
Study design and participants
Adults aged Ōēź 18 years who underwent PFT at the Asan Medical Center between January and December 2011 were considered eligible. The subjects' demographic and PFT data were collected by a review of the medical records. The Institutional Review Board of Asan Medical Center approved this study (study number: 2013-0221) and waived the need for informed consent. This study had no impact on patient management.
Pulmonary function test
Spirometry was conducted by specially trained pulmonary technicians who used a digital computed spirometer (Sensomedic, Anaheim, CA, USA) according to the recommendations of the American Thoracic Society [8]. At least three spirometry maneuvers were performed, and the best measures were recorded. The predicted FEV1 and FVC were derived from the survey data of a population of lifetime non-smoking participants with normal chest radiographs and no history of respiratory diseases or symptoms [7]. The high pulmonary function group comprised subjects with a predicted FEV1 or FVC of Ōēź 140%.
Statistical analysis
Continuous variables are reported as medians (25% to 75% interquartile ranges [IQRs]) or means ┬▒ standard deviations, and categorical variables are reported as numbers (percentages). SPSS version 18.0 (SPSS Inc., Chicago, IL, USA) was used for the statistical analysis. Student's t test and Fisher's exact test were used to compare continuous and categorical variables, respectively. For each variable, a univariate analysis was performed using a binary logistic regression; the statistically significant variables were then included in a multivariate analysis. For two-tailed tests, a p value of < 0.05 indicated statistical significance.
RESULTS
Subjects' characteristics
A total of 68,693 eligible subjects were tested during the study period; of them, 29,224 (43%) were female. The median age was 54 years (IQR, 46 to 63). The mean height, body weight and body mass index (BMI) were 164.3 ┬▒ 8.7 cm, 63.9 ┬▒ 11.5 kg, and 23.7 ┬▒ 3.2 kg/m2, respectively. Among male subjects, the mean height, body weight, and BMI were 169.6 ┬▒ 6.3 cm, 70.0 ┬▒ 10.4 kg, and 24.3 ┬▒ 3.0 kg/m2, respectively. Among female subjects, the corresponding values were 157.1 ┬▒ 6.1 cm, 57.0 ┬▒ 8.3 kg, and 23.1 ┬▒ 3.4 kg/m2, respectively. The mean measured FVC and FEV1 were 3.56 ┬▒ 0.90 L and 2.78 ┬▒ 0.77 L, respectively. In male subjects, the mean measured FVC and FEV1 were 4.05 ┬▒ 0.78 L and 3.09 ┬▒ 0.76 L, respectively. In female subjects, the corresponding values were 2.90 ┬▒ 0.58 L and 2.36 ┬▒ 0.55 L, respectively.
Among the 68,693 subjects, 55 (0.08%) were classified as having a high pulmonary function (48 with high FEV1 and normal FVC, two with normal FEV1 and high FVC, and five with both high FEV1 and FVC). Compared with the other subjects, those in the high pulmonary function group were significantly older (72 years [69 to 81] vs. 54 years [46 to 63], p < 0.001) and more frequently female (65.5% vs. 42.5%, p = 0.001). In addition, subjects in the high pulmonary function group had a significantly lower body weight (52.5 ┬▒ 12.2 kg vs. 64.5 ┬▒ 11.5 kg, p < 0.001) and shorter height (148.4 ┬▒ 11.3 cm vs. 164.2 ┬▒ 8.7 cm, p < 0.001) than did the others. Of these 55 subjects, most (n = 53, 96.4%) had neither respiratory symptoms nor disease (PFTs were performed in 50 and three subjects for preoperative risk assessment and health screening, respectively); accordingly, no medical condition associated with a high FEV1 or FVC could be identified. Notably, the high pulmonary function group had a lower measured FVC (3.29 ┬▒ 0.95 L vs. 3.56 ┬▒ 0.90 L, p = 0.025) than did the other subjects (Table 1). Among subjects with a high predicted pulmonary function, those with a normal FEV1 and high FVC were younger, heavier, and taller than those with a high FEV1 and normal FVC or both a high FEV1 and FVC (Supplementary Table 1).
Furthermore, 1,053 subjects (1.5%) met the criteria for a high pulmonary function when defined as a predicted FEV1 or FVC of Ōēź 120%. Subjects in this high pulmonary function group were also older, more likely to be female and had a lower body weight and height when compared with the other subjects (Supplementary Table 2).
Cumulative incidence of a percent predicted value of Ōēź 140%
Among the 55 subjects with high pulmonary function, most (72.7%) had a percent predicted value between 140% and 149%. This group included 17 of 19 male subjects (89.5%) and 23 of 36 female subjects (63.9%). No subject had a value > 180% (Table 2).
Predictors of subjects with a high percent predicted value
To identify the predictors of a high percent predicted value, univariate logistic analysis was performed. Older age (odds ratio [OR], 1.15; 95% confidence interval [CI], 1.12 to 1.18; p < 0.001), female sex (OR, 2.56; 95% CI, 1.47 to 4.47; p = 0.001), lower body weight (OR of weight, 0.89; 95% CI, 0.86 to 0.91; p < 0.001), and shorter height (OR of height, 0.80; 95% CI, 0.78 to 0.83; p < 0.001) were found to be statistically significant predictors (Table 3). In a multivariate analysis, an older age (OR, 1.08; 95% CI, 1.05 to 1.11; p < 0.001) and shorter height (OR of height, 0.80; 95% CI, 0.76 to 0.84; p < 0.001) remained significant predictors of a high pulmonary function. However, multivariate analysis identified male sex, rather than female sex, as a significant predictor but failed to determine weight as a significant predictor. When men and women were analyzed separately, older age, lower body weight, and shorter height, remained significant predictors of a high pulmonary function (Table 4).
Incidence of a percent predicted value of Ōēź 140% according to the predictors
Each incidence of a percent predicted value of Ōēź 140% was analyzed according to sex and the identified predictors (Table 5). Regarding age, the highest incidence of high pulmonary function was observed among subjects aged Ōēź 80 years (0.78% of male and 2.36% of female subjects). Regarding weight, a lower body weight (< 50 kg for men and < 40 kg for women) was also associated with the highest incidence of a high pulmonary function (0.26% of men and 3.13% of women). Regarding height, a shorter height (< 150 cm for men and 140 cm for women) yielded the same result (6.00% of women and 9.57% of women). Among subjects who met all predictors (age > 80 years, weight < 50 kg [men]/40 kg [women] and height < 150 cm [men]/140 cm women]), 3.0% of male subjects and 6.1% of female subjects met the criteria for the high pulmonary function group (Fig. 1).
DISCUSSION
Our study found that 0.08% of the total subjects had an unusually high pulmonary function, defined as a FEV1 or FVC Ōēź 140% of the predicted value. This pulmonary function pattern was more common in older (> 80 years) female participants with a lower body weight (< 50 kg) and shorter height (< 140 cm). An unusually high pulmonary function was not rare in this specific population (6.1%). Furthermore, an older age and shorter height remained significant predictors of a high pulmonary function in multivariate analysis.
The PFT plays an important role in the diagnosis and management of respiratory diseases [9,10]. Because the PFT results depend on height, age, sex, and ethnicity, standardization and development of correct reference equations using ŌĆ£local healthy controlsŌĆØ are critical issues [8,11]. As noted above, the reference equations were derived using cross-sectional data from representative populations [12-16], indicating a requirement for sufficient numbers of participants in each age, sex, height, and weight category. However, it is not possible to collect sufficient data from all populations, particularly individuals with unusual heights or body weights. Therefore, the values generated using prediction equations may differ from the observed values in some minority populations [8], and this limitation should be considered when interpreting such data. The Korean reference equation was developed using data from 1,212 nonsmokers to provide a better local standard [7]. However, although data from more than 1,000 people were used to derive the reference equation, the subject group included only nine subjects older than 70 years [7]. This situation is consistent with that associated with the development of other reference equations; in a British study, only 6% of male and 9% of female subjects were older than 75 years [13], whereas several other previous studies included no subjects older than 65 years [14,17,18]. Our data suggest that reference values for elderly populations may be inaccurate and that a wider range of populations is needed to avoid under- or over-estimation of spirometry results.
Only a few previous studies have analyzed high PFT results. In swimmers, a relatively higher pulmonary function was associated with increases in the chest wall width and muscle strength [19,20]. Cochet et al. [21] found that 5.5% of all patients had either a FEV1 or FVC > 110% of the predicted value, whereas 1.5% of the patients had an FEV1 or FVC > 120% of the predicted value; furthermore, the proportion of patients with supranormal lung function did not differ significantly between active duty military personnel and a non-active duty population of the same age range. However, even these studies did not mention patients with unusually high PFT results (Ōēź 140% of the predicted value), and only one suggestion was made to re-check the calibration and demographic data in such cases [5]. This guidance is partly reasonable because the cases with values Ōēź 140% of the predicted value are very rare in the general population. Only one (0.004%) of 20,115 male subjects with a height > 170 cm had a value Ōēź 140% of the predicted value. Similarly, only one (0.01%) of 12,821 male subjects aged younger than 50 years had an abnormally high value (Table 5). However, we note that such values were not rare in some specific demographic groups, such as short elderly women.
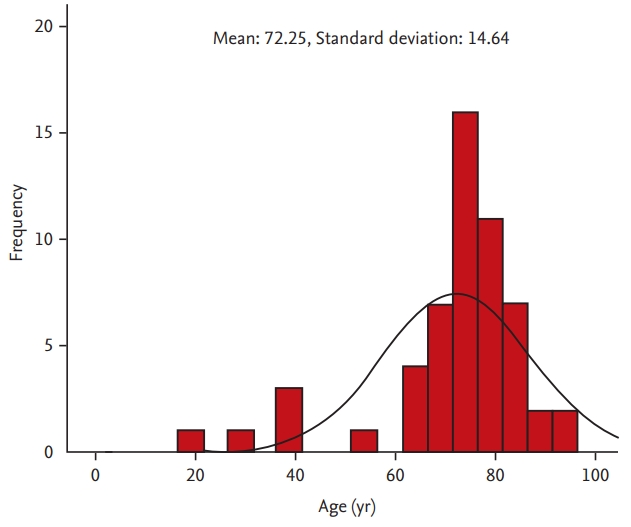
In our study, old age was associated with a high predicted pulmonary function. Increasing age corresponds with decreases in the static elastic recoil of the lung, chest wall compliance and respiratory muscle strength [22]. In humans, the FEV1 and FVC generally increase up to the middle of the third decade of life, then decrease thereafter [23,24]. However, physiologic measurements vary more widely among older populations, compared with younger populations [25]. Indeed, age was not normally distributed (Kolmogorov-Smirnov test, p = 0.032; histogram in Fig. 2) among 55 subjects with high pulmonary function. Although subjects with a high pulmonary function tended to be older, many previous reference equations were based on extrapolations about minority populations, especially those older than 70 years [7,13-15,26]. Given the expected global increase in life expectancy [27], a reference equation that has been validated in a sufficiently large population of older subjects is essential.
Although female sex was a significant predictor of a high pulmonary function in the univariate analysis, male sex was associated with a high pulmonary function after adjusting for age, height, and weight. This conflicting result might be attributable to the small number of subjects with high pulmonary function and an imbalance of anthropometric values between female and male subjects. Indeed, within the high pulmonary function group, female subjects had a lower weight (47.6 kg vs. 61.8 kg, p < 0.001) and shorter height (143.9 cm vs. 157.0 cm, p < 0.001) than did the men, and this imbalance might have affected our results. In addition, although height was a significant predictor of a high pulmonary function in both the univariate and multivariate analyses, body weight was only significant in the former, which suggests that height might be a stronger predictor of pulmonary function. As the body weight correlated positively with height (r = 0.641, p < 0.001), the former parameter might lose significance in a multivariate analysis including the latter.
This study has several limitations of note. First, the design was retrospective in nature. However, we included a large number of patients with little missing data. Furthermore, we included all subjects who underwent PFT during a single calendar year to minimize confounding factors. Second, our analysis included only patients at a single referral center in South Korea. Third, only 55 subjects (0.08% of all included subjects) were found to have high pulmonary function and thus it is difficult to generalize the results of our current study. External validation studies in other populations of subjects may be necessary.
In summary, an unusually high PFT was associated with the female sex, an older age, lower body weight and shorter height, and this outcome was not unusual among subjects who exhibited all of these characteristics. Therefore, we should consider the demographics of the examinees and the limitations of reference equations when interpreting PFT results. The meticulous inclusion of various healthy controls when generating reference equations may reduce this type of overestimation.

 PDF Links
 PubReader
 ePub Link
 Full text via DOI
 Download Citation
 Supplement 1
 Print
Print


