


INTRODUCTION
Immune thrombocytopenia (ITP) is an immune-mediated acquired disease characterized by isolated thrombocytopenia [1]. ITP is usually considered a benign disease with no excess mortality compared to the general population. However, some patients did not respond to numerous treatments and suffered from a fatal hemorrhage or infection related to immunosuppressive therapy [2]. Although the exact mechanism of thrombocytopenia is unclear, it is now known to be associated with increased platelet destruction by a complex immune-mediated process [3]. ITP can be diagnosed based on history, physical examination, laboratory variables, and other causes of thrombocytopenia should be excluded. Patients with ITP show unremarkable peripheral blood smear morphology and physical examination except various bleeding manifestations [4]. Since there are no other definite laboratory or clinical parameters for the diagnosis of ITP [1], even aplastic anemia or hematologic malignancy is sometimes misdiagnosed as ITP and adequate treatment is delayed. Therefore, physicians are forced to consider bone marrow examination in a significant number of patients with severe thrombocytopenia in practice, unlike previous studies which assert that a routine bone marrow examination is not necessary for diagnosis [5,6]. Since both physicians and patients are reluctant to perform an invasive and painful bone marrow examination, other parameters such as immature platelet fraction (IPF) have been proposed to differentiate thrombocytopenia instead of bone marrow examination.
Reticulated platelets have been studied as a parameter in the evaluation of thrombocytopenia for decades. Reticulated platelets are the immature, youngest platelets released into the circulation by regenerated marrow megakaryocytes and reflect the rate of platelet turnover similar to reticulocytes of red blood cells [7-9]. Reticulated platelets contain a greater amount of RNA [10], and can be measured by flow cytometric analysis using the fluorescent dye which binds to their RNA [7]. Several researchers have improved flow cytometric methods; however, flow cytometry still has various limitations such as being time consuming, difficult sample preparation, requiring a skilled operator, high costs, and lack of quality control [11]. Therefore, Watanabe et al. [12] described a fully automated measurement of reticulated platelets, and several studies showed that the automated measurement of immature platelets using the hematology analyzer XE-2100 (Sysmex, Kobe, Japan) is clinically applicable [13-20].
Because a high IPF value is associated with increased platelet production [15], we can presume that ITP can be differentiated from thrombocytopenia due to marrow failure by using IPF. Some studies have shown that IPF could be used to make a differential diagnosis between ITP and other diseases causing thrombocytopenia (non-ITP thrombocytopenia), such as bone marrow diseases, liver diseases and bone marrow suppression after chemotherapy. Briggs et al. [15] confirmed reproducibility and stability of IPF using the Sysmex XE-2100, and suggested IPF as a parameter of bone marrow megakaryocyte activity. Abe et al. [13] and Pons et al. [20] also concluded IPF could be a useful marker to discriminate causes of thrombocytopenia. However, there have been only a few small-scale studies, and exact cut-off value, sensitivity and specificity of IPF have not yet been determined. In addition, since there are other causes of thrombocytopenia with increased platelet turnover, it is impossible to distinguish ITP patients exactly with IPF alone. Therefore, other parameters to complement IPF should be evaluated.
In this study, we compared IPF in patients with ITP and patients with thrombocytopenia of other causes to assess its usefulness as a differentiating parameter in thrombocytopenia. We also estimated other laboratory variables which can be combined with IPF to improve the diagnostic accuracy of ITP and developed a diagnostic predictive scoring model for ITP.
METHODS
Patients
We retrospectively studied 568 patients with thrombocytopenia (platelet count < 100 × 109/L) of various causes who presented to Korea University Guro Hospital from April 2013 to December 2017. We classified the patients into two groups: those diagnosed with ITP (ITP group) and those diagnosed with other causes of thrombocytopenia apart from ITP (non-ITP group). ITP was diagnosed on the basis of clinical manifestations and laboratory results, according to the International Working Group diagnostic criteria [1], but some patients underwent bone marrow examination for differential diagnosis. Causes of thrombocytopenia other than ITP included the following: primary bone marrow diseases like aplastic anemia, acute leukemia, multiple myeloma, and myelodysplastic syndrome, infection, drugs, disseminated intravascular coagulation, and liver diseases, etc. The Korea University Hospital Institutional Review Board approved the protocol of this study (2019GR0072). Informed consent was waived by the board.
Measurement of IPF and other variables
We collected 3 mL of peripheral blood from each patient in K2-EDTA anticoagulant bottles (Becton Dickinson, Franklin Lakes, NJ, USA) on the day of thrombocytopenia confirmation. Samples were analyzed using the Sysmex XE-2100 to quantify IPF and routine complete blood count within 8 hours after collection. The Sysmex XE-2100 is a fully-automated hematology analyzer using fluorescent dye and a semiconductor diode laser beam system. Two fluorescent dyes (polymethine and ozazine) penetrate into the cells, staining the RNA in the platelets. The stained cells are passed through a semiconductor diode laser beam and resulting forward scatter light (cell volume) and fluorescence intensity (RNA content) measured. The immature platelet fractions are distinguished by the intensity of their fluorescence because the youngest platelets contain a greater amount of RNA [15]. The IPF is expressed as a proportional value of the total optical platelet count. Several studies have demonstrated the stability and reproducibility of the IPF.
We also estimated other variables that could affect thrombocytopenia by logistic regression analysis, including hemoglobin, platelet count, white blood cell counts, reticulocyte count, protein, albumin, bilirubin, prothrombin, activated partial thromboplastin time, ferritin, lactate dehydrogenase (LDH), blood urea nitrogen, creatinine, and C-reactive protein.
Statistical analysis
All the data were statistically analyzed using SPSS version 20 (IBM Corp., Armonk, NY, USA). For continuous variables, the Student’s t test and the Mann-Whitney test were applied to compare statistical differences between the two groups. We used a chi-square test or Fisher’s exact test for comparisons of categorical variables. We used receiver operating characteristic (ROC) curves to determine the cut-off value of IPF at the best sensitivity and specificity and the area under the curve was calculated. Logistic regression analysis with the laboratory variables was performed to access their diagnostic contribution. A p values less than 0.05 were considered statistically significant.
RESULTS
Patients’ characteristics
A total of 568 patients with thrombocytopenia (platelet count less than 100 × 109/L) were evaluated in this study. Of these, 206 were diagnosed with ITP according to the definitions proposed by the International Working Group, and 362 were classified as having thrombocytopenia due to causes other than ITP. The most common cause of thrombocytopenia in the non-ITP group was primary bone marrow diseases (n = 132), followed by infection (n = 69), drugs (n = 56), liver disease (n = 40), disseminated intravascular coagulation (n = 30), and others (n = 35) including chronic kidney disease, other autoimmune diseases, megaloblastic anemia, and bone marrow involvement of other cancers (Table 1).
IPF and laboratory results
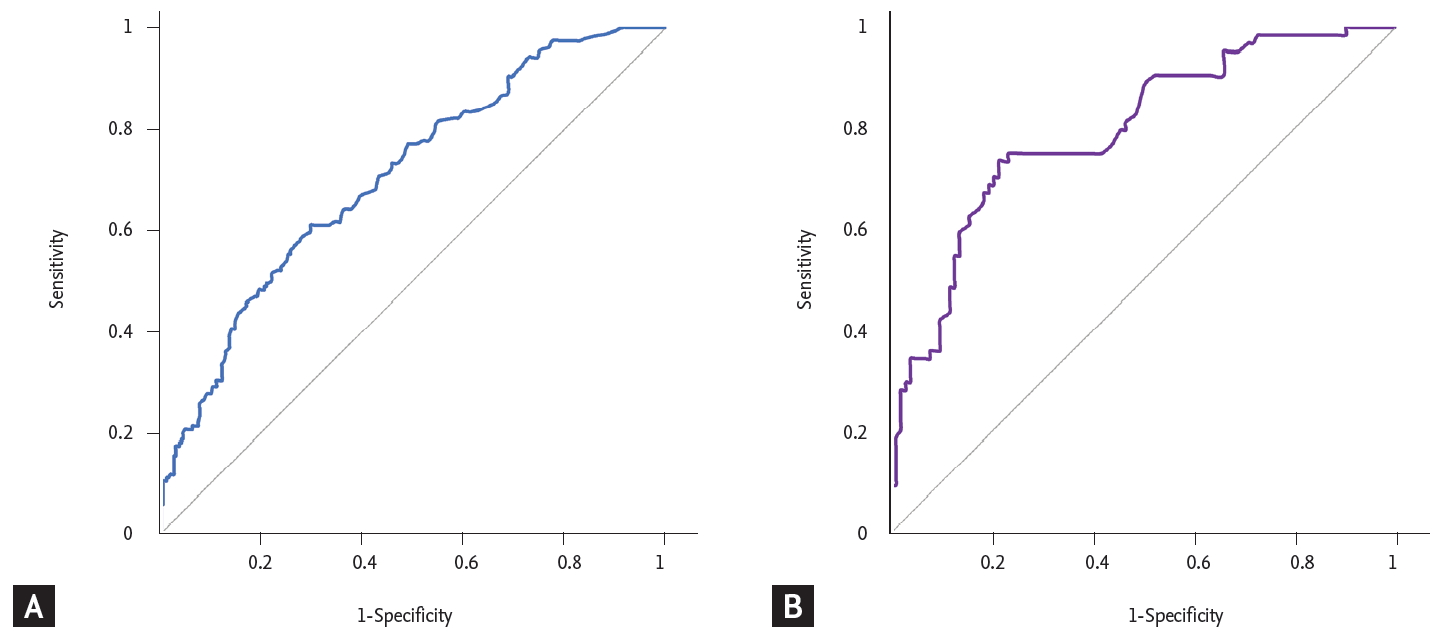
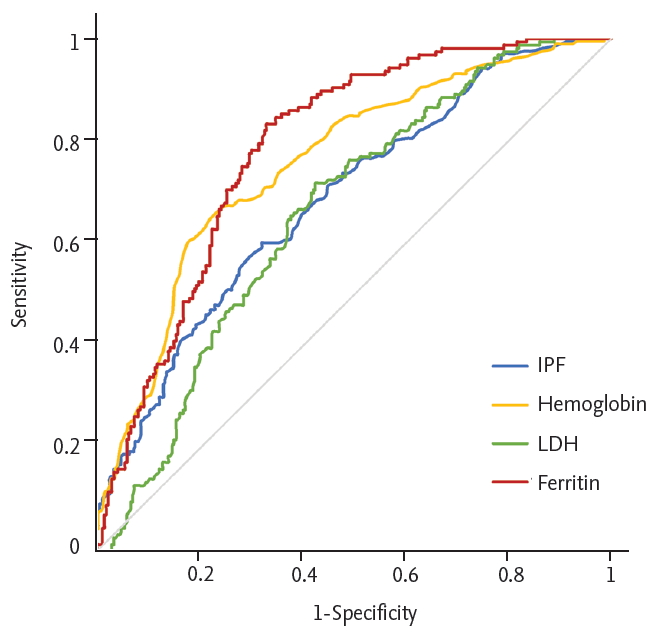
The baseline laboratory data of the ITP group and non-ITP group were compared in Table 2. The ITP group had a significantly higher hemoglobin concentration (p < 0.001), white blood cell count (p < 0.001), and lower LDH (p < 0.001), ferritin level (p < 0.001). The median IPF (%) was significantly higher in the ITP group; the median IPF (%) (range) of the ITP group was 8.7% (1.3% to 47.5%) while that of the non-ITP group was 5.1% (0.7% to 31.5%) (p < 0.001). In order to obtain the optimal cut-off value of IPF (%) for the diagnosis of ITP, ROC curve analysis was carried out. As a result, the optimal cut-off value of IPF (%) for differentiating ITP was 7.0% with a sensitivity of 61% and a specificity of 70% (Fig. 1A). Bone marrow examinations are not mandatory for the diagnosis of ITP, but some patients who have clinically diagnosed ITP without a bone marrow examination may be difficult to differentiate from those with early bone marrow disease. To exclude this possibility of misclassification, we performed subgroup analysis with the patients who had an accurate diagnosis with bone marrow examination. A total of 200 patients underwent bone marrow examination; 77 patients were classified into the ITP group and 123 patients into the non-ITP group. The median IPF (%) was significantly higher in the ITP group. The median IPF (%) (range) was 12.5% (1.9% to 45.7%) for the ITP group and 4.7% (0.7% to 31.5%) for the non-ITP group. The optimal cut-off value was 7.8%, with a sensitivity of 75% and a specificity of 76.7% (Fig. 1B). The median IPF was higher in this subgroup and the sensitivity and specificity of the cut-off value were also higher than the former group. We confirmed that IPF could be a useful parameter for diagnosing ITP, but since IPF alone could not be used to diagnose ITP, we also evaluated other laboratory variables via logistic regression analysis. Hemoglobin, LDH, and ferritin showed statistical significance with p < 0.001, p = 0.011, and p < 0.001, respectively. The optimal cut-off value of hemoglobin for distinguishing between ITP and non-ITP was 12 g/dL with a sensitivity of 60% and specificity of 81.3%. The optimal cut-off value of LDH was 420 IU/L (upper limit of normal [ULN]) with sensitivity 57.9%, specificity 70.5% and the cut-off value of ferritin was 177 mg/mL with sensitivity 67%, specificity 83.3% (Fig. 2).
Derivation of predictive model
These four independent variables which were identified through the logistic regression analysis comprised a simple diagnostic predictive scoring model (Table 3). To adequately reflect sensitivity and specificity, we divided patients into three groups according to IPF; IPF < 7, ≥ 7 and < 10, ≥ 10. Our model gave point to each of variables; 1 to high hemoglobin level (> 12 g/dL), low ferritin level (≤ 177 ng/mL), normal LDH level (≤ ULN) and IPF ≥ 7 and < 10; and 2 to IPF ≥ 10. The final score was obtained by summing the points (Table 4). The scoring model underwent validation. In the internal validation cohort consisting of patients who underwent bone marrow examination, a total of 166 patients had all variables of the scoring system. Sixty-four patients were diagnosed with ITP and 102 patients were diagnosed with non-ITP diseases. In this cohort, none of the 64 patients with ITP were assigned a score of 0; 55 patients (85.9%) were assigned a score of 3–5. We defined that ITP could be highly predicted in patients with more than 3 points. Accuracy, precision and recall were 87%, 82%, and 86%, respectively. We also applied this scoring model to the external validation cohort. The external validation cohort included patients with thrombocytopenia (platelet count < 100 × 109/L) of various causes who presented to Korea University Guro Hospital from January 2018 to December 2018 or Korea University Anam Hospital from January 2017 to December 2018. A total of 171 patients who underwent bone marrow examination had all variables and could be scored. Twenty-nine patients were diagnosed with ITP and 142 patients were diagnosed as non-ITP. None of 29 patients with ITP were assigned a score of 0 to 1; 26 patients (89.7%) were assigned a score of 3 to 5. We also found that ITP could be highly predicted in patients with more than 3 points. Accuracy, precision and recall were 91%, 67%, and 90%, respectively.
DISCUSSION
The purpose of this study is to find novel markers to diagnose ITP more easily and accurately, because there is no gold standard method for diagnosis of ITP so far. In this study, we investigated the usefulness of IPF (%) for the differential diagnosis of ITP and found that IPF (%) is significantly higher in ITP patients than in the non-ITP group. The role of IPF has been reported in several studies. Briggs et al. [15] showed that IPF is higher in ITP and thrombotic thrombocytopenic purpura, which are associated with excessive peripheral consumption of platelets than in the group undergoing cytotoxic chemotherapy. Jung et al. [17] confirmed that the median IPF (%) of ITP patients is 7.7%, that of AA patients is 3.5% and the cut-off value of IPF differentiating ITP from AA was 7.3%. Naz et al. [21] compared the IPF (%) of ITP patients with other thrombocytopenic patients and normal healthy adults and observed that IPF (%) was higher in the ITP group than in the non-ITP group. These studies presented a similar conclusion that IPF (%) might be a diagnostic parameter of patients with ITP; however, these have several limitations as follows. (1) They mainly compared the IPF (%) of patients with ITP and that of normal control groups without thrombocytopenia, and the size of the control groups with thrombocytopenia were too small. (2) There were no studies comparing the IPF (%) in patients with and without bone marrow examination. Since most studies did not use bone marrow examination for the diagnosis of ITP, some patients might have been misdiagnosed as ITP. (3) The criterion for thrombocytopenia was platelet count less than 150 × 109/L, which was inconsistent with the criteria from the International Working Group.
In this study, we included 568 patients with platelet count less than 10 × 109/L for both the ITP and non-ITP groups. Even though only patients with less than 100,000 platelets were included in the study, the study was conducted on a relatively large number of patients compared to previous studies. Bone marrow examinations were not performed in all patients, but we performed bone marrow examination in almost half of patients for diagnosis and clearly excluded the possibility of other diseases. In this way, since other cause of thrombocytopenia was excluded in a large number of patients with bone marrow examination, our study diagnosed ITP more accurately compared to previous studies. IPF could be expressed as an absolute count or a percentage. We used the IPF (%) because the absolute value of immature platelets may also be low if the platelet count is low. The median IPF (%) for patients with ITP was significantly higher compared to that of the non-ITP group. Therefore, our result indicated that IPF (%) could be applied as a useful parameter to distinguish the cause of thrombocytopenia, especially in the diagnosis of ITP. The optimal cut-off value to differentiate ITP from other causes of thrombocytopenia was 7.0%, with a sensitivity of 61% and a specificity of 70%. These are similar results to those of previous studies. Since ITP is diagnosed through the exclusion of other diseases, the initial diagnosis may not be accurate, especially, in patients with several underlying diseases or with a short follow-up period. Therefore, some patients who did not undergo bone marrow examination could be misdiagnosed with ITP and consequently misclassified into the ITP group in our study. To exclude the possibility of misclassification, only patients who underwent bone marrow examination were selected and included in the subgroup analysis. In this subgroup, the median IPF (%) for patients with ITP was also higher than that of the non-ITP group and the difference was even more pronounced. The optimal cut-off value for differentiating ITP from other causes of thrombocytopenia was 7.9%, with a sensitivity of 75% and specificity of 76.7%.
However, diagnosing ITP with IPF alone has some limitations. Although ITP is mainly attributed to immune-mediated platelet destruction, recently, inadequate platelet production has also been suggested as a factor in the pathogenesis of ITP [3,22]. Also, ITP is considered a heterogeneous disease, as the etiology of thrombocytopenia differs among patients. IPF reflects only young platelet production, and cannot fully reflect the complicated pathogenesis of ITP. In addition, IPF may be similar in other diseases like liver disease with splenomegaly, according to the mechanism of thrombocytopenia. Furthermore, as platelets have a shorter lifespan relative to red blood cells, fluctuations and variations of IPF (%) might be larger, depending on the time of the test. Therefore, we also measured other laboratory variables to overcome the limitation of IPF and improve the diagnostic accuracy of ITP. Hemoglobin, LDH, and ferritin showed statistical significance in the logistic regression analysis. Low hemoglobin, high LDH, and high ferritin level were found to be associated with the non-ITP group. These may be attributable to the fact that the non-ITP group included patients with various bone marrow diseases. LDH and ferritin are also known as acute phase reactants, the levels of which can be increased by inflammation and tissue damage. Moreover, ferritin can be released from damaged hepatocytes and indirectly reflects liver damage. We developed a simple scoring model for the differential diagnosis of ITP based on these results and found it to assess the probability of ITP reliably. Because our predictive model consists of common laboratory variables that are frequently used in general clinical practice, we expect that it could be easily applied to patients in clinical practice instead of bone marrow examination.
In conclusion, IPF (%) could be a useful parameter to distinguish ITP from thrombocytopenia of other causes. Though IPF (%) alone is hardly a gold standard for the diagnosis of ITP, it could be more useful in combination with other laboratory variables. We developed a predictive scoring model for the differential diagnosis of ITP using IPF (%), hemoglobin, LDH, and ferritin. External validation with a large cohort of patients is needed to determine the efficacy of this model.
KEY MESSAGE
1. Immature platelet fraction (IPF) could be a useful
parameter to distinguish immune thrombocytopenic purpura (ITP) from other causes of thrombocytopenia.
2. We developed the predictive scoring model using IPF, hemoglobin, lactate dehydrogenase, and ferritin. This model could predict ITP with high probability in patients with more than 3 points.
 PDF Links
 PubReader
 ePub Link
 Full text via DOI
 Download Citation
 Print
Print


