


INTRODUCTION
The world is currently experiencing a novel coronavirus disease 2019 (COVID-19) pandemic [1]. In South Korea, there have been multiple confirmed cases related to local outbreak clusters, but there are no rapid, sensitive, affordable screening tools available to assess the presence of pneumonia, disease severity, or risk of respiratory failure. Chest computed tomography (CT) is a useful method for diagnosing COVID-19 [2]. However, the highly transmittable nature of COVID-19 through droplets or fomites, and the risk associated with radiation exposure, has hindered routine use of traditional diagnostic modalities such as computed tomography (CT) [3-5].
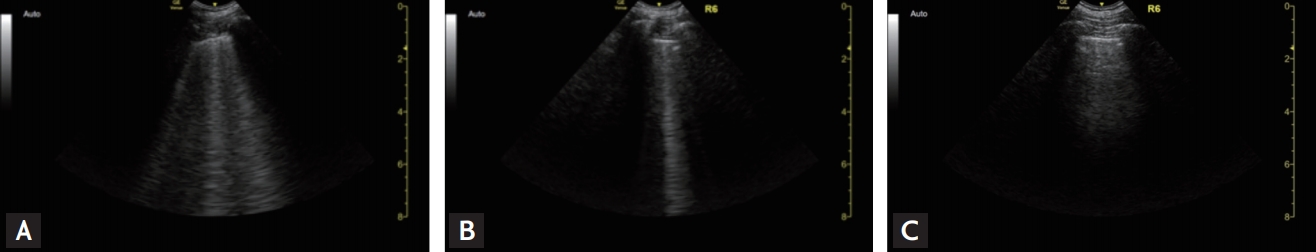
Lung ultrasound (LUS) is increasingly performed at the bedside for clinical assessment of the patients with acute respiratory failure [6]. The normal lung surface associate lung sliding with horizontal repetitions of the pleural line, called A-lines. ‘B-lines’ indicate loss of lung aeration. The Bedside Lung Ultrasound in an Emergency (BLUE) protocol is a fast protocol (< 3 minutes), which combines these signs, resulting in several aeration patterns: moderate loss of lung aeration (B1 lines); severe loss of lung aeration (B2 lines); pulmonary consolidation (C).
Herein, we describe some of the key LUS findings in six patients with confirmed COVID-19 infection with normal to minimal radiographic changes; and COVID-19 pneumonia along their clinical course, to demonstrate the feasibility and utility of the LUS in early detection of pneumonia and clinical guidance on the management of the acute respiratory failure.
METHODS
Cases and specimen collection
We retrospectively reviewed the records of six consecutive patients with confirmed COVID-19 who underwent serial LUS. All patients had routine clinical admission evaluation with repeated reverse transcription-polymerase chain reaction (RT-PCR) tests for severe acute respiratory syndrome coronavirus 2 (SARS-CoV-2) in samples obtained from their upper or lower respiratory tract during their hospitalisation. The patients’ treatment differed according to the decision of the primary attending physician, who is an infectious disease specialist. All LUS were conducted by one independent pulmonary and critical care specialist using a point-of-care ultrasound.
Lung ultrasound
For LUS examination (Supplementary Fig. 1), an 8C-RS microconvex probe (8 MHz, Venue, GE Healthcare, Milwaukee, WI, USA), which directly applied to the intercostal space was used. The use of bedside ultrasound by the International Consensus Conference was not considered in the report [7]. Patients were examined in sitting or semi-recumbent position, with the probe applied perpendicularly to the chest surface, as the patient’s clinical condition allowed [8].
Six areas per each hemithorax were examined, as recommended [6,9]. At least two central intercostal spaces per area were investigated with longitudinal or transversal scans. First, the scan was done to correctly identify the pleura; a video clip at least one respiratory cycle length was stored for offline analysis. Then, the following data were recorded for each scan: the length of pleural line, presence of A-lines, number and coalescence of B-lines, subpleural echo-poor regions (subpleural consolidations), and tissue-like patterns (consolidations). To quantify B-lines, we employed a machine learning system embedded in the Venue device, which included “auto-gain” and “auto B-lines” functions [10]. The “auto B-lines” function automatically distinguishes between real B-lines and all other artefacts [11].
The Lung Review screen provided the overall LUS score, by adding the scores from 12 segments. Each B-line was counted and the count per zone was given as one of the following numbers: 0, 1, 2, 3, 4, or ≥ 5. The score for each segment was defined as follows: counts ≤ 2 were given a score of 0; counts of 3 or 4 were given a score of 1 (B1- lines); counts ≥ 5 were given a score of 2 (B2-lines); and if consolidation was present a score of 3 (C) was given (The finding of consolidation was not automatically recorded and had to be entered manually). The “Auto B-lines” tool highlighted B-lines while scanning, and at the end of the sweep the line tool jumped image to the frame with the most B-lines. Some of these key features included the brightness of the B-lines relative to its surroundings, the depth of B-lines (whether the B-lines extended to the bottom of the image), and the deletion of A-lines.
RESULTS
The records of six patients (four adults and two children) were analysed retrospectively. Five patients showed positive RT-PCR for SARS-CoV-2 in upper and lower respiratory tract specimens, and one 15-month-old girl was only positive in the upper respiratory tract as a lower respiratory tract specimen was not able to be obtained. The clinical characteristics of the enrolled patients are shown in Table 1. Of the four adults, the first was a 40-year-old woman who had a sore throat and a fever which had started 5 days previously, and the second was a 60-year-old man with a cough. The two critically ill patients were a 62-year-old woman and an 85-year-old man, both with dyspnoea, and transferred from other hospital for critical care. Of the two children, the first was a 10-year-old girl who had a small amount of sputum for 3 days. The second was a 15-month-old girl who had tested positive for SARS-CoV-2 but had no respiratory symptoms. Of the four adults, LUS use in two cases led to the with early detection of pneumonia, and two cases with severity assessment for acute respiratory failure. LUS was followed by the results of chest X-ray (CXR) and chest CT results focusing on abnormal findings in the index cases, and then followed by LUS prospectively.
Use of lung ultrasound for early detection of pneumonia
Case 1
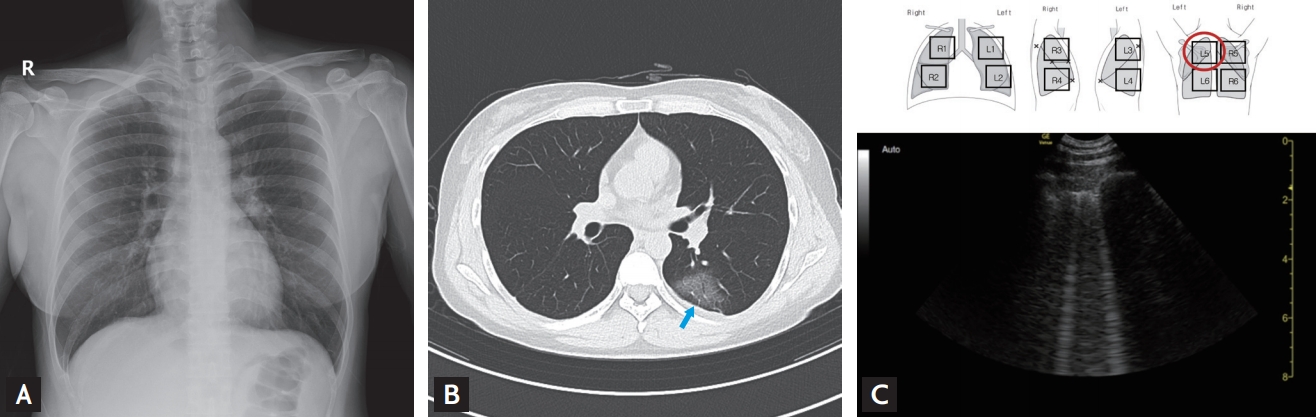
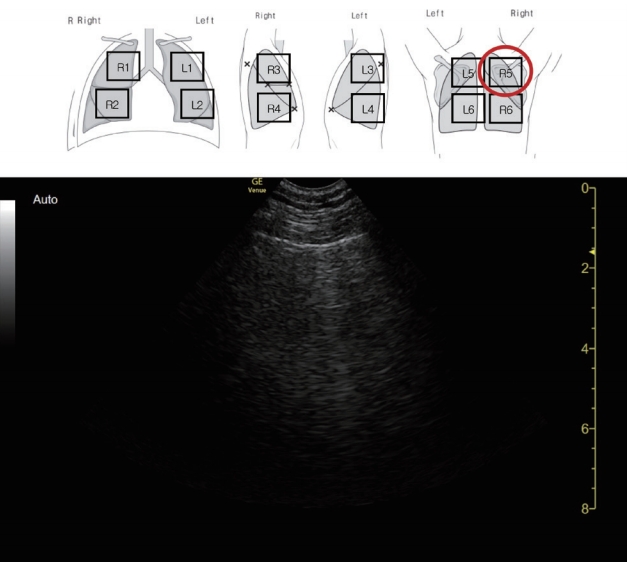
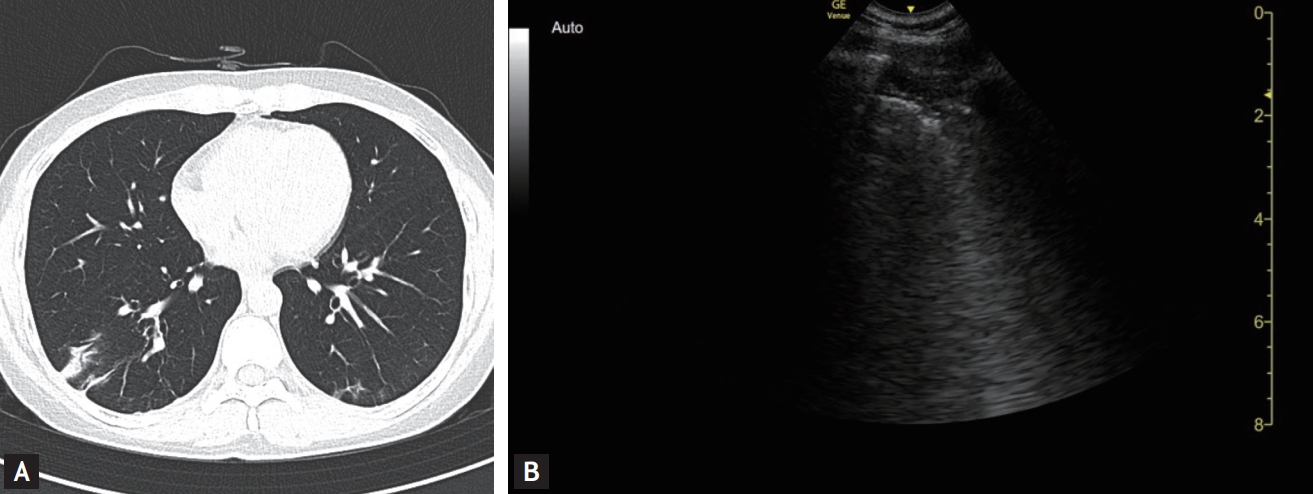
A 40-year-old woman was referred and admitted following a positive SARS-CoV-2 test at a community health screening, which she attended 5 days after the onset of a sore throat and fever. She had had contact with a family member with a confirmed COVID-19. She did not have symptoms of a lower respiratory tract infection. The CXR performed on the day of visit was normal (Fig. 1A), but her chest CT (Fig. 1B) performed on Day 2 showed ground-glass opacities (GGOs) in the left upper lung field. A LUS was performed and showed typical B-lines (Fig. 1C, Video 1; https://www.kjim.org), which findings were consistent with the CT abnormalities. Also, typical A-lines (normal aeration) (Fig. 2, Video 2; https://www.kjim.org) were observed on the opposite side in the right upper lung field, which corresponded with normal CT findings on the right. She developed dry cough and fever on Day 5 and began treatment with lopinavir/ritonavir. Contrary to near minimal changes of serial CXR (Supplementary Fig. 2A), second chest CT performed on the day of starting treatment (Day 6) also showed more pronounced GGOs (Supplementary Fig. 2B), where the B-lines were already increased in the same area as the LUS performed on Day 4, 1 day before worsening symptoms (Supplementary Fig. 2C, Supplementary video 1.; https://www.kjim.org). Her symptoms improved, and the B-lines gradually decreased in the LUSs performed on Day 9 and Day 16 after admission. Finally, the B-lines disappeared and were replaced by A-lines. The GGOs became less marked in the chest CT conducted on Day 14. Beside left upper lung field, additional consolidation was seen at the right lower lung field in the CT performed on Day 14 (Fig. 3A), and the LUS revealed subpleural consolidation accompanied by B-lines on Day 16 (Fig. 3B, Video 3; https://www.kjim.org).
Case 2
A 60-year-old man was admitted to the hospital following a positive SARS-CoV-2 test, with a 1-day history of cough, chills, and myalgia. He had been exposed to a colleague with SARS-CoV-2 infection, who had experienced similar symptoms 5 days before the onset of his symptoms. At the time of hospitalisation, he did not complain of any symptoms except for feeling feverish, and findings from the CXR and CT performed on the day of admission were normal. While he became febrile, a combination of lopinavir/ritonavir was started on Day 5. On Day 8, a repeat chest CT (Supplementary Fig. 3A) and CXR (Supplementary Fig. 3B) showed relatively dense GGOs in the right upper lung field.
A LUS performed on Day 9 showed B-lines (Supplementary Fig. 3C, Supplementary Video 2; https://www.kjim.org) in the area where the GGOs had been seen on the CT performed on the previous day. The opposite left side lung field showed GGOs in CXR on Day 13 (Supplementary Fig. 4A) and chest CT on Day 15 (Supplementary Fig. 4B); however, the LUS already showed B-lines (Supplementary Fig. 4C, Supplementary Video 3; https://www.kjim.org) at same field on Day 9. The LUS detected subtle abnormalities before the CXR or CT with clinical deterioration.
Use of lung ultrasound for severity assessment for acute respiratory failure
Case 3
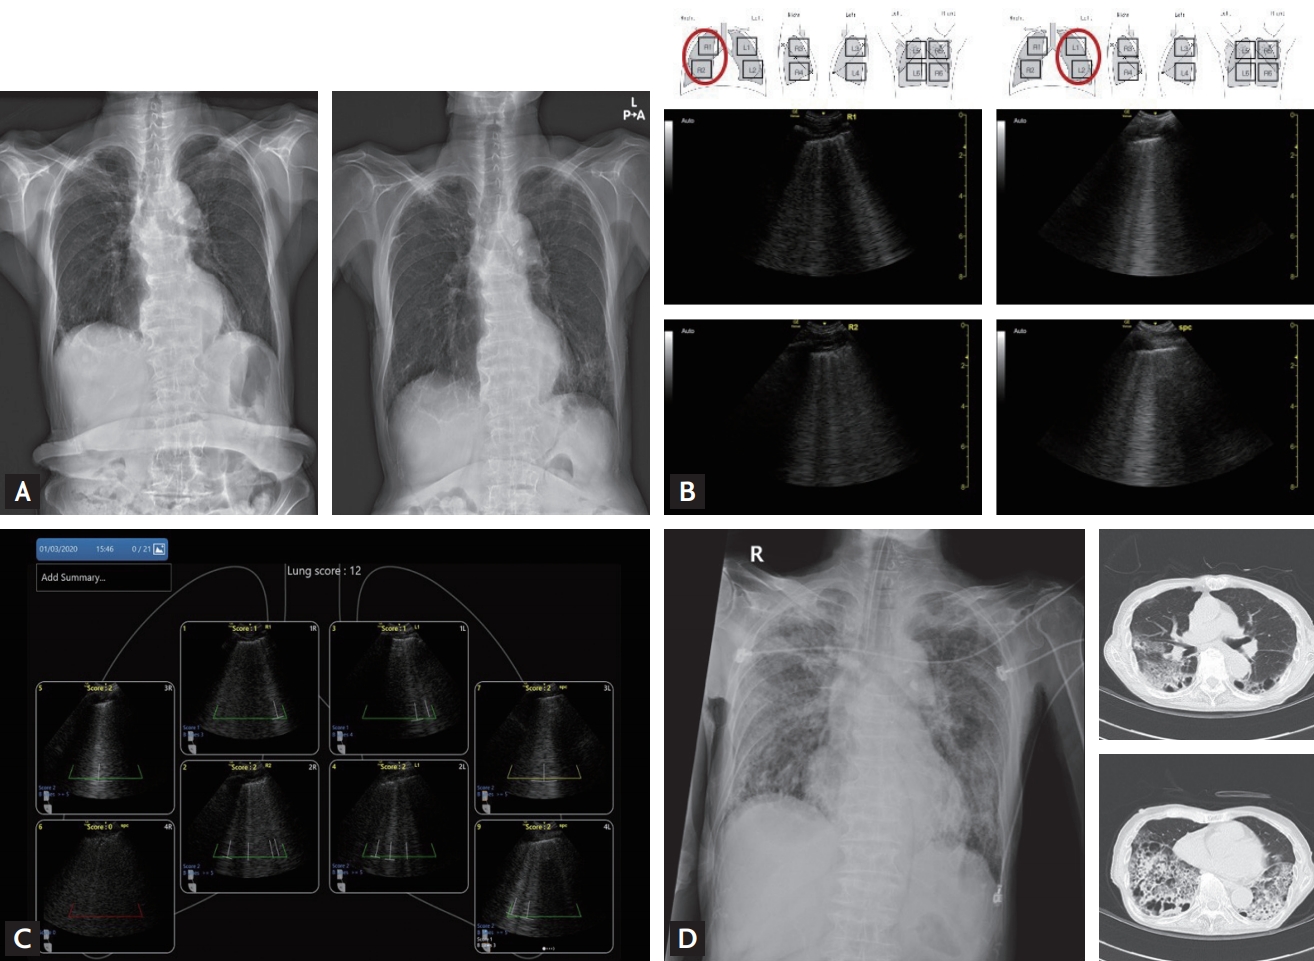
An 85-year-old man was transferred from another hospital with ongoing respiratory problems. He had been diagnosed with confirmed COVID-19 at the other hospital, 6 days before being transferred to our hospital. Immediately before transfer, the patient had rapid, shallowing breathing despite oxygen supplementation. Copies of CXRs taken 5 days, and 1 day before being transferred to our hospital are shown in Fig. 4A. LUS was immediately performed to assess the extent of lung infiltration. The LUS showed multiple B-lines in the entire anterior bilateral upper and lower lung fields (Fig. 4B), and the lung aeration score according to the automated protocol was 12 (Fig. 4C). Based on these findings, we immediately decided to initiate mechanical ventilation with rapid sequence intubation. A post-intubation CXR and chest CT showed typical findings of adult respiratory distress syndrome (ARDS) (Fig. 4D).
Case 4
A 62-year-old woman was transferred from another hospital after being diagnosed with COVID-19. She had been admitted to the other hospital after 8 days of fever, when she developed respiratory distress occurred during isolation. At the time of her transfer to our hospital she was being treated with empirical antibiotics and oseltamivir and was receiving 4 L/min of supplemental oxygen via nasal prongs. Her CXR and CT findings at the previous hospital are shown in Supplementary Fig. 5A. The LUS was performed with the patient in the supine position. Multiple B-lines were observed in the anterior right upper lung field, and both anterior lower lung fields, but not the anterior left upper lung field. Her lung aeration score was 3 points (Supplementary Fig. 5B), based on the LUS findings in both anterior areas. Although lopinavir/ritonavir was started immediately after transfer to our hospital, she was intubated on Day 3 after her respiratory symptoms became more severe. LUS performed on Day 4 showed a worsening of her pneumonia, with the lung aeration score of 5 points (Supplementary Fig. 5C). After mechanical ventilation, the patient’s CXR and LUS aeration score improved from 5 to 4, but her hypoxia remained severe (ratio of arterial oxygen partial pressure to fractional inspired oxygen [P/F ratio] 133 on Day 8). As a rescue therapy for ARDS, methylprednisolone (1 mg/kg intravenously) and inhaled nitric oxide were administered.
Despite these interventions, the patient continued to deteriorate, and veno-venous extracorporeal membrane oxygenation (ECMO) support was started on Day 16. Her CXR showed worsening of her pneumonia, and a LUS performed on Day 18 (2 days after ECMO application) showed a lung aeration score of 13 points (Supplementary Fig. 5D), which was worse than it had been on Day 3 (the day of intubation). (Table 2) The patient was subsequently diagnosed with hospital-acquired pneumonia caused by carbapenem-resistant Acinetobacter baumannii cultured from a respiratory sample.
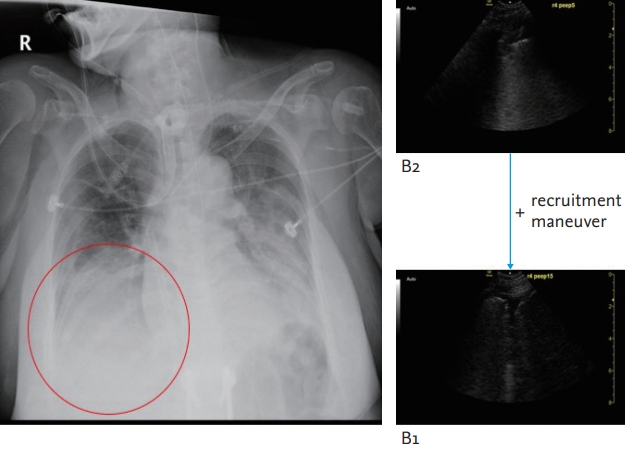
Under the ECMO support, LUS was performed before and after an alveolar recruitment manoeuvre to assess proper positive end-expiratory pressure (PEEP) on the ventilator. The LUS performed after the recruitment maneuver revealed improved aeration of the right lower lung field and lowering of the diaphragm level followed by lung expansion (Fig. 5). Based on that findings on the LUS, we were able to decide on the optimal PEEP settings and performed a follow-up CXR to confirm improved lung recruitment.
Use of lung ultrasound in children
Case 5
A 10-year-old girl had confirmed SARS-CoV-2 infection after being exposed to a family member with COVID-19 and was hospitalised for evaluation and monitoring of her symptoms. The initial CXR after admission was normal. However, her chest CT scan on Day 2 showed focal consolidation with multiple GGOs in the right lower lung field (Supplementary Fig. 6). As in Case 1, the LUS (performed on Day 3), showed typical B-lines (consolidations and GGOs) in the right lung field (Fig. 6A), and contralateral A-lines (normal aeration) in the left lower lung field. She developed a small amount of sputum but was not administered medication for pneumonia because her condition was stable. Follow-up CXRs and LUS were performed 4 and 6 days, respectively, after the first LUS. As her symptoms improved, LUS showed evolution from B2-lines to B1-lines and then A-lines, indicating progressive improvement in her lung aeration (Fig. 6B and 6C, Video 4; https://www.kjim.org). Since there was no evidence of worsening symptoms during the hospitalisation, the patient was transferred to the step-down facility. The final lung aeration score was 0 and her symptoms also disappeared at that time.
Case 6
A 15-month-old girl was hospitalised with SARS-CoV-2 infection after contracting infection from a member of her family. She had no symptoms of COVID-19 and was clinically stable. The initial CXR also showed normal findings (Supplementary Fig. 7A). To further rule out the presence of pneumonia, LUS and CXR was carefully performed on her back area at the bedside with the support of her father on Day 2. The LUS showed A-lines throughout her lungs, and no B-lines (Supplementary Fig. 7B). Chest CT was not performed because of her stable clinical condition and normal CXR and LUS findings. The CXR (Supplementary Fig. 7C) and LUS were repeated on Day 4 and remained normal. The patient was later discharged without requiring treatment.
DISCUSSION
This is the first LUS case series performed for COVID-19 patients in South Korea. In Cases 1 and 2, LUS showed important early findings of pneumonia, which corresponded to the findings on chest CT, while CXR did not reveal abnormalities. LUS is an especially useful tool for COVID-19 patients because performing conventional auscultation can be challenging when wearing personal protection equipment. LUS helped to assess the severity assessment for respiratory failure in Cases 3 and 4 as well as the recovery phase. In addition, LUS was a useful alternative to chest CT in children to whom radiation exposure can cause harm and in those who need sedation to perform chest CT [12,13]. Previous studies have stressed the accuracy and the diagnostic value of chest CT in managing patients with COVID-19 [3,14,15]. This case series illustrates the accuracy and the diagnostic value of LUS in managing patients with COVID or asymptomatic SARS-CoV-2 infection.
The goal of LUS in intensive care medicine and emergency medicine is to detect and manage the pathophysiological changes of cardiopulmonary diseases with an emphasis on point-of-care, rather than simply as a tool to reveal underlying anatomical abnormalities [7,14- 16]. While recent studies have emphasised the accuracy and the diagnostic value of chest CT in patients with COVID-19 [3,17,18], LUS may be a good alternative test for CT scan, and it carries less risk of breaking airborne isolation and transmission of SARS-CoV-2 infection to others. Currently, a CT scan had been difficult because of keeping a COVID-19 patient in the negatively pressured mobile bed from the quarantine area to the examination room. Besides, more health care workers should accompany critically ill COVID-19 patients for their safety, which inevitably increases the risk of exposure to the virus during transportation. Also, in this study LUS was more sensitive than CXR and sometimes detected B-lines, indicative of subpleural lesions despite the absence of obvious changes on CXR. In an attempt to quantify the LUS findings, we adopted the machine’s built-in algorithm of analysing characteristics of lesions, focused on interpreting B-lines and the lung aeration score. The automated quantification process helped to overcome the limitations of LUS, particularly its intra-operative variability and patient-related factors such as obesity and position [19,20].
In the first adult and the first child patients (Cases 1 and 5), the LUS findings of improvement or deterioration during the period in which the patient was under observation agreed with the CT findings and with changes in the SARS-CoV-2 RT-PCR cycle threshold (Ct) values for RNA-dependent RNA polymerase (RdRp) gene (Supplementary Fig. 8A and 8B). This suggests that LUS might be a very useful tool for monitoring disease progression in COVID-19 patients [21].
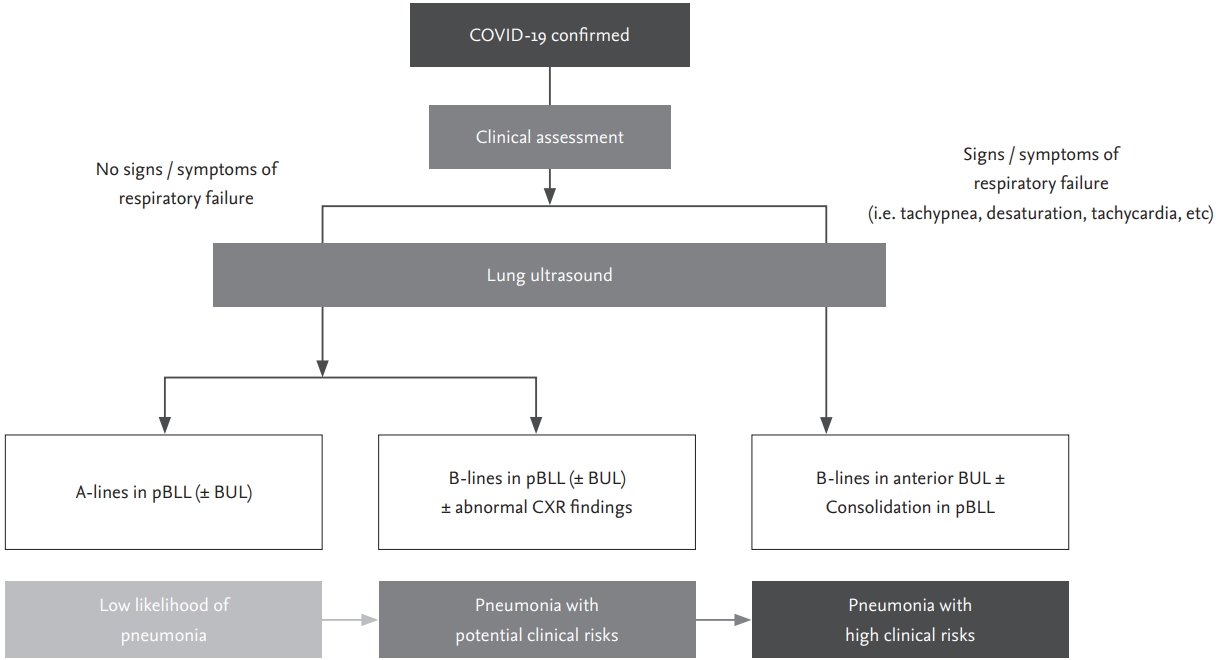
Currently in South Korea, many asymptomatic or mildly symptomatic individuals are confirmed as having SARS-CoV-2 infection due to extensive use of RT-PCR testing and thorough epidemiologic investigation of close contacts of individuals with confirmed infection. Due to outbreaks among members of religious organisations and inmates of psychiatric institutions in certain geographic areas including the city of Daegu and Gyeongbuk Province, the number of individuals with confirmed infection overwhelmed the medical system, which limited the ability of medical staff to assess the severity of the COVID-19 in some patients during the first few weeks of the epidemic. As in other countries, there were many early deaths due to rapidly progressive disease in those regions. In such situations, using LUS for early detection of pulmonary involvement in patients with COVID-19 could be lifesaving, because it is very difficult to recognise patients developing acute respiratory failure with hypoxia in advance, especially within 48 hours after hospitalization. There is an urgent need for a rapid, reliable, and low-risk everyday pointof-care clinical tool that can be used to triage patients with SARS-CoV-2 infection and identify those at risk of respiratory failure [4,22,23]. As ultrasound examinations in the intensive care unit have been covered by national insurance in South Korea, it is also affordable especially for critically ill patients such as severe COVID-19. We propose the use of an LUS screening protocol as shown in Fig. 7.
There are some limitations to this study. First, we performed the chest CT prior to LUS for the index patient, who did not have significant symptoms suggesting lower respiratory tract pathology. Therefore, there is a possibility that lesions cannot be detected if LUS was performed without knowing the CT results, given that the initial findings for COVID-19 are only focal GGO lesions. In other cases of acute respiratory distress syndrome, however, LUS could identify B-lines, ultrasound evidence of peripherally located GGO, or infiltrations on COVID-19 patients that corresponded to initial symptoms, even before the CXR. We believe that that LUS could be performed for confirmed COVID-19 patients without obvious lower respiratory tract symptoms, to guide very early clinical decisions.
Second, the radiographic findings obtained by CT scan and LUS could be at different stage of COVID-19 progress, as there was a time difference between those two measures. There was a time difference between CT scans and LUS from a few hours up to 2 days, depending on the hospital logistics and patients’ condition, as well as the call schedule of the operator. However, with serial CXRs performed during the gap period, obvious changes were able to be recorded, and clinically estimated to some extent.
Third, the study was conducted by one ultrasound examiner and was a case series of six patients. As mentioned, inter-operative or even intra-operative variations can be of concern with LUS, and we were not able to address or calculate inter-operative variations with current study. However, with using built-in machine learning algorism for image standardisation and processing, we were able to quantify and characterise B-lines for all six case patients. Given the pandemic outbreaks occurring around the world, we hope the insufficient number of this research subjects could be overcome by subsequent large-scale studies. Especially, we hope the methodologies of longitudinal follow-up LUS on COVID-19 patients could be adopted by other researchers and clinicians, to reduce the risk of breaking isolations as well as radiation exposures. This could be especially valuable in children, who need mostly sedation, where it is difficult to repeat chest CT.
In conclusion, LUS was feasible and useful for a rapid, sensitive, affordable point-of-care screening tool to detect pneumonia without radiation hazard and suggest the severity of respiratory failure for COVID-19 patients.
 PDF Links
 PubReader
 Full text via DOI
 Download Citation
 Supplement 1
 Print
Print


