INTRODUCTION
Prostaglandin (PG), found in human semen by Goldblatt1) and von Euler2), is a combination of several kinds of unsaturated lipids that have different structures. PG exists in every organism, is synthesized and isolated by many variations, and has diverse effects on different chemical structures and organs. PG is a localized hormone that is created and activated in the same place and does not react throughout the whole body except at delivery time. The functions of PG include contracting and relaxing the smooth muscles, increasing and restraining thrombocyte adhesion, and reacting to inflammation and immune responses. In particular, PG functions as cytoprotection against damaged mucosa of the stomach. It was first asserted by Jacobson et al.3) and Robert4) that PG functions as cytoprotection against damaged mucosa of the stomach caused by ethanol, adrenal steroid, aspirin, indomethacin and bile acid.
The effect of PG on organs, especially the liver, is related to multiplication of liver cells as well as such cytoprotection. Andreis et al5) reported that Deoxyribonucleic acid (DNA) increased by a dosage of PG in the cultivation of young ratŌĆÖs liver cells, and Boynton et al6). reported that DNA increased by a dosage of low concentrations of PG in the cultivation of ratŌĆÖs liver cells. In addition, the PG synthesis rate increased in several kinds of cancer cells. However, it was reported that PG hindered DNA synthesis in the HepG-2 cell, L cell and Hela cell7). Most of the studies of cytoprotection against toxicity in the liver are about cytoprotection from carbon tetrachloride. Ethanol hinders DNA synthesis in both animal and human livers8), but the studies on cytoproteciton of liver damage caused by ethanol is insignificant. Also, in an experiment for detoxifying the liver, using a test tube, material was discovered which naturally detoxified liver toxicity caused by carbon tetrachloride9). However, nothing has yet been discovered for detoxifying liver toxicity caused by ethanol9). Therefore, it would be a significant find to discover material that can protect the liver from toxicity by ethanol.
The authors observed that DNA synthesis in the liver cell culture of an albino rat medicated several kinds of PG. By measuring peroxides and DNA synthesis, we made, comparative studies about whether or not PG increased DNA synthesis have cytoprotection against liver damage caused by ethanol.
MATERIALS AND METHODS
1. Animals and Reagents
Mature male Sprague-Dawley rats were obtained from the Genetic Engineering Research Institute(GERI in KIST, Taejeon, Korea). All animals were maintained with standard laboratory food for rats and sterilized water. The animal quarters were maintained at 21ŌĆō24┬░C and 40ŌĆō60% relative humidity. A 12-hour light and dark circadian cycle was repeated.
Collagenase (Type 1), EGTA, Trypan blue, PG, DMSO (dimethyl sulfoxide), 2-thiobarbituric acid (TBA) and 1,1,3,3,-tetramethoxypropane (TMP) were purchased from Sigma Chemical Co. (St. Louis, MO, USA). Insulin and penicillin were obtained from E.R. Squibb & Sons, Inc. (Princeton, NJ, USA). Strepytomycin was purchased from Eli Lilly (Indianapolis, In, USA). DulbeccoŌĆÖs MEM was obtained from Flow Laboratories, Inc. (McLean, VA, USA). Vitrogen 100 purified bovine dermal collagen (type 1) was purchased from Collagen Corporation (Palo Alto, CA, USA). Bio-Rad, as reagents utilized for protein assays, were obtained from Bio-Rad Laboratories (Cat. 500ŌĆō0006 Hercules, Richmond, CA, USA). [3H]-thymidine was purchased form NEN Corporation (New England, UK).
Hepatotoxic agents (ethanol) and therapeutic agents (PG) were used for toxicological and pharmacological studies. All agents were added to the culture medium at 4 hour intervals after the initial plating, and the medium was changed every 24 hours for 3 days. Agents were dissolved in DMSO or distilled water. The concentration of DMSO to which the cultures were exposed (0.1% of culture medium) did not affect the cell response.
2. Experimental groups
Experimental groups were divided into normal controls, a PG treated group, an ethanol treated group and an ethanol with PG combine treated group (ethanol+PG group). For the study of DNA synthesis, we used several kinds of PG concentration, such and 10ŌłÆ8M, 10ŌłÆ7M, 10ŌłÆ6M, 10ŌłÆ5M. PG was changed consecutively everyday for 3 days in the PG-treated group. In the case of ethanol & PG combine treated group, the concentration of PG was 10ŌłÆ6M, 10ŌłÆ5M and the ethanol was 100 mM, 200 mM. For the study of malondialdehyde production, ethanol was treated with 50 mM, 100 mM, or 200 mM. Also, ethanol in combination with PG was treated in the measurement of malondialdehyde.
3. Preparation of isolated hepatocytes
Hepatocytes were isolated through the collagenase perfusion method proposed by Dickins et al.10) Rats were anesthetized with urethan (1 g/kg body weight), and a strict aseptic technique was maintained throughout the following procedure: the abdomen was opened by a midline incision and the intestines were displaced to the left. Then the hepatic portal vein was cannulated with an 18 gauge catheter placement unit and perfusion of the liver in situ was initiated at a flow rate of 15ml/min with al Masterflex pump (Cole Parmer, Chicago. IL, USA). To allow the blood to escape and perfusate from the liver, the inferior vena cava was cut. After about 100ŌĆō150ml of buffer had been perfused through the liver, the thoracic cavity was opened, the superior vena cava was cannulated with a 14 gauge catheter placement unit, and the inferior vena cave was ligated. This diverted the outflow of the liver perfusate to the superior vena cava cannula which was returned to the perfusion bottle for recirculation through the liver of the animal. Throughout the entire procedure, the perfusion buffer used was Ca2+-free HanksŌĆÖ balanced salt solution (HBSS) supplemented with insulin (10ŌłÆ7 M) and gentamycin sulfate (50 ╬╝g/ml), 0.5 mmol/l EGTA. It was maintained at 37┬░C and gassed continuously with 95% O2 and 5% CO2. After recirculation of the perfusion buffer was established, collagenase was added via a 0.45╬╝m filter (Millipore) to the bottle of recirculation perfusion buffer (about 100ml), and perfusion was continued for 15ŌĆō20 min by which time the liver had swollen. The liver was removed to a beaker containing warmed (37┬░C) perfusion buffer (50ml) to which collagenase had not been added, and the capsule was ruptured with sterilized scissors. Hepatocytes were released by gentle swirling of the liver and pipetting with a large bore pipette. The cell suspension was filtered through a 210╬╝m nylon mesh into a beaker placed on ice. The filtrate was transferred to ice-cold, sterile 50ml centrifuge tubes, and the hepatocytes were sedimented by centrifugation at 50g for 4 minutes. The pellets were washed two to three times and the final sediment was resuspended in the perfusion buffer (about 20ml) and stored on ice until further use. The viability of the cells was assessed in the final cell suspension with 900╬╝l of 0.4% (w/v) trypan blue in 0.95% (w/v) NaCl by allowing the mixture to stand for 5 minutes on ice. A sample was transferred to a chamber for determination of the viable and nonviable cells.
4. Conditions of hepatocytes culture
The cell suspension was diluted to 0.4├Ś106 cell/ml in hormone-supplemented complete AB media11) and 2ml were pipetted into dishes precoated with 100╬╝g of rat tail collagen. After hepatocytes were inoculated into collagen-coated culture dishes, they were incubated at 37┬░C in a humidified 5% CO2/95% air incubator for 72 hours and the medium was changed every 24 hours.
5. Determination of DNA synthesis and DNA assay
The rate of DNA synthesis was determined by pulse-labelling cultured cells with [3H]-thymidine at 37┬░C for 2 hours. After labelling, hepatocytes were washed two times each with cold saline. The cells were harvested by rubber policemen and solubilized with NaOH(0.2 N, 1ml). The cell solution was neutralized with an equal of 0.2 N HCl and precipitated with 10% trichloroacetic acid (TCA). After precipitating, TCA precipitated material were each washed twice with 5% TCA. The final pellet was solubilized with 1 ml of 0.2 N NaOH. Aliquots of this solution were used for measuring radioactivity, DNA amount and protein level. Incorporation of [3H]-thymidine was determined by liquid scintillation spectrophotometer. Results were presented as mean┬▒SD of triplicate cultures from representative experiments. Each experiment was carried out at least three times with cells. DNA content was measured by the method of Labarca et al.12) using the fluorescence spectrophotometer(Hitachi). All DNA determinations using Hoechst 33258 reagent were performed in a phosphate-saline (2M NaCl, 50 mM Na2HPO4, and 2 mM EDTA, pH 7.4) buffer containing 1╬╝g of Hoechst 33258 reagent per milliliter. Aliquots of sample solution (0.1ml) were slowly diluted with 2.4ml of phospha-tesaline buffer. Following incubation for 5 min at 20┬░C, the fluorescence intensity was measured at the excitation wave length of 355 nm and the emission wave length of 460 nm. Calf Thymus DNA was used to generate a standard DNA curve.
6. Malondialdehyde assay
The assay methods proposed by Guidet et al.13) were used to assess malondialdehyde (a measure of lipid peroxidation). Final cultured hepatocytes were weighed, minced and homogenized immediately in 0.02 M sodium phosphate buffer, pH 7.4 (1:10 w/v). Immediately, 1ml of 17.5% trichloroacetic acid (TCA) was added to 1ml of the homogenate and the specimen was then placed on ice. After adding 1ml of 0.6% thiobarbituric acid and pH 2, the homogenates were placed in a boiling water bath for 15 minutes and then allowed to cool. One millimeter of 70% TCA was added and the mixture was allowed to incubate for 20 minutes. The sample was then centrifuged for 15 minutes at 2,000 rpm and optical density of the supernatant read at 534 nm against a reagent blank with a spectrophotometer. The amount of malonidialdehyde, expressed in nanomoles, was calculated with a molar extinction coefficient of 1.56├Ś105 M1cmŌłÆ1.
Results
1. DNA synthesis and DNA quantity analysis
1) Normal controls
DNA synthesis of the control group (DMSO only) showed 80,980┬▒4,911 DPM/mg protein.
2) PG treatment group
After PG treatment, DNA synthesis exhibited 97,777┬▒5,366 DPM/mg protein in 10ŌłÆ5 M PGA1. With 10ŌłÆ8M, 10ŌłÆ7M, 10ŌłÆ6M, and 10ŌłÆ5M PGD2 treatment, DNA synthesis resulted in 109,368┬▒8866, 131,659┬▒9355, 120,736┬▒10202, and 133,025┬▒4782 DPM/mg protein, respectively. With 10ŌłÆ8M, 10ŌłÆ7M, 10ŌłÆ6M, 10ŌłÆ5M PGE1 treatment, DNA synthesis showed 104,195┬▒2,511, 107,983┬▒5,9045, 122,0114,008, 122,986┬▒5,625 DPM/mg protein. With 10ŌłÆ7M, 10ŌłÆ6M, 10ŌłÆ5M PGE2 treatment, DNA synthesis revealed 112,044┬▒1,205, 108753┬▒10,599, 117,545┬▒13,802 DPM/mg protein. With 10ŌłÆ8M, 10ŌłÆ7M, 10ŌłÆ6M PGI2 treatment, DNA synthesis resulted in 119,772┬▒12,422, 119,004┬▒2,413, 104,098┬▒6,204 DPM/mg protein. With 10ŌłÆ8M, 10ŌłÆ7M PGF2a treatment, DNA synthesis showed 101,358┬▒1,015, 102744┬▒8,028 DPM/mg protein. Therefore, the rate of DNA synthesis in these cases tended to increase significantly (p<0.01) in comparison with normal controls. PGD2 and PGE1 were increased DNA synthesis in all concentrations significantly, but the other PG were increased DNA synthesis slightly in 10ŌłÆ8M, 10ŌłÆ7M, 10ŌłÆ6M only (Table 1).
3) Ethanol treatment group
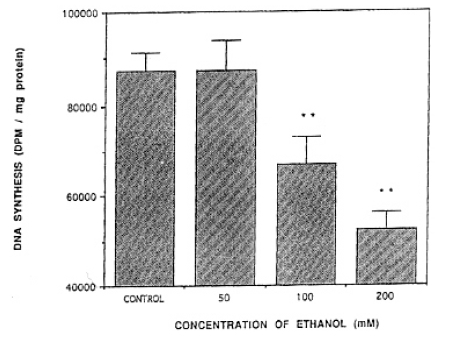
The rate of DNA synthesis decreased with each concentration of ethanol treatment. DNA synthesis exhibited 87.300┬▒6,459 DPM/mg protein in the concentration of 50 mM of ethanol. DNA synthesis in the concentration of 50 mM of ethanol was not statistically significant in comparison with normal controls (86,414┬▒3,786 DPM/mg protein) but when treated with 100 mM and 200 mM of ethanol, DNA synthesis resulted in 66,962┬▒6,195, 52,334┬▒3,883 DPM/mg protein, respectively. Thus, the result was that the rate of DNA synthesis decreased significantly in comparison with normal controls (Fig. 1).
4) Treatment group of ethanol in combination with PGD2 or PGE1
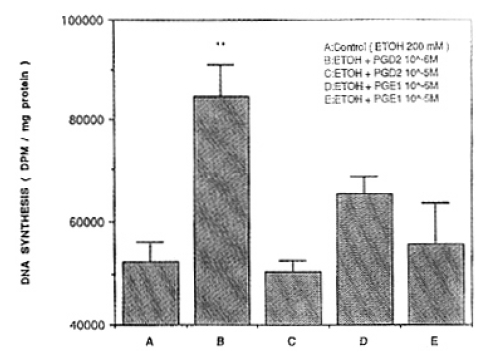
With 10ŌłÆ6M, and 10ŌłÆ5M PGD2 treatment in the concentration of 100mM of ethanol, DNA synthesis resulted in 109,772┬▒11,184 DPM/mg protein and 88,453┬▒11,559 DPM/mg protein(p<0.01), respectively. The differences were not significant compared with controls. With 10ŌłÆ6M and 10ŌłÆ5M PGE1 treatment, DNA synthesis showed 72,336┬▒8,499 DPM/mg protein, and 55,143┬▒10,296 DPM/mg protein. There was no difference in comparison with ethanol treatment only(Fig. 2). In combine treatment with 10ŌłÆ6M PGD2 and 200 mM of ethanol, the rate of DNA synthesis increased significantly, compared with ethanol treatment only. However, in the case of 10ŌłÆ5M PG D2, DNA synthesis showed 50,370┬▒2,338 DPM/mg protein and there was no difference in comparison with the ethanol treatment. Combined with 10ŌłÆ6M PGE1 treatment, DNA synthesis tended to increase significantly (65,344┬▒3,219 DPM/mg protein) in comparison with the ethanol treatment only. However, in case of 10ŌłÆ5M PGE1, DNA synthesis tended to increase slightly (55,803┬▒7,748 DPM/mg protein) compared with the ethanol treatment only, although the difference was not significant(Fig. 3). Therefore, in the combine treatment of ethanol and PG, 10ŌłÆ6M PG was higher than 10ŌłÆ5M PG in the rate of DNA synthesis.
2. Measurements of Malondialdehyde(MDA)
1) Normal control
When DMSO was treated on day 1 and day 2 in normal control, level of MDA synthesis showed 0.26┬▒0.02, 0.29┬▒0.01 ╬Ę mole/mg protein, respectively.
2) PG treatment group
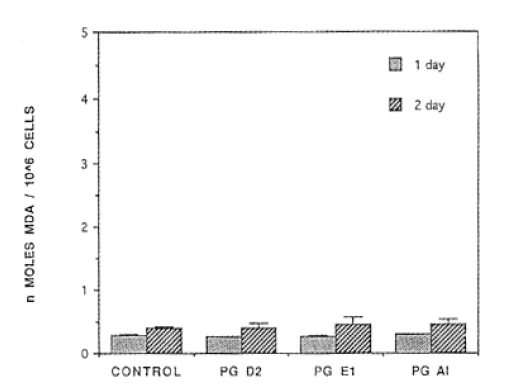
24 hours after PGD1, PGE1, or PGA1 treatment, level of MDA synthesis showed 0.39┬▒0.11, 0.45┬▒0.12, 0.46┬▒0.08 ╬Ę mole/mg protein, respectively. After PGD2, PGE1 or PGA1 were treated consecutively on day 1 and day 2, level of MDA synthesis exhibited 0.39┬▒0.11, 0.45┬▒0.12, 0.46┬▒0.08 ╬Ę mole/mg protein, respectively, but there were on statistically significant differences in comparison with normal controls (Fig. 4.)
3) Ethanol treatment group
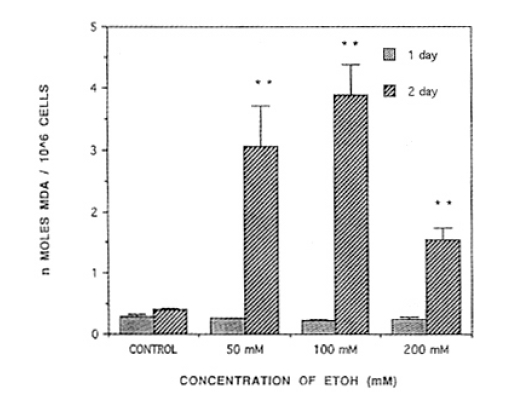
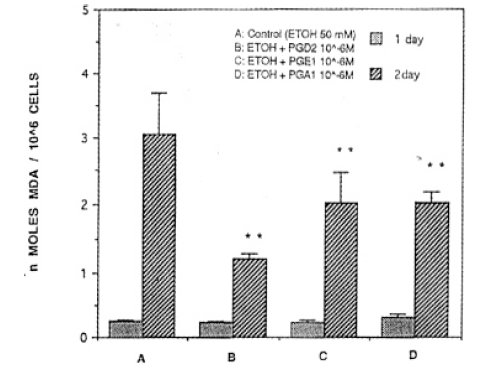
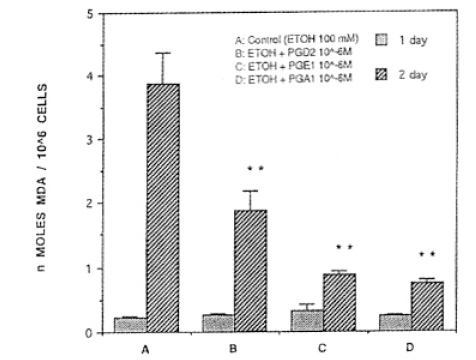
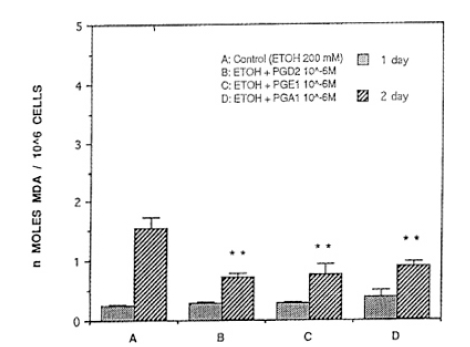
When 50mM, 100mM, or 200 mM of ethanol was treated, MDA synthesis resulted in 0.25┬▒0.01, 0.22┬▒0.02. 0.24┬▒0.03 ╬Ę mole/mg protein, respectively, but did not reach the level of statistical significance compared with normal control. After ethanol was treated consecutively for two days, level of MDA synthesis showed 3.05┬▒0.63, 3.870┬▒ŌłÆ.50, 1.54┬▒0.19 ╬Ę mole/mg protein, respectively, and reached a level of statistical significance in comparison with normal control (p<0.01, Fig. 5).
4) Ethanol plus PG treatment group
There was no statistical significance on day 1 of ethanol combined with PG(ethanol+PG) treatment. After ethanol+PG was treated for 2 days consecutively, PGD2, PGE1 or PGA1, was treated with 50 mM of concentration of ethanol. MDA synthesis resulted in 1.20┬▒0.09, 2,01┬▒0.44, 20.3┬▒0.15 ╬Ę mole/mg protein, respecitvely, which are significantly lower than the ethanol treated group (p<0.01, Fig. 6.) When the concentration of ethanol was 100 mM, MDA synthesis of PGD2, PGE1, and PGA1 was 1.86┬▒0.29, 0.87┬▒0.06, 0.74┬▒0.04 ╬Ę mole/mg protein, respectively, and they were significantly lower than the ethanol treated group (3.87┬▒0.50) (p<0.01)(Fig. 7). When concentrations of ethanol were 200 mM, levels of MDA synthesis of PGD2, PGE1, and PGA1 was 0.73┬▒0.05, 0.75┬▒0.17, ŌłÆ.89┬▒0.09 ╬Ę mole/mg protein, respectively, and they were significantly lower than the ethanol treated group (1.54┬▒0.19 ╬Ę mole/mg protein) (p<0.01, Fig. 8).
DISCUSSION
PG is an unsaturated lipid with an organization of 20 carbon structures, and is synthesized by most of the cells in the human body. PG stimulates or restrains adenylate cyclase in cell so that in function as an agency of local cell reactions14). Generally, it functions as a defensive regulator in the heartŌĆÖs blood, stomach and urinary organs and is involved in the constriction and relaxation of the bronchus, inflammation, thrombocyte and immune system responses.
Especially, PG is mostly synthesized in the stomach, and facilitates the treatment and prevention of ulcers4). While the role of PG in the liver is to create PGD2, PGE2 and PGF2a in nonparenchymal Kupffer cell or sinusoidal endothelial cells by several stimulations, PG changes on the surface of a liver cell15,16). This implies that PG plays an important role in the liver. The liver cell wall is damaged by lipid hydroperoxides mediated by an oxygen free radical and lipid peroxidation. Such lipid peroxidation destroys the integrity of the cell wall which in turn causes wide cell death17). In addition, when an adultŌĆÖs liver is exposed to alcohol, it cause a lipid peroxidation18). The liver plays an important role in removing ethanol in mammals. Ethanol oxidizes in the liver through alcohol dehydrogenase (ADH), the microsomal ethanol oxidizing system and catalase. The toxicity of ethanol is closely related to the metabolism in the liver. Ethanol increased nicotinamide dinucleotide phosphate (NADH) and acetaldehyde. Acetaldeyde is toxic and created in the process of ethanol metabolism. It causes alcoholic liver disease to hasten peroxidation of the cell wall by affecting the function of cell mitochondria. It also inflames by secreting interleukin-6, interleukin-1, interleukin-8 and by activation of cytokines19). Acetaldehyde is the main metabolic of ethanol and has a stronger toxicity than ethanol through the immune system rather than through the direct effect of cell metabolism20). It also decreases the oxidization of nicotinamide adenine dinucleotide (NAD) in mitochondria. That is, the increase of NADH/NAD+ and NADPH/NADP+ changes the metabolism of fat, protein, hormone and purine. NADH also affects several routes of metabolism in the liver. For example, it increases the formation of free radicals21).
The main reason for functional disorders of the liver by ethanol is the change of components in the cell wall caused by functional disorders of mitochondria and oxygen species 02ŌłÆ, OHŌłÆ, H2O2. In addition, chronic over-ingestion hinders the ability of the liver cell to revive22) and can cause hepatitis, fibrosis and cirrhosis. Chronic liver disease differs in every human body according to different hereditary and immune factors23). McNeil et al.24) put particular emphasis on carefully administering medicine which decrease PG synthesis to a patient who has suffered from chronic liver disease because of slow recovering of the PG. Carter et al19), assessed that a liver damaged by ethanol directly causes the disorder of DNA synthesis. Furthermore, the rate of synthesis is decreased by ethanol even though the rate of DNA synthesis can be increased by hormones, such as insulin and epidermal growth factor(EGF).
Stachura et al.25,26) first reported that PGE2 serve as cytoprotection to the necrosis of a liver cell by carbon tetrachloride in rats. Since then, studies about different types of liver damage have been developed and, recently, PGG2 has been administered clinically to hepatic failure patients27). It is reported recently that the cytoprotection of PG for liver damage can steady microviscosity28). The cytoprotection of PG for liver damage by ethanol is not completely known, but seems to work by steadying the cell walls28,29). McNeil et al.24) administered ethanol to sham-operated and partially hepatectomized rats and the ethanol caused a reduction in hepatic DNA synthesis and mitosis but, in case of administration of PGE2 to rats, DNA synthesis and mitosis increased significantly. Also, they observed that DNA synthesis and mitosis increased when PGE2 was given prior to ethanol administration. Thus, they concluded that PGE2 increased hepatic DNA synthesis and regeneration in normal rat liver and overcame their inhibition when ethanol was given after partial hepatectomy. Dlugosz et al.30) fed rats with ethanol for 5 week and the rats developed functional alterations of hepatic mitochondira and steatosis of the liver. This study indicates that, although the mechanism of action of misoprostol is unknown, impairment of rat liver mitochondrial respiratory function in chronic injury can be partially prevented or corrected by treatment with the synthetic prostaglandin E1 derivative misoprostol. Devi et al.31) asserted that PGŌĆÖs role, in terms of liver damage by ethanol, is protecting cells with glutathione and mitochondria maintenance functions. Lefer et al.32) asserted that PGI2 act as a protectant in the liver cell of cats. In support of that assertion, there was a report morphologically proving that PG protects the catŌĆÖs liver from damage by hypoxia33). Also, Lalyre et al.34) asserted that PG does not have a direct influence on ethanol metabolism. PG acts as cytoprotection for the liver and promotes DNA synthesis and an increase in cell count. However, the decrease of DNA synthesis in the Hela cell is associated with the addition of PG7).
There was difference in variation of DNA synthesis after PG treatment for three days, but every kind of PG increased DNA synthesis. Of course, the effect of PG on the increase of liver cells occurs only when treated locally. In an experiment involving a living creature, synthesis does not occur in an unmedicated lobule because it is diluted and destructed in pulmonary circulation35). In each concentration, it was shown that PGD2 and PGE1 facilitated the growth of a normal liver cell. As the concentration of ethanol increased, DNA synthesis decreased. In medicating both PGD2 and ethanol, DNA synthesis increased more in the one medicated with 10ŌłÆ6 M concentration of PGD2 than in the normal one. It was similar to the case reported by Makowska36) when cutting 68% of a ratŌĆÖs liver and medicating it with 2 gm/kg of 100% alcohol increased DNA synthesis by 25%. That is, when medicating PGD2 before ethanol, in a fixed concentration, the restraint effect of ethanol for DNA synthesis is eliminated. Thus, medicating PG before ethanol prevents variation of liver cells and lymphocytes while medicating after ethanol helps revive cells25). When the concentration of PGD2 is 10ŌłÆ5 M, DNA synthesis is lower than 10ŌłÆ6M, and there is no difference when the concentration of ethanol is 200 mM. Also, in medicating both PGE1 and ethanol, when the concentration of PGE1 is 10ŌłÆ6M, DNA synthesis decreases and is lower than 10ŌłÆ6M. It is thought that there is a proper concentration of PGD2 for liver damage by ethanol, and when there is more than proper concentration, ethanol does not have the effect of cytoprotection.
PGD2 and PGE1 did not vary from the normal case of creating the value of MDA by measuring lipid peroxidation. Also, PGA1 did not vary from PGD2 and PGE1 in creating the value of MDA by measuring lipid peroxidation. This is because there was toxicity in the liver by PG itself. There were no differences between the different PG when medicating ethanol together.
Therefore, all kinds of PG has a similar protection effect to ethanol induced decrease of DNA synthesis on the cultured hepatocytes. However, there is a little bit of difference in the ethanol co-treat group. These differences may depend on the type of PG that have different effects on the DNA synthesis. Most kinds of tested PG increased the DNA synthesis of hepatocytes. Especially, PGD2 increased the DNA synthesis of hepatocytes most signigicantly. PG did not have any effect on the production of MDA. The protection mechanism of PG to the damage of hepatocytes induced by ethanol is not obvious yet. PG might stabilize the membrane of hepatocytes, and they protect the ethanol induced damage of hepatocytes.



 PDF Links
 PubReader
 ePub Link
 Full text via DOI
 Download Citation
 Print
Print


