KP Index at the Initiation of Dialysis for Patients with End-stage Renal Disease
Article information
Abstract
Background
The time at which renal replacement therapy (RRT) is initiated in patients with end-stage renal disease (ESRD) has a great influence on the prognosis of the patient; however, there are currently no accurate guidelines for the initiation of RRT. Traditionally, nephrologists usually initiate RRT on the basis of the observation of the uremic symptoms and changes in the laboratory parameters, such as the serum creatinine concentration and/or glomerular filtration rate (GFR). DOQI guidelines suggest a weekly Kt/Vurea < 2.0 or an nPNA < 0.8 g/kg/day as objective indices for the initiation of dialysis. Thus, a KP index was formulated (weekly Kt/Vurea+2.5 × nPNA) ×½ using the above two clinically useful and objective indices to determine the adeguate time to initiate RRT in patients with ESRD.
Methods
Of 186 patients admitted to the renal unit of Soonchunhyang Bucheon hospital, those with ESRD and a weekly Kt/Vurea below 3.0 were selected. The patients with a weekly Kt/Vurea index between 1.0 and 2.0 were classified into one of two groups; KP index > 2.0 and KP index < 2.0. The groups were compared and analyzed in relation to their renal function, biochemical indices and the numbers of patients per group starting RRT. Further, the correlations between the KP and other indices were analyzed in all the patients. The patients were then further divided into another two groups according to their weekly Kt/Vurea and KP index: group one; between 1.5 and 2.0 and group 2; between 2.0 and 2.5. The numbers of patients per group starting RRT were compared.
Results
The KP index < 2.0 group showed significantly lower indices for weekly Kt/Vurea, nPNA and %LBM (%) than those of the KP index > 2.0 group, while there were no significant differences between the groups in the serum albumin concentration, serum creatinine concentration, FFEFBM and RRF. Also, there was a statistically significant higher rate of incidence of patients starting RRT in the KP index < 2.0 group than in the KP index > 2.0 group. There was a significant correlation between the KP and other indices in all patients. When comparing the number of patients starting RRT, the weekly Kt/Vurea index demonstrated no significant differences between the 1.5 < weekly Kt/Vurea < 2.0 and 2.0 < weekly Kt/Vurea < 2.5 groups, but the number of patients starting RRT in the 1.5 < KP index < 2.0 group was significantly higher than that in the 2.0 < KP index < 2.5 group.
Conclusion
The KP index is considered a clinically useful index in ESRD patients for determining an appropriate time for the initiation of RRT. Also, the timing of the initiation of RRT should be fixed with regard to the various other indices and clinical features for a desirable prognosis of the patients. In addition, further studies will be required to determine accurate guidelines for an appropriate time for RRT initiation.
INTRODUCTION
The time at which renal replacement therapy (RRT) is initiated in patients with end-stage renal disease (ESRD) has greatly influenced the prognosis of patients, and various signs of protein-energy malnutrition in patients with ESRD are strong predictors of increased morbidity and mortality1–3). Absolute indications for the initiation of RRT include; pericardial effusion, pulmonary edema, uncontrolled hypertension, uremic encephalopathy, uremic neuropathy, metabolic acidosis, and uncontrolled bleeding tendency. Relative indications for the initiation of RRT include: poor appetite, anorexia, fatigue, general weakness, cognitive disorder, pruritus, and depressive mood4). However, there are currently no accurate guidelines for the initiation of RRT. Traditionally, most nephrologists usually start RRT on the basis of the observations of the uremic symptoms and changes in the laboratory parameters, such as serum creatinine concentration and/or glomerular filtration rate (GFR).
Because there are no accurate guidelines, it is difficult to decide the best time to initiate RRT in patients with higher BUN or serum creatinine levels, but without uremic symptoms, or patients with uremic symptoms, but lower BUN or serum creatinine levels5). Park et al. reported there was no correlation between the uremic symptoms and residual renal function (RRF) at the time of RRT initiation6). The urea clearance in patients with chronic renal failure (CRF) underestimates the GFR, but the creatinine clearance in patients with CRF overestimates the GFR4). Some investigators have suggested that the mean creatinine and urea clearances would be reasonable estimates of the GFR, at least in patients with low renal function levels. The serum creatinine levels are influenced by diet, age, gender, muscle mass, diabetes and race7). A few prospective studies have demonstrated no correlation between the biochemical indices, including BUN and serum creatinine, and the survival rate of patients with ESRD5, 8).
The DOQI guidelines suggest a weekly Kt/Vurea < 2.0 or a normalized protein equivalent of nitrogen appearance (nPNA) < 0.8 g/kg/day as objective indices for the initiation of RRT9). Thus, a KP index was formulated (weekly Kt/Vurea+2.5 × nPNA) × 1/2 using the above two clinically useful and objective indices for the determinatione of the best time to initiate RRT in patients with ESRD. The aims of this study were to evaluate the usefulness of the KP index, as an objective index for the determinatione of the best time to initiate RRT in patients with ESRD, and evaluate the correlations between the KP index, renal function indices, protein intake index, and nutritional indices.
MATERIALS AND METHODS
1. Subjects
A total of 186 patients with a weekly Kt/Vurea < 3.0 were admitted to Soonchunhyang University Hospital in Bucheon, Korea, between February 1, 2001 and October 15, 2002. Age, gender, height, body weight, underlying renal disease, and 24-hour urine volume were recorded for all the subjects. Blood chemistries, including serum creatinine, BUN and serum albumin, and 24-hour urine chemistries, including protein, creatinine and urea nitrogen, were measured by standard techniques.
1) Renal function indices
The weekly total Kt/Vurea, creatinine clearance (Ccr) and urea nitrogen clearance were calculated in the urine collected over a 24-hour period. The residual renal function (RRF) was estimated as the mean renal urea and creatinine clearances. The urea volume distribution (Vurea) was calculated using the Watson equations10).
Uurea: urine urea nitrogen concentration (mg/dL)
Vu: urine volume (mL)
Ucr: urine creatinine concentration (mg/dL)
Per: plasma creatinine concentration (mg/dL)
BSA: body surface area (m2)
RRF: residual renal function
2) Protein intake index
The dietary protein intake was calculated from the protein equivalent of total nitrogen appearance (PNA), using the Bergström equation 211). The nPNA was estimated as the PNA normalized to the standard body weight.
UNA: urea nitrogen appearance (g/day)
V: the urea volume distribution by the Watson normogram10)
3) Nutritional indices
The fat-free edema-free body mass (FFEFBM) was calculated from the creatinine kinetics11). The percent lean body mass (%LBM) was estimated as the FFEFBM normalized to a standard weight12).
24Gcr (Gut creatinine) = 0.036×Pcr×body weight
% LBM (%) = FFEFBM/standard weight×100
24 Ucr: 24 hours urine creatinine amount (mg/day)
24 Gcr: 24 hours gut creatinine amount (mg/day)
4) KP index
The KP index was formulated, using the Kt/Vurea and nPNA, in an attempt to find a clinically useful and objective index for the determinatione of the adeguate time to initiate RRT in patients with ESRD.
2. Methods
Patients with a weekly Kt/Vurea between 1.0 and 2.0, and being considered for RRT, were divided into two groups according to their KP index. The renal function indices, protein intake index, nutritional indices and incidence of initiation of RRT were compared between the two groups. The correlations between the KP index, renal function indices, protein intake index and nutritional indices were evaluated in all the patients. The incidences of initiation of RRT in the 1.5 < Kt/Vurea < 2.0 and 2.0 < Kt/Vurea < 2.5 groups were also compared, as were the incidences of initiation of RRT in the 1.5 < KP index < 2.0 and 2.0 < KP index < 2.5 groups.
3. Statistical Analysis
A statistical analysis was performed using the SPSS program. The student’s t-test was used to compare the differences between the two groups, and the Pearson chi-square test to compare the incidences between the two groups. Pearson’s correlation was used to estimate the correlation between two variables. The difference was considered significant when the p value was less than 0.05.
RESULTS
1. Clinical Characteristics
Of the 186 patients, there were 94 males and 92 females, with a mean age of 56.1 ±14.7 years. In an analysis of the underlying disease, 82 patients were diabetics, 46 had chronic glomerulonephritis, 12 had hypertension, and 6 had polycystic kidney disease. Diabetes was the most common cause of chronic renal failure. The mean serum albumin, serum creatinine, weekly Kt/Vurea, nPNA, %LBM and KP index values were 3.24±0.86 g/dL, 6.67±3.40 mg/dL, 1.61±0.74, 0.92±0.30 g/kg/day, 45.9±13.2% and 1.95±0.67, respectively (Table 1).
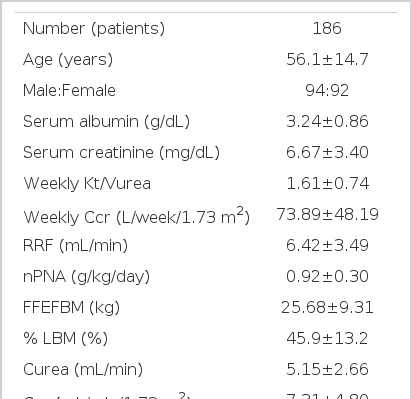
Clinical and laboratory data of the all patients
2. Comparison of indices according to KP index in the patients with weekly Kt/Vurea index between 1.0 and 2.0
Of the 186 patients, 91 had a weekly Kt/Vurea between 1.0 and 2.0, with 54 and 37 having a KP index < 2.0 and > 2.0, respectively. The weekly Kt/Vurea, nPNA, %LBM in the KP index < 2.0 and > 2.0 groups were 1.37±0.24 vs. 1.71±0.20, 0.79±0.15 vs. 1.12±0.20 and 44.7±10.6 vs. 54.0±11.1, respectively, so were all significantly lower in the KP index < 2.0 than the KP index > 2.0 group (p<0.001)(Table 2). There were no significant differences between the two groups in relation to the serum albumin, serum creatinine, and FFEFBM, RRF, and 24-hour urine protein excretion (Table 2). The incidence of RRT in the KP index < 2.0 group (26/54, 48.2%) was significantly higher than in the KP index > 2.0 group (7/37, 18.9%) (Table 3).

Comparison of indices according to KP index in the patients with weekly Kt/Vurea index between 1.0 and 2.0
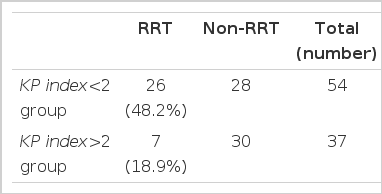
Comparison of frequency of RRT according to KP index in the patients with weekly Kt/Vurea index between 1.0 and 2.0
3. Correlation matrix for indices of KP index, renal function, protein intake, and nutritional status in the all patients
There were significant correlations between the KP index and the weekly Kt/Vurea (r=0.896, p<0.01), RRF (r=0.681, p<0.01), cr (r=0.520, p<0.01), nPNA (r=0.896, p<0.01), %LBM (r=0.626, p<0.01) (Figure 1) and FFEFBM (r=0.485, p<0.01). There was also a significant correlation between weekly Kt/Vurea and nPNA (r=0.605, p<0.01) (Figure 2, Table 4).

Correlation between KP index and % LBM.
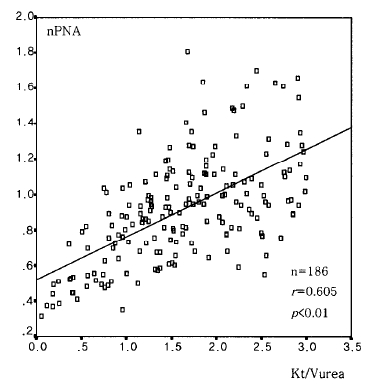
Correlation between weekly Kt/Vurea and nPNA.
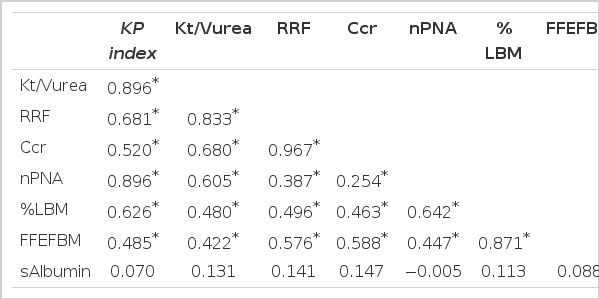
Correlation matrix for indices of renal function, protein intake and nutritional status in the all patients
4. Comparison of incidence of RRT according to Kt/Vurea
Of the 186 patients, 44 and 32 were included in the 1.5<Kt/Vurea <2.0 and 2.0<Kt/Vurea <2.5 groups, respectively, and the incidence of RRT was not significant between these two groups (11/44, 25.0% vs. 3/32, 9.4%)(Table 5).
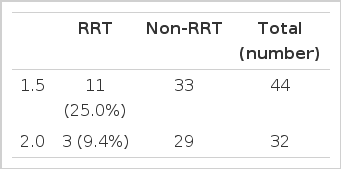
Comparison of incidence of RRT according to Kt/Vurea
5. Comparison of incidence of RRT according to KP index
Of the 186 patients, 55 and 59 were in the 1.5<KP index <2.0 and 2.0<KP index <2.5 groups, respectively, and the incidence of RRT was significantly higher than in the 2.0<KP index <2.5 group (8/59, 13.6%) (Table 6).
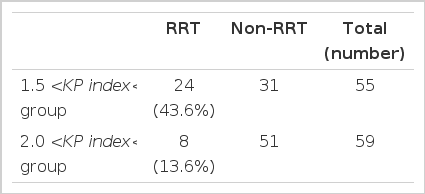
Comparison of incidence of RRT According to KP index
DISCUSSION
There is still much controversy about the most suitable time to initiate RRT, in patients with ESRD, to increase the patient survival rate, improve the quality of life, and minimize other organ failures. The nutritional factors at the time of RRT initiation, in patients with ESRD, are strong predictors of increased morbidity and mortality1–3), and malnutrition is recognized as being common in patients with CRF. Kang et al. described that the biochemical indices, including serum albumin, prealbumin, creatinine, cholesterol, insulin like growth factor-1 (IGF-1), C-reactive protein (CRP) and abnormal acid-base metabolism, were useful in estimating the nutritional status of CAPD patients, and the serum albumin, IGF-1, transferrin, serum creatinine and prealbumin were significantly lower in their malnutrition group of CAPD patients13). Song et al. reported that biochemical abnormalities, including hypoalbuminemia (<3.5 g/dL), hypocholesterolemia (<130 mg/dL), and hypophosphatemia (<5.0 mg/dL), were strong predictors of increased mortality during the early stages of RRT in hemodialysis patients3). These indices were continually lower during the first six months after hemodialysis. Several studies have reported that hypoalbuminemia during the early stages of RRT was the strongest predictor of patient survival rates2, 3). The nutritional status during the pre-dialysis period greatly influences the prognosis of patients with ESRD.
Hakim et al. recommended starting dialysis before revealing uremic side effects or uremic symptoms and before the malnutritional status had been confirmed. Their definition of malnutrition included a serum albumin level lower than 4.0 g/dL, dietary protein intake lower than 0.7 g/kg/day, weight loss, decreased muscle mass, and decreased serum transferrin levels4). Hertel et al. reported that starting RRT during the early stages of ESRD increased the serum albumin levels and raised the urea reduction rates by improving the nutritional status14). Controversially, Jamie et al. suggested there were no differences in long-term survival rates of patient with ESRD between groups started at an early or late stage15). Also, many studies reported the inappropriate decision to initiate of RRT in patients with ESRD caused clinical side effects and unexpected economical effects which consequently led to increased prevalence rates and medical expenses16–19).
The DOQI guidelines suggest a weekly Kt/Vurea<2.0 or nPNA<0.8 g/kg/day as objective indices for the initiatione of RRT, and in patients with a weekly Kt/Vurea lower than 2.09), the GFR calculated by the urea and creatinine clearances was about 10.5 mL/min/1.73 m2. Saran et al. reported the percentage of patients having an nPNA less than 0.8 in the weekly Kt/Vurea>2.0 group (13.6%) was significantly lower than in the weekly Kt/Vurea <2.0 group (66.7%), and suggested a weekly Kt/Vurea<2.0 as an objective index for the initiatione of RRT20). Also, Kim et al. recommended a weekly Kt/Vurea<1.5 or nPNA <0.8 g/kg/day as an objective index for the initiation of RRT in Korean subjects as a Korean’s standard weight was considered lower than that of Westerner subjects21). The present study has shown that a KP index <2.0 is an objective index for the initiation of RRT in Koreans. Ikizler et al. reported a good correlation between the residual renal function and the nutritional index, with the nutritional indices, including protein intake, decreased in relation to the decrease in the creatinine clearance rate22). Park et al. described a positive correlation between the creatinine clearance and the Kt/Vurea with the nPNA6). Our study also showed a good correlation between the Kt/Vurea and nPNA (Figure 2). Kim et al. demonstrated the renal function index to be closely correlated with the protein intake and nutritional status in pre-dialysis patients, and, with a declining small solute clearance, protein intake and nutritional status became worse21). They also commented that the mathematical coupling between the weekly Kt/Vurea and the nPNA was possible because the two indices were calculated from the urea nitrogen levels. Our formulated KP index, using the above two clinically useful and objective indices, could be used to determine the best time to initiate RRT in patients with ESRD. The KP of the KP index was symbolically composed of the K from the weekly Kt/Vurea and the P from the nPNA.
In this study, a significant correlation was found between the KP index and the weekly Kt/Vurea, RRF, Ccr, nPNA, %LBM and the FFEFBM. Therefore, the KP index is a clinically useful index reflecting the renal function and nutritional status of patients with ESRD. There was no significance in the incidence of RRT between the 1.5<Kt/Vurea <2.0 (25.0%) and 2.0<Kt/Vurea <2.5 (9.4%) groups. However, the incidence of RRT in the 1.5<KP index <2.0 group (43.6%) was significantly higher than in the 2.0<KP index <2.5 group (13.6%). So, the KP index is considered a more objective index for ESRD patients in the determinatione of the appropriate time to initiate RRT.
Patients with CRF have to be continuously treated and regularly tested by a nephrologist. Starting dialysis at the most suitable time in ESRD patients apparently improves the patient’s prognosis.
There were some limitations to this study. First, an error by the patient or nephrologist in deciding when to initiate RRT could not be perfectly excluded. Second, comparative analyses between many variable factors, including accompanying diseases, physical activity, medicine history and economical status, were not achieved. Third, there is a need to prove the clinical usefulness of the KP index using a long-term follow-up on patients with ESRD through the observation of the close relevant relation between the KP index and the survival rate by long-term research. Fourth, the KP index was simply designed from the weekly Kt/Vurea and nPNA, and a relationship between these two indices has often been attributed to mathematical coupling. The mathematical coupling undoubtedly contributed to the strength of the correlation between the nPNA and the weekly Kt/Vurea, as the urinary urea concentration was an important joint variable in these two parameters23, 24). So, there is a need for further research to more accurately prove the interrelation between these two indices.
In conclusion, the KP index is considered a clinically useful index for determining the appropriate time to initiate RRT in patients with ESRD. The timing should also be fixed with regard to the various other indices and clinical features for a desirable prognosis of such patients. In addition, further studies will be required to determine accurate guidelines for the appropriate time for the initiation of RRT.