Early Assessment of Myocardial Contractility by Contrast-Enhanced Magnetic Resonance (ceMRI) Imaging after Revascularization in Acute Myocardial Infarction (AMI)
Article information
Abstract
Background :
Recent studies have demonstrated that the size and shape of the hyperenhanced areas on contrast-enhanced magnetic resonance imaging (ceMRI) were nearly identical to areas of irreversible injury, as defined by histochemical staining. We compared the transmural extent of infarct (TEI), as defined by ceMRI, to the initial ECG findings for acute myocardial infarction (AMI), and we also assessed functional contractility according to TEI.
Methods :
12 patients who presented with their first myocardial infarction underwent cine and ceMRI 4 weeks later after their successful revascularization. TEI and wall thickening were determined by using a 30-segment model.
Results :
Infarction was observed in 81 (23.9%) segments, of which 46 segments (56.8%) had abnormal wall motion and 35 segments (43.2%) had normal wall motion. Of the 35 segments, 33 (94.3%) had subendocardial infarction. 17 segments had infarct of less than 25% of the wall thickness, and all of them had normal wall motion. On the other hand, 11 segments had infarct of more than 75% of wall thickness, of which 11 (100%) had abnormal wall motion. None of segments with nearly transmural infarction were observed in non ST-elevation AMI. The majority of the segments with infarct had non-transmural infarction (87.5%), even if the segments were in ST-elevation AMI (76.1%). Infarct size, as defined by ceMRI, was strongly correlated with peak CK-MB and Troponin-T (r=0.96, p<0.001, r=0.91, p<0.001, respectively).
Conclusion :
TEI defined by ceMRI is inversely related to the contractility after revascularization in AMI. We were able to predict the future contractile function of segments with infarction using ceMRI before revascularization.
INTRODUCTION
Acute coronary syndromes (ACS) represent a spectrum of heart disease including unstable angina, non ST-elevation myocardial infarction and ST-elevation myocardial infarction. Within the heart region at risk, necrosis first begins in subendocardium and then progresses on in a “wavefront” toward the epicardium with the increasing occlusion time1). It was previously believed that transmural infarction is present if the initial electrocardiographic (ECG) finding shows a ST-elevation, and a non-transmural infarction may be present if the ECG shows only transient ST-segment and T-wave changes. However, electrocardiographic-pathologic correlations are known to be far from perfect2). Several techniques for analyzing the extent and degree of myocardial necrosis after an acute ischemic event have been introduced into the clinical setting3–6). Each of these methods has specific advantages for the diagnosis of myocardial viability, but none of them allows the direct visualization of the transmural extent of viable and non-viable tissues. Recent advances in contrast-enhanced magnetic resonance imaging (ceMRI) offers high spatial resolution, and it allows for the direct visualization of the transmural extent of necrotic and non-necrotic myocardial tissues, as the tissues are defined upon histological examination7,8).
Myocardial viability in patients with coronary artery disease and left ventricular dysfunction are strong predictors of patient outcome, and the distinction between reversible and irreversible myocardial injury is important9,10). Ventricular contractile dysfunction is often observed in the acute stage, but it cannot be used to quantify the extent of myocardial salvage and to predict the future outcome because both the necrotic and stunned myocardium will have an impaired contractile function11,12). Using ceMRI, previous studies have shown the transmural extent of infarction (TEI) to be predictive of recovery of segmental contractile function after myocardial revascularization13) and for patients with chronic ischemic heart disease14).
The aim of this study was to assess the relationship between the transmural extent of myocardial necrosis, as defined by ceMRI, and the initial ECG findings, and also to predict the segmental contractile function according to TEI after reperfusion in patients who had their first myocardial infarction.
MATERIALS AND METHODS
Patients population
This study was approved by the Institutional Review Board of Korea University. 12 patients (10 men and 2 women; their mean age was 59.3±7.1 years; 7 had non ST-elevation AMI and 5 had ST-elevation AMI) who were admitted to the coronary care unit at Korea University hospital with the diagnosis of AMI, as defined by a consensus document of the joint ESC/ACC committee15), were prospectively enrolled in our study. The exclusion criteria included patients with a prior history of myocardial infarction, postinfarction angina, active congestive heart failure, atrial fibrillation, aortic stenosis, a history of sustained ventricular arrhythmia, and the inability to lay flat or the standard contraindications to MRI such as pacemakers or cerebral aneurysm clips. All patients had undergone coronary angiography and revascularization if needed, and they all had documented TIMI 3 flow in the infarct-related artery. Cardiac enzymes such as CK-MB and Troponin-T were obtained every 4 hours until the peak level. A ceMRI was performed 4 to 6 weeks later during the clinically stable/recovery phase and after the interventional procedure. The mean interval between the ceMRI and revascularization was 34.74.6 days, and none of the patients had clinical evidence of infarction during this period. There were no patients excluded for technical reasons or because of the image quality of their MRI scans.
MR imaging
Patients were placed at the supine position in a clinical 1.5-T scanner (Siemens Sonata), and a phased-array radio-frequency receiver coil was placed on his or her chest. All images were acquired during breath-holds (about 8 s) and they were gated to the ECG. Double oblique long-axis scouts were taken to obtain the true short-axis and long-axis references. Cine images were acquired in 6 to 8 short axis views and two long-axis views. Short axis views were obtained from 1 cm below the level of the mitral valve insertion, and then at every 10 mm throughout the entire left ventricle using 8-mm-thick slices to minimize the effects of partial volume. The contrast agent was then administered intravenously (Gd-Hp-DO3A, 0.15 mmol/kg), and the contrast-enhanced images were acquired 15 minute later in the same views as was done for the cine images by using a segmented inversion-recovery sequence. The typical voxel size was 1.9×1.4×8.0 mm.
Data Analysis
Definition of segments
The cine and contrast-enhanced images were analyzed using a 30-segment model (5 slices; 6 segments per slice, figure 1).

Segmental model used for scoring of contrast-enhanced MRI and cine MRI. Six equal circumferential segments were analyzed in each short-axis view (A and B ; 5 slices, 6 segments; 30-segment model). The total myocardial area and contrast-enhanced area per sector were traced manually. The extent of contrast enhancement was expressed as a percentage of the total myocardial area (C)
Scoring
The cine images and contrast-enhanced images were interpreted separately by two experienced cardiologists who were blinded to the patients’ identity, and consensus assessments were then reached. Quantitative analysis of the percent of myocardial wall thickening (%WT) was determined with commercial software (ARGUS, Simens) in 30 segments by the modified centerline method, and the results were expressed as a percentage of the end-diastolic wall thickening. Abnormal segmental wall motion was defined by the consensus of 2 observers according to the following scheme; 0=normal, 1=mild-to-moderate hypokinesis, 2=severe hypokinesis, 3=akinesis, 4=dyskinesis. Infracted myocardium was defined as the contrast-enhanced segment on the ceMRI. TEI was also scored by the consensus of the 2 observers independent of the wall motion with using a scheme based on the spatial extent of the hyperenhanced tissue within each segment (0=no hyper-enhancement; 1=1–25% hyperenhanced; 2=26–50% hyperenhanced; 3=51–75% hyperenhanced; 4=76–100% hyper-enhanced) (Figure 1C). Infarct size on the ceMRI was expressed as percentage of the left ventricle (%LV) and it was calculated by the below equation; %LV = [sum of all TEI scores throughout LV (range, 0 to 4)]/(total number of segment × 4).
Statistical analysis
All results were expressed as means±SD. Between-group comparisons for continuous data were made using the independent t-test. The relationships between various clinical and MR characteristics were evaluated using linear regression analyses. All statistical tests were 2-tailed; p values <0.05 were regarded as statistically significant.
RESULTS
Patient characteristics
Table 1 summarizes the clinical data of the patient population.
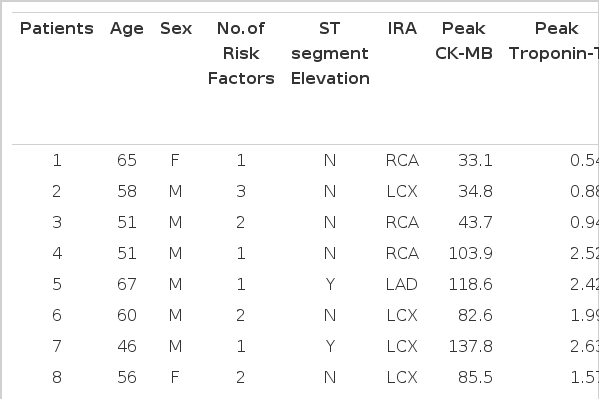
Patients characteristics p<0.05
Segmental analysis
A total of 21 of the 360 segments (5.8%; 12 patients times 30 segments=360) were within the left ventricular outflow tract or the segment could not be visualized on MRI scan. Of the remaining 339 segments, 81 (23.9%) segments had some areas of infarction. On the other hand, 50 of the 339 segments (14.7%) had abnormal wall motion. Infarction was observed in 81 segments, of which 46 (56.8%) had abnormal wall motion and 35 (43.2%) had normal wall motion. Among the 35 segments with infarction and normal wall motion, 33 (94.3%) had subendocardial infarction (the TEI was less than 50%). There were 17 segments with infarction that extended to less than 25% of the wall thickness, and all of them had normal wall motion. On the other hand, 11 segments had nearly transmural involvement (the TEI was more than 75%), of which 11 (100%) had abnormal wall motion.
Conversely, 50 of the 339 total segments had abnormal wall motion, of which 46 (92%) exhibited myocardial infarction and 4 (8%) had no such regions.
Figure 2 shows quantitative wall thickness for the TEI scores. Those segments having no infarction or an infarction of less that 25% had normal wall thickness, but segments with infarction of above 50% had dysfunctional wall motion.
Absolute wall thickening as the amount of the transmural extent of infarction (TEI). The mean wall thickening in segments with > 50% TEI is less than 10% (9.6%, 4.8%, respectively)
TEI according to initial ECG
The mean infarct size by ceMRI for the non ST-elevation group and ST-elevation group was 9.4±6.7% and 21.1±15.3%, respectively (p<0.05) (Figure 3A), but there was also considerable patient-to-patient variations observed (Table 1). Figure 3B shows the number of segments as the TEI in both groups. None of segments with nearly transmural involvement (TEI is more than 75%) were shown in the non ST-elevation group. In contrast, the segments with various amount of infarction were shown in the ST-elevation group. The majority of the segments with infarction had non-transmural involvement (87.5%, 70/81), even if the segments were in the ST-elevation group (76.1%, 35/46).
Comparison the mean infarct size by ceMRI (A) and number of segments as TEI (B) between non ST-elevation and ST-elevation AMI.
Infarct size
Figure 4 relates the peak CK-MB and Troponin-T values to infarct size on ceMRI. Infarct size as defined by ceMRI was strongly correlated with the peak CK-MB and Troponin-T values (r=0.96, p<0.001, r=0.91, p<0.001, respectively).
Relation between peak Creatine Kinase-MB (A) and Troponin-T (B) and infarct size by ceMRI (%LV).
DISCUSSION
We found that the increasing transmural extent of hyperenhancement on MRI was correlated with poor recovery of contractile function after revascularization. This finding would be expected based on the interpretation that hyperenhancement on ceMRI indicates myocardial infarction. Previous experimental studies have demonstrated excellent spatial correlation between the presence of Gd-DTPA hyperenhancement and regional myocardial necrosis on ex vivo imaging7). Fieno et al8) have reported that the size and shape of the hyperenhanced areas on ceMRI were identical to irreversible injury as defined by pathologic staining. Assuming that hyperenhancement indicates infarction, the greater amount of TEI in ST-elevation AMI patients compared to non ST-elevation AMI patients could be explained by the “wavefront phenomenon” of infarct progression beginning in the endocardium and growing toward the epicardium. The “wavefront phenomenon” could also elucidate our observation that the segment with nearly complete transmural infarction was not observed in non ST-elevation AMI patients. However, we know that electrocardiographic-pathologic correlations are far from perfect2). In an experimental study, considerable animal-to-animal variations for the transmural extent of necrosis were observed, even for those animals with identical occlusion times13). In our study, there were considerable person-to-person variations observed by ceMRI for the infarct size. It was interesting that the majority of segments with infarction had only non-transmural involvement and a significant number of segments exhibited a TEI between 25% and 75%. It may be related to the ability of ceMRI to delineate the transmural extent of viable and nonviable myocardium through its high spatial resolution capabilities. The presence of these segments emphasizes the fact that segmental viability, as defined by ceMRI, is not an “all-or-none” phenomenon. The intrinsically high spatial resolution of the technique seems to allow for the direct visualization of the transmural extent of necrosis and the residual viable tissue, which is not possible using any other existing technique16).
In a previous study, Kim et al14) have reported that the mean TEI was 10±7% in regions with improved contractility after revascularization, and 41%±14% in regions with no improvement in contractility. They also reported that 90% of the regions with 51% to 75% TEI before revascularization did not improve after revascularization. They suggested that the negative predictive accuracy for prediction of functional improvement was 100%, if a cut-off value of 75% TEI was chosen. Gerber et al17) have also showed that the magnitude of segmental function recovery decreased with the increased degrees of TEI, and function recovery was completely absent in those segments showing >75% TEI. This finding was similar to the results of our study that showed that 94.7% of the segments with >50% TEI and all the segments with >75% TEI had dysfunctional wall motion. These regions would be considered nonviable according to the wall motion improvement criteria, even though a sizable epicardial rim of viable tissue was still present. Furthermore, Wu et al18) have reported that nearly 90% of regions with infarction and normal contractility had only subendocardial infarction. This result is also comparable to our results. We found that 94.3% of segments with infarction and normal wall motion had subendocardial infarction and 100% of segments with small infarction (<25% TEI) had normal wall motion. Therefore, we suggest that functionally viable tissues can be identified by ceMRI before coronary revascularization. However, our finding that 4 segments without infarction had dysfunctional wall motion raises the question as to why those segments did not show the normal contractility. It has been shown that the recovery phase for stunned myocardium after myocardial infarction may take several weeks or even months19). Thus, recovery in those segments may require a longer time period after ischemic injury.
We found a strong correlation between infarct size, as defined by ceMRI, and the peak CK-MB and Troponin-T (Figure 4). Mahmarian et al20) showed the relationship between infarct size as quantified by plasma creative kinase-MB time-activity curves, to the size of the perfusion defects, as quantified by thallium-201 single-photon emission computed tomography (SPECT), in patients with AMI. Although enzymatic and scintigraphic estimates of infarct size have good correlation, the results of other studies21,22) have suggested that SPECT misses some small infarcts. One reason that infarcts might not be identified by SPECT is the technique’s fairly poor spatial resolution of about 10×10×10 mm full width half maximum23,24), and infarcts smaller than this size are difficult to detect. Wagner et al25) have reported that of the 181 segments with subendocardial infarction, 85 (47%) were not detected by SPECT. In our results, 6 patients with small infarction (less than 10% LV) were identified by ceMRI, and this technique has high spatial resolution of about 1.9×1.4×8.0 mm-ie, almost 60-fold greater than SPECT.
STUDY LIMITATIONS
The MRI sequence that was used in our study is susceptible to artifacts associated with patient movement or imperfect breath-holding, which can be erroneously interpreted as areas of hyperenhancement. In addition, the baseline ceMRI before revascularization was not assessed in the present study. Thus, definite conclusions on the functional recovery of dysfunctional segments deemed viable by ceMRI cannot be drawn from the present study. Others studies have shown that recovery of function after revascularization is related to TEI in patients with ischemic heart disease, with a gradual decrease in functional recovery paralleled by an increasing transmurality of the infarction, and functional recovery was completely absent in segments showing>75% TEI14,17). This finding is similar to the results of our study. Based of these results, one might speculate that the determination of contractile function after revascularization would be helpful to establish the relative importance of ceMRI to predict functionally viable segments, which is considered to be an important variable of outcome.
CONCLUSION
The data from this study demonstrate that TEI evaluated by ceMRI is inversely related to the contractility after revascularization in patients with AMI. Functionally nonviable tissue according to wall motion criteria can be identified by assessing the infarct size, as defined by ceMRI, before revascularization in ischemic heart disease with abnormal wall motion, even though there is a sizable epicardial rim of viable tissue present.
Irrespective of the initial ECG findings in patients with AMI, the transmural extent of the necrosis was variable. So TEI, as defined by ceMRI, would be a better predictor than the ECG findings for the prognosis of contractility.