The Effect of Dexamethasone on B cell Mass and Function in Partial Pancreatctomized Rats
Article information
Abstract
We have now examined islet mass and B-cell secretory function 19 days following a 40–50% pancreatectomy (Px). Plasma glucose and insulin values in Px were equal to those of sham-operated control rats both in the fed state and following an in traperitoneal glucose tolerance test. Glucose potentiation of arginine-induced insulin secretion remained fully preserved when assessed with the invitro perfused pancreas. On the other hand, 5 days of dexamethasone caused mild hyperglycemia in Px, but not in the control group. Moreover, in vitro insulin secretion from the dexamethasone-treated Px rats tended to be modestly lower than the dexamethasone-treated controls.
Islet mass returned to a value not significantly lower than that of shams, with a further 30% increase noted in both dexamethasone-treated groups. In contrast, pancreatic insulin content in both Px groups was only about 40% of comparable controls.
These data show almost complete islet regeneration within 3 weeks of the 40–50% pancreatectomy. Islet function, on the other hands, was characterized by limited reserve capacity which coexisted with and may have contributed to the development of mild hyperglycemia in the presence of dexamethasone-induced insulin resistance.
INTRODUCTION
A considerable body of experimental evidence has now accumulated which shows that several predictable events follow a reduction in B-cell mass which is sufficiently large to cause hyperglycemia. These include accelerated B-cell growth such that partial replenishment occurs, and the appearance of functional defects in the remaining B-cells.1) For instance, a 90% pancreatectomy in 5 week-old rats leads to a sustained rise in plasma glucose of about 40 mg/dl; at 8–12 weeks of age, B-cell mass is 42 % of control (instead of the expected 10%), and glucose induced insulin secretion is virtually absent while the response to arginine remains relatively preserved.2) Similar results have also been obtained in rats given streptozotocin as neonates which develop a slightly higher level of glycemia during adulthood.3–5)
On the other hand, little is known about what follows a reduction in B-cell mass which is not sufficiently large to cause overt hyperglycemia. Orland et al found only very mild changes in glucose tolerance when rats were studied up to 14 weeks after an approximate 50% pancreatecomy.6) We therefore determined islet mass and function 3 weeks following a 40–50% pancreatectomy in 5 week-old rats. Also, a 5 day course of dexamethasone was given to see if the ability to compensate for an increased demand in insulin output was altered by the partial pancreatectomy. Intraperitoneal glucose tolerance test or using the in vitro isolated perfused rat pancreas.
MATERIALS AND METHODS
1. 40% Pancreatectomy (Px)
Male CD rats weighing 90–120 grams (Charles River, Wilmington, Massachusett) were anesthetized with intraperitoneal (IP) amobarbital sodium 100 mg/kg and either if needed. A midline abdominal incision was made and the splenic portion of the pancreas mobilized by partially breaking mesenteric connections to the stomach, small bowel, and retroperitoneum. Pancreatic tissue was then removed according to the method of Folgia7) by gently scrapping it away with cotton applicator being careful to leave major blood vessels intact. The portion excised was that bordered by the spleen and fundus of the stomach up to the junction with the antrum where the pancreas begins to narrow; it comprised 40–50% of total pancreatic weight (data not shown). Control rats (shams) underwent laparotomy and mobilization of the splenic lobe with gentle rubbing of it between the fingers. Postoperatively all rats received standard laboratory chow ab libitum.
Two weeks later, dexamethasone sodium phosphate 0.125 mg/kg (Elkins-Simm, Cherry Hill, New Jersey) or sterile saline was given daily intramusculary for 5 days (day 14–18 at 9 AM). Body weight was measured before the first and last injections; blood for plasma glucose and insulin measurements was obtained after tail snipping by collection 0.6 cc in a heparin-coated 6×50 mm glass tube which was kept on ice until centrifugation and storage of the plasma at −20°C. Twenty-four hours after the last injection (day 19), rats were studied with either an intraperitoneal glucose tolerance test or using the in vitro isolated perfused rat pancreas.
2. Intraperitoneal Glucose Tolerance Test (IPGTT)
Following an overnight fast, blood for plasma glucose and insulin was obtained as described above, and then 20% glucose (2 grams/kg IP) was given with the sampling repeated 30 and 50 minutes later. The animals were then sacrificed by decapitation and their pancreases removed for quantitative morphometrics.
3. Quantitative Morphometrics
Following the IPGTT and sacrifice, pancreases were excised and cleared of fat and lympth nodes; shams were divided into two portions while Px were left whole. Each was weighed, placed in Bouin’s fixative overnight, and embedded in paraffin. Sections (5–7 μm) were then stained with hematoxylin, and the relative volume of islets determined using point-counting morphometries.8) a minimum of 5000 points in 108 fields (systematically chosen throughout the tissue using the markings of the stage micrometer) were counted in each block with the relative islet volume being the number of intercepts over islet tissue divided by the number of intercepts over pancreatic tissue. Assuming that volume and mass are synonymous, the absolute mass of islet tissue was then calculated as the relative islet volume times pancreatic weight.
4. In vitro Isolated Perfused Pancreas
This technique has been described previously.9) The rats were anesthetized with amobarbital sodium 100 mg/kg IP. The perfusate was a modified Krebs-Ringer bicarbonate buffer which contained 4% dextran (D-4751, Sigma, St. Louis, Missouri), 2mM calcium, 1.2 mM magnesium, and 0.2% bovine serum albumin fraction V (Sigma). It was bubbled for 20 minuted with 95% O2 and 5% CO2, and then 2.8 mM glucose was added, the pH was adjusted to 7.4, and it was stored in a reservoir maintained at 38°C by water bath; 10 mM arginine was added to perfusate in a second reservoir. The higher glucose concentration (16.7 mM) was produced with a sidearm syrings driven by syringe pump which added 0.3 cc to the usual flow rate of 3.0 cc/min. Prior to delivery, the perfusate passed through and artificial lung in order to insure adequate oxygenation.10) Following cannulation of the aorta and portal vein, the body cavity was covered with gauze moistened with saline, and the rat was placed under a heat lamp with the temperature constantly monitored and maintained at 30–39°C. The baseline perfusate (2.8 mM glucose) was delivered for 20 minutes, and then 30 second samples were collected according to the protocol shown at the top of Figure 2 in chilled tubes containing 4 mg EDTA which were then kept on ice pending storage at −20°C.
Effects of glucose and 10 mM arginine on insulin secretion in rats 19 days following a 40–50% pancreatectomy asessed using the in vitro isolated perfused pancreas. They had received dexamethasone or saline during days.
5. Pancreatic Insulin Content
Following study with the in vitro isolated perfused pancreas, pancreases were removed, cleared of lymph nodes, blotted, weighed, and stored at −20°C in acid ethanol. Later, on a single day, they were homogenized with an Ultra-Turrax SDT (Tekmar, Cincinnati, Ohio), diluted to a volume of 8 cc, and refrozen pending assay.
6. Analytical Methods
Plasma glucose was measured with a Beckman glucose Analyser II (Beckman, Brea, Califorina). Insulin concentration was determined by radioimmunoassay using charcoal separation11) and rat insulin standards (supplied by Eli Lilly, Indianapolis, Indians).
7. Data Presentation and Statistical Significance
The data in the figures and tables are expressed as mean ± standard error. Statistical significance was determined using the unpaired two-tailed Student’s test.12)
RESULTS
1. Characteristics of the Animal Groups
There was no difference in body weight, plasma glucose, or plasma insulin values in Px and sham rats at the end of the saline treatment (Table 1). Similar results were also obtained at the beginning of the treatment period (day 14, data not shown).
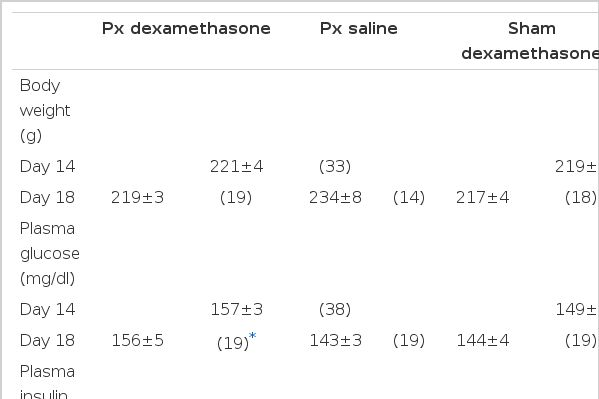
Rat Group Characteristics
Dexamethasone caused Px and sham rats to be lighter than their saline counterparts primarily because of failure to gain weight during the 5 day treatment period; the saline groups gained approximately 4 grams per day. Dexamethasone caused mild hyperglycemia only in Px. This was associated with a plasma insulin value that was lower than that in the shams although the difference did not quite reach statistical significance (2.70±0.23 versus 3.63±0.41 ng/ml, 2p<0.07).
2. Pancreatic Insulin Content
Insulin contents are shown in Table 2. It was reduced 60% in Px-saline rats compared to shams given saline. Dexamethasone had no significant effect on either result.
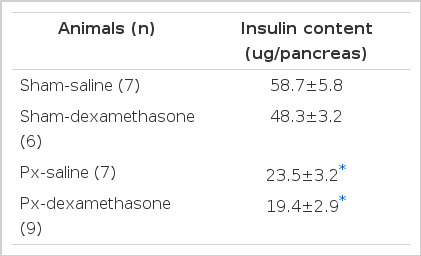
Pancreatic Insulin Content
3. Pancreatic Weight and Islet Mass
At the end of the study (day 19), the Px remnant still weighed considerably less than the whole pancreas in shams (0.546 ± 0.066 versus 0.837 ± 0.030 g, 2p<0.005). In contrast, islet mass had returned to a value which was not statistically different from controls although in absolute terms it was still reduced about 20% (0.615 ± 0.65 versus 0.734 ± 0.042 mg).
Dexamethasone caused relative islet volume in both Px and shams to increase, but interpretation of this finding is made difficult by the slightly lowered pancreatic weight (Table 3). Nonetheless, absolute islet mass also rose 30% in both treated groups although the increase narrowly missed statistical significance in shams due in part to variability within the group (4 animals did not have values greater than the mean of controls while 3 were markedly increased). Variability was also present in Px with 3 animals given dexamethasone having raised islet mass while 2 did not. Morphologically, many markedly enlarged islet were found in both dexamethasone-treated groups as were a seemingly increased number of small ones.

Pancrealic Weights, Relative Islet Volume and Absolute Islet Mass
4. IPGTT
Plasma glucose values both pre and post glucose were the same in all groups (Fig. 1). Dexamethasone caused the insulin response to the glucose challenge to be exaggerated in both Px and shams; the levels attained at all time points were equal in the two groups. The plasma insulin values in the 2 saline groups were also equal.
Plasma glucose and insulin concentrations during an intraperitoneal glucose tolerance test performed in rats 19 days following a 40–50% pancreatectomy. They had received dexamethasone or saline during days 14–18.
5. Effect of Glucose on in Vitro Arginine-Induced Insulin Secretion
The protocol and results are shown in Fig. 2. The baseline perfusate contained 2.8 mM glucose and then 10 mM arginine was added. After reequilibration at 2.8 mM glucose, the glucose concentration was increased to 16.7 mM and arginine was again added.
As expected, the shams given saline had a much larger insulin response to arginine at the high glucose background with the mean insulin concentration being 14 times that at 2.8 mM (Table 3). The results in the Px-saline group were very similar; the mean insulin concentration attained with 16.7 mM glucose alone was only half that of shams, but the values were not significantly different (Table 3).
In shams, dexamethasone caused arginine induced secretion to be considerably increased at both glucose concentrations. In Px. the mean insulin concentration attained with arginine at 2.8 glucose was 4 times that in the Px-saline group. On the other hand, the results at the high glucose background were much more variable so that it was not clear whether this response was also increased (29.4 ± 7.11 Px-dexamethasone versus 20.4 ± 3.24 ng/ml Px-saline).
DISCUSSION
The results of this study show that no functional abnormalities were found in the saline-treated Px rats. Basal plasma glucose and insulin levels were unchanged as was glucose tolerance following the intraperitoneal glucose challenge. Furthermore, in vivo and in vitro insulin secretory responses remained fully intact when viewed in both qualitative and quantitative terms.
One aspect of this compensation seems to be regeneration of much of the lost islet tissue since islet mass was reduced only 16% in the Px-saline group (instead of the expected 60%). In contrast, pancreatic weight was only 65% of that in shams so that regeneration of the acinar tissue was considerable less. Although we did not quantify B and non B-cell mass separately because of technical, reasons, it is likely that both increased so that the B to non B-cell remained unaltered since this is what we observed following a 90% pancreatectomy.2)
The finding of islet-cell regeneration is particularly interesting, for it occurred without a measurable change in glucose homeostasis. We have proposed that the growth in islet mass which follows in 90% pancreatectomy is secondary to the hyperglycemia which develops.1) This is based on the fact that glucose stimulates B-cell replication in vitro,13) and that B-cell mass increases when normal rats are made markedly hyperglycemic for 96 hours with glucose infusions.14) The present results, however, suggest that other factors must also influence islet cell mass following an incomplete pancreatectomy. It has recently been suggested that functional demand on B-cells may be an important determinant of their rate of replication,15) our findings seem compatible with this concept, for insulin release per functioning B-cell in Px presumably had to rise in order to maintain euglycemia.
The results obtained with the perfused pancreas showed that the effect of a high glucose concentration to potentiate arginine-induced insulin secretion remained fully intact in the Px-saline rats. It has been suggested that this response rises and falls with B-cell mass16–17) so that our results are not unexpected given the islet-cell regeneration. On the other hand, the insulin response attained with 16.7 mM glucose alone seemed to be lower although no statistical difference was found. The chosen protocol, however, is not the optimum way to test glucose-induced insulin secretion, for arginine is known to inhibit insulin responses which follow its administration,18) and it is not known if this might have contributed in some way to these results.
In contrast to the saline-treated groups, differences were found between Px and sham rats when dexamethasone was given. Dexamethasone inhibits insulin sensitivity19,20) there by causing insulin levels to rise and a compensatory increase in B-cell mass.21) It is interesting that the Px group became hyperglycemic while shams did not. This was associated with a plasma insulin level that was lower than shams in absolute terms although the difference narrowly missed statistical significance. Subtle differences in insulin secretion were also observed with the perfused pancrease. Dexamethasone caused arginine-induced insulin secretion at both glucose concentrations to increase in shams. In Px on the other hand, a rise at the high glucose background was much less distinct. Taken together, the Px rats seem to have a reduced ability to meet insulin requirements when they increase which results in greater susceptibility to develop hyperglycemia.
An interesting finding which presently remains unexplained is the marked disparity between islet mass and pancreatic insulin content which is present in both Px groups. While it is unlikely that reduced insulin stores are directly responsible for the limited secretory capacity (insulin content is not lowered by dexamethasone in Px), this finding may serve as a predictor of a reduced reserve capacity. It is clear from these results that pancreatic insulin content is not a useful indirect assessment of B-cell mass.
In summary, regeneration of islet tissue occurred following a 40–50% pancreatectomy such that islet mass 3 weeks later was reduced only 16%. Under ordinary circumstances,1) glucose homeostasis and insuline secretory responses were unaffected by the partial pancreatectomy so that no functional differences were noted between Px and sham rats. However,2) when given dexamethasone, Px became hyperglycemic while shams did not suggesting greater susceptibility to develop hyperglycemia when the demand for insulin output rises.
These results may help further our understanding of non-insulin-dependent diabetes mellitus (NIDDM). A substantial body of information has now accumulated which suggests that mild chronic hyperglycemia is an important early step in the pathogenesis of the B-cell secretory defects and insulin resistance which characterize this disease.1,22,23) The majority of morphological studies which have attempted to quantify B-cell mass in NIDDM have found a reduction of approximately 40%.24–26) Moreover, pancreatic insulin content is also lowered by approximately half.27–29 It seems reasonable to hypothesize that individuals at high risk for NIDDM have similar decreases which ordinarily are without functional consequence, but when insulin requirements rise such as with obesity or inactivity, they are then more susceptible to develop abnormal glucose tolerance, thereby beginning a viscious cycle that often results in sustained hyperglycemia.
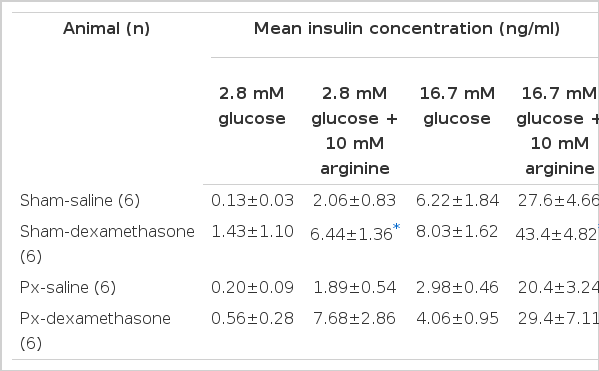
Effect of Change in Perfusate Glucose Concentration on in Vitro Arginine-stimulated Insulin Secretion