Production of Interleukin-2 (IL-2) and Expression of IL-2 Receptor in Patients with IgA Nephropathy
Article information
Abstract
Background
IL-2 production has been measured in several disease including type I diabetes mellitus9), systemic lupus erythematosus10,11), acquired immunodeficiency syndrome12,13) and active pulmonary sarcoidosis14) and its pathogenetic role was suggested. In IgA nephropathy, altered T cell subsets were reported to be associated with increased synthesis of IgA15–19). The altered IL-2 production and the expression of IL-2 receptor might be involved in the pathogenesis of IgA nephropathy20–23).
Methods
To investigate the role of T cell mediated immunity in the pathogenesis of IgA nephropathy, the immune parameters such as T cell subsets, NK cell activity, interleukih-2 (IL-2) production and IL-2 receptor expression on peripheral blood mononuclear cells (PBMC) were measured before and/or after phytohemagglutinin (PHA) stimulation in 15 patients with IgA nephropathy. Age and sex matched 15 healthy controls and the correlations between the IL-2 production and immune parameters were evaluated.
Results
The mean percentages of T helper/inducer cells (CD4), T suppressor/cytotoxic cells (CD8) end the CD4/CD8 ratio of the patients were not different from those of controls and the proportions of CD8 CD11b cell in the patients (21.0±3.6%) were significantly lower than those in controls (30.5±5.3%) (p<0.005). The production of IL-2 by fresh PBMC of both patients and controls was in undetectable ranges. The production of IL-2 by PHA stimulated PBMC of patients was significantly higher than that of controls (140.03±43.2 U/ml vs 106.5±42.1 U/ml, p<0.05). The proportions of lymphocytes expressing the IL-2 receptor (CD25) before the stimulation with PHA in patients were 1.22±1.00 percents and were not different from those in controls (1.12±0.78 percents). The correlations between the production of IL-2 and the concentrations of serum IgA, the degrees of histologic alterations and the proportions of CD8 and CD8CD11b cells were not significant. There was a weak tendency of a positive correlation (p<0.1) between the production of IL-2 and the proportions of CD4 cells, and the CD4/CD8 ratio showed a significant correlation with the production of IL-2 (p<0.05). After PHA stimulation, the mean percentages of lymphocytes expressing the IL-2 receptors in patients were increased to 47.6±8.9 percents which is higher than those (40.4±9.9%) in controls (p<0.05). The NK cell activity of the patients was higher than that of controls (75.6±19.6% vs 56.1±16.2%, p<0.005), and was well correlated with the production of IL-2 by PBMC (r = 0.89, p<0.05).
Conclusions
It seemed that patients with IgA nephropathy have an 'latent' cellular immunoregulatory dysfunciton that becomes apparent on the stimulation of extrinsic antigens or mitogens.
INTRODUCTION
Although the immunopathogenesis of IgA nephropathy is not completely defined, it is suggested that immunoregulatory dysfunction plays an important role in the pathogenesis of IgA nephropathy1–5). Recent studies also suggest the association between the disordered immunoregulation of T cell and the disease activity of IgA nephropathy6–8).
IL-2 production has been measured in several diseases including type I diabetes mellitus9), systemic lupus erythematosus10,11), acquired immunodeficiency syndrome12,13) and active pulmonary sarcoidosis14) and its pathogenetic role was suggested. In IgA nephropathy, altered T cell subsets were reported to be associated with increased synthesis of IgA15–19). The altered IL-2 production and the expression of IL-2 receptor might be involved in the pathogenesis of IgA nephropathy20–23).
To investigate the role of T cell mediated immunity in the pathogenesis of IgA nephropathy, the immune parameters such as T cell subsets, NK cell activity, interleukin-2 (IL-2) production and IL-2 receptor expression on PBMC were measured before and/or after PHA stimulation in patients with IgA nephropathy.
MATERIALS AND METHODS
1. Patients
Fifteen patients with primary IgA nephropathy were studied. The clinical and laboratory characteristics of the patients were shown in Table 1. The diagnosis of IgA nephropathy was based on the presence of predominant mesangial IgA deposits and mesangial and paramesangial electron-dense deposits in renal biopsy specimens51). Patients with the clinical and laboratory evidences of hepatic disease, systemic lupus erythematosus, Henoch-Schoenlein nephritis and other systemic diseases were excluded in this study. No patient had renal insufficiency or nephrotic syndrome and all patients were in clinically quiescent state without fever, gross hematuria and upper respiratory or gastrointestinal illness. No patient had infection and was on corticosteroid or immunosuppressive treatment within at least one month of entry into the study.

Clinical and Laboratory Characteristics of Patients with IgA Nephropathy
Medical doctors and nurses, matched for age and sex with the patients with IgA nephropathy, were used as healthy controls.
Pathologic changes of renal biopsy specimen were calculated by the semiquantitative method proposed by Kobayashi et al24). Seven parameters of mesangial hypercellularity, mesangial sclerosis, interstitial fibrosis, tubular atrophy, small crescent, tuft adhesion and global sclerosis were graded from 0 to 3. Each grade of the first 4 parameters was determined according to the intensity of the lesion and that of the other 3 parameters was determined as follows; Grade 3 was defined as the presence of more than 3 altered glomeruli per 10 glomeruli and grade 2, 1, and 0 were defined as the presence of 2, 1, and no altered glomeruli respectively.
2. Separation and Culture of Lymphocytes
Separation of lymphocytes was done by Ficoll-Hypaque gradient separation method of Boyum25). Heparinized venous blood was diluted with an equal volume of phosphate buffered saline (PBS) pH 7.4 and layered over a Ficoll-Hypaque density gradient. After centrifugation, the interface layer containing lymphocytes was washed thrice in PBS and suspended at a concentration of 5×10⁶ cells/ml in complete culture medium consisting of RPMI 1640 (GIBCO, NY, USA) supplemented with 2% human AB type serum, 2 mM L-glutamine, 100 units/ml penicillin, 100 ug/ml streptomycin and 0. 25 ug/ml fungizone.
Lymphocytes culture was done by the microculture technique26). Briefly, the lymphocytes were cultured with purified phytohemagglutinin (CSL, Melbourne, Australia) 10 ug/ml at 37°C in 5% CO2 in air for 18 hours.
3. T Lymphocyte Subsets
Assay for the lymphocyte subsets was done by the method of indirect immunofluorescence (IF) using monoclonal antibodies (Becton dickinson, CA, USA)27). 100 ul of the lymphocyte suspension adjusted to 5×10⁶ cells/ml were placed in plastic tubes (Costar 2022, MA, USA) and incubated with 20 ul of anti-leu-2a, anti-leu-3a, and anti-leu-4 for 30 minutes at 4°C. After incubation, the cells were washed thrice in PBS and labeled with 100 ul of fluorescein isothiocyanate (FITC)-conjugated goat anti-mouse IgG (Becton Dickinson, CA, USA). The cells were then incubated for 30 minutes at 4°C and washed in PBS. 100 ul of mounting medium (PBS, pH 7.4, containing 30% glycerol) were added to cell suspension and one drop was examined by a fluorescence microscope (Olympus, type BH-2, Japan).
Subsets of CD8CD11b cells were determined by direct IF after double IF staining. 100 ul of lymphocyte suspension was incubated for 30 minutes at 4°C with 10 ul of FITC-conjugated anti-leu-2a (Becton Dickinson, CA, USA) and washed thrice in PBS. The cells were then incubated for 30 minutes at 4°C with 20 ul of phycoerythrin-conjugated anti-leu-15 (Becton Dickinson, CA, USA) and washed thrice in PBS. After that, the cells were resuspended in mounting medium and one drop was examined by a fluorescence microscope.
4. IL-2 Receptor on Lymphocyte
Lymphocytes expressing IL-2 receptor were identified by indirect IF using monoclonal antibody of anti-CD25 (Becton Dickinson, CA, USA) with the similar methods of analyzing T lymphocytes subsets.
5. Natural Killer Cell (NK cell) Activity
NK cell activity was assayed by a chromium-release method of Jondal et al28). K562 cells derived from a patient with chronic myeloid leukemia were used as target cells.
Target cells were suspended at a concentration of 5×10⁶ cells/ml in complete culture medium and labeled with 100 uCi of Na2 51Cr O4 (New England Nuclear, MA, USA) added to the 0.5 ml of cell suspension. After incubation for 90 minutes at 37°C in 5% CO2 in air and washing thrice, 10 ul of cell suspension adjusted to 5×10⁶ cells/ml in complete culture medium were placed into 96-well micro-plate (Costar 3799, MA, USA). 20 ul of effector peripheral blood lymphocytes adjusted to the concentration of 1×10⁶ cells/ml were added to target cells in triplicate with the ratio of lymphocyte to target cell of 40. Target cells were incubated in complete culture medium as controls for spontaneous release (SR) and maximum release (MR) was measured after the addition of 1% Triton X-100 solutions. Samples were counted in a gamma-counter (Gamma 5500; Beckman, CA, USA). Percent cytotoxicity was calculated with the following formula;
6. IL-2 Production
Peripheral blood lymphocytes suspended at the concentration of 5×10⁶ cells/ml in complete culture medium were stimulated with 10 ul/ml of PHA (CSL, Melbourne, Australia) at 37°C in 5% CO2 in air for 18 hours, when supernatants were harvested after centrifugation for 10 minutes at 400×G. IL-2 activity in supernatants was assayed by its ability to stimulate the incorporation of 3[H] thymidine into IL-2 dependent cells29).
100 ul of test samples were placed in 96-well microplates followed by serial twofold dilutions with complete culture medium supplemented with heat inactivated 5% fetal calf serum. To these, 100 ul/well of 1×10⁵ CTLL cells (an IL-2 dependent murine line of cytotoxic T lymphocytes; Osaka, Japan) were added and incubated for 24 hours at 37°C in 5% CO2 in air. 0.5 uCi 3[H] thymidine (New England Nuclear, MA, USA) was added to each well and cultured for 4 hours. The cells were harvested with a cell culture harvester (Adaps, MA, USA) onto glass wool filters (Gelman 61638, MI USA). 3[H]-thymidine incorporation into DNA of CTLL cells was counted on a β-scintillation counter (Beckman 8000, Irvine, CA, USA).
In every assay, the uptake of 3[H] thymidine by CTLL cells in response to the tested samples was compared to their response to standard IL-2 preparations (Collaborative Research Co, MA, USA) by probit analysis. Results are expressed as units of IL-2/ml (U/ml). 1 unit was defined as the amount of IL-2 to exhibit the 50% of maximum amount of 3[H] thymidine uptake.
7. Statistical Analysis
The results are expressed as mean±standard deviation. Students t-test and regression analysis were used to compare the means of two groups. AP-value less 0.05 is interpreted to be significant.
RESULTS
1. T lymphocyte Subsets (Table 2)
T cell Subsets in Patients with IgA Nephropathy and Healthy Controls
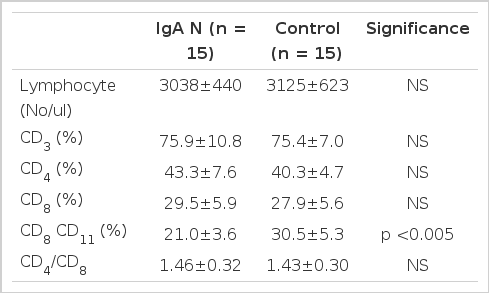
The absolute lymphocyte counts of the patients with IgA nephropathy were 3038±440/ul and were not different from those of healthy controls (3125±623/ul). The mean percentages of CD3 cell, CD4 cells, CD8 cell in peripheral blood lymphocytes of the patients were not different from those of healthy controls. The ratio of CD4/CD8 of the patients was 1.46±0.32 and was not different from those of healthy controls (1.43±0.30). However, the proportions of CD8 CD11b cells with the suppressive activity on B cell in patients was significantly lower than those in healthy controls (p<0.005).
2. IL-2 Production
The production of IL-2 by fresh peripheral blood mononuclear cells (PBMC) before PHA stimulation in the patients and the healthy controls was in undetectable ranges. After PHA stimulation, IL-2 production was increased to the level of 140.3±43.2 U/ml in patients, which was significantly higher than that in controls of 106.5±42.1 U/ml (p<0.05, Table 3). When the patients were divided into 2 groups, according to the level of mean CD4/CD8 ratio of the patients (=1.46), the group of patients with higher CD4/CD8 ratio (≥ 1.46) produced more IL-2 compared with that with lower CD4/CD8 ratio (<1.46) and healthy controls (p<0.05, Table 3).

IL-2 Production by PHA-Stimulated PBMC According to the Level of CD4/CD8 Ratio in Patients with IgA Nephropathy
3. IL-2 Receptor Expression
The proportions of lymphocytes expressing the IL-2 receptor in patients were 1.22±1.00 percents before PHA stimulation and were not different from those in healthy controls of 1.12±0.78 percents. After PHA stimulation, the mean percentages of lymphocytes expressing the IL-2 receptors were increased to the level of 47.6±8.9%, which were significantly higher than those of healthy controls of 40.4±9.9% (p<0.05, Table 4).
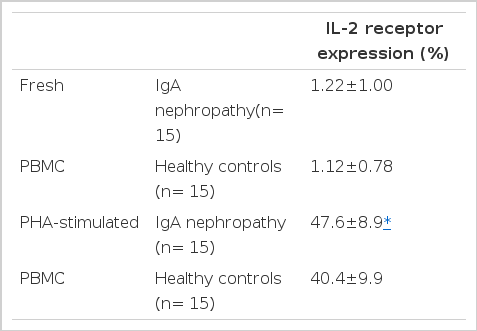
IL-2 Receptor Expression on the Surface of Fresh and PHA-Stimulated PBMC in Patients with IgA Nephropathy
4. NK Cell Activity
The NK cell activity of the patients was significantly higher than that of controls (75.6±19.6% vs 56.1±16.2%, p<0.005, Table 5). It was well correlated with the production of IL-2 by PHA-stimulated PBMC (r = 0.89, p<0.05, Fig. 1).

NK Cell Activity in Patients with IgA Nephropathy and Healthy Controls

Correlation between PHA-stimulated IL-2 production and NK cell activity
5. Correlation between IL-2 production and immune parameters (Table 6)
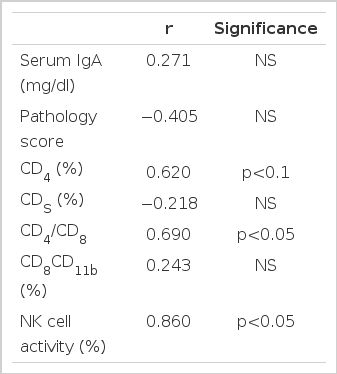
Correlation Coefficient between PHA-Stimulated IL-2 Production and other Parameters
The correlation between the production of IL-2 and the concentration of serum IgA, the degrees of histologic alterations, as well as the proportions of CD8 and CD8CD11b cells was not significant. The relationship between the production of IL-2 and the proportions of CD4 cells showed a weak tendency of a positive correlation (p<0.1) and the CD4/CD8 ratio showed a significant correlation with the production of IL-2 (p<0.05).
DISCUSSION
Although the pathogenesis of IgA nephropathy is not well defined, it is suggested that immunoregulatory dysfunciton plays a major role1–5). In IgA nephropathy, many evidences of immunological involvements such as the elevated level of serum IgA30) and the circulating IgA immune complexes31–34), the deposition of IgA in dermal capillaries, liver, lung, and gut35,52), and the recurrence of original disease in renal allograft36) were demonstrated.
Studies on the T cell subsets in peripheral blood of the patients with IgA nephropathy so far have contradictory results. Some of them showed the increased percentages of CD4 cells and CD4/CD8 ratio as well as the reduced percentages of CD8 cells2,16,19). However no abnormalities in the percentages of CD4 cells, CD8 cell and the CD4/CD8 ratio were observed by others8,37). In this study, the mean percentages of CD4 cells, CD8 cells and the CD4/CD8 ratio in patients with IgA nephropathy were not different from those in healthy controls. Because our patients were all in a clinically silent phase of the disease, these results are consistent with the previous reports that an activation of the T cell subsets is not observed in the quiescent phase of the disease but becomes apparent during clinical exacerbation6,7,38).
In this study, the proportions of CD8CD11b cells in patients with IgA nephropathy are significantly lower than those in healthy controls. This result is in accordance with that of Schena et al39), and raises the possibility that defective immune suppression caused by the decreased activity of CD8CD11b cells, which is known to have the suppressive activity on B cells, may be important in the pathogenesis of IgA nephropathy. However the reason why the suppressive activity of CD8CD11b cells is confined to the production of IgA is not certain in this study.
In IgA nephropathy, there is a close temporal relationship between its onset and upper respiratory tract infection or gastroenteritis and a significant rise in antibody titer to specific infectious agents such as herpes virus, influenza virus, mycoplasma and gut flora was found40). In this aspect, the measurement of the activity of natural killer (NK) cells that are known to play an important role in immune surveillance mechanisms to provide resistance against viral infections41) in IgA nephropathy may be somewhat interesting to us. In this study, the NK cell activity of the patients with IgA nephropathy was significantly higher than that of healthy controls and was well correlated with the production of IL-2 by PBMC. Because it is known that IL-2 can enhance the proliferation42,43) and the cytolytic activity of NK cells44–46), increased production of IL-2 may be associated with elevation of NK cell activity. However our patients were in a clinically quiescent phase with undetectable IL-2 production without PHA stimulation. The causative factors of the increased NK cell activity in our patients may be explained by the remnant effect of previously elevated IL-2 production in the phase of clinical exacerbation, the residual effects of previously elevated interferon, or other unknown substances that can increase the NK cell activity in IgA nephritic patients. The clinical significance of elevated NK cell activity in IgA nephropathy is uncertain and further study may be needed.
IL-2 is a protein with a molecular weight of 15,000 which has an autocrine function for the T cells and the various immunoregulatory functions47,48). The function of IL-2 as a T cell growth factor20) is performed by induction of and interaction with IL-2 receptors22). Interaction of IL-2 with its receptor leads to the proliferation and differentiation of activated T lymphocytes into effector cells23). IL-2 also stimulates the synthesis of immunoglobulin by B cells with the involvement in the early stage of T cell dependent B cell activation and the late stage of B cell differentiation49,50). In these ways, IL-2 is involved iin the immunoregulatory function and may play some roles in the pathogenesis of immunological disorders.
IL-2 production by PBMC has been measured in several immune-mediated diseases including type 1 diabetes mellitus9), systemic lupus erythematosus10,11), acquired immunodeficiency syndrome12,13) and active pulmonary sarcoidosis14). In IgA nephropathy, only Schena et al39) have investigated the production of IL-2 by PBMC. They observed the spontaneous production of IL-2 by PBMCs and increased expression of IL-2 receptor on the surface of PBMCs and proposed that these might be responsible for the increased activity of helper T cells. They also showed the significant IL-2 production in patients with active phase of the disease and with renal insufficiency. As the production of IL-2 by fresh PBMC in our patients with IgA nephropathy was in undetectable ranges, we didn't confirm the spontaneous production of IL-2 in IgA nephritic patients. The state of clinical quiescence in our patients may account for the result. The results of the undetectable production of IL-2 before PHA stimulation in both IgA nephritic patients and healthy controls and more marked production of IL-2 after PHA stimulation in patients than in healthy controls in this study suggest that immunoregulatory dysfunction may become evident only after the stimulation with mitogens and/or extrinsic antigens.
Lai et al8) observed that the percentages of CD4 and CD8 lymphocytes, CD4/CD8 ratio did not differ between IgA nephritic patients and healthy controls in fresh isolated, unstimulated lymphocytes. Following pokeweed mitogen stimulation, individual T cell subsets bearing IL-2 receptors were distinctly different between IgA nephritic patients and healthy controls, that is, IgA nephritic patients had increased activated CD4 lymphocytes (with IL-2 receptor) and reduced activated CD8 lymphocytes. They proposed a defective immunoregulation in IgA nephropathy with enhanced T-helper/inducer and reduced T-suppressor/cytotoxic activity when stimulated with mitogen.
In this study, the proportions of lymphocytes expressing the IL-2 receptor before PHA stimulation were low in both the patients with IgA nephropathy and the healthy controls. After PHA stimulation, lymphocytes expressing the IL-2 receptor were more increased in IgA nephritic patients than in healthy controls. Although subsets of lymphocytes expressing IL-2 receptor were not analyzed in this study, the results that lymphocytes expressing the IL-2 receptors after PHA stimulation in patients with IgA nephropathy were more than those in healthy controls, as was the results of IL-2 production, potentiate the suggestion that immunoregulatory dysfunction may become apparent only after stimulation with mitogens. Altered immune parameters such as IL-2 production and IL-2 receptor expression after mitogen stimulation may play important roles in the pathogenesis of IgA nephropathy. Finally, our results that the mitogen stimulated production of IL-2 was correlated well with the ratio of CD4/CD8 and that the proportions of CD8 CD11b cells with the suppressive activity on B cells was significantly decreased in patients with IgA nephropathy suggest that altered activity of T cell subsets may be associated with the mitogen stimulated overproduction of IL-2 in IgA nephropathy.