Heterogeneous Changes of Serum Potassium Levels in NIDDM Patients on Oral Glucose Load
Article information
Abstract
Ten noninsulin dependent diabetic patients (NIDDM) without baseline hyperkalemia and with normal aldosterone levels when given 100 g of glucose orally revealed heterogeneous responses in serum potassium changes. Six diabetics had paradoxical increases in serum potassium levels averaged 0.44 mEq/L (range, 0.1 to 1.1 mEq/L) and were accompanied by increases in plasma aldosterone levels. On the contrary, four other noninsulin dependent diabetics and four nondiabetic control subjects had gradual decreases in serum potassium levels with simultaneous decreases in plasma aldosterone levels. These rises and falls in serum potassium concentrations coincided with changes in serum osmolality related mostly to the degree of increases in serum glucose following oral glucose administration. pH of venous blood didn’t show any relevant and significant changes with changes of serum potassium levels following oral glucose load. This finding suggests that osmotic mechanisms with various degree of well known abnormal insulin secretion and resistance to insulin action in target tissues in NIDDM patients may account for these heterogeneous responses in serum potassium changes after glucose load, and normal aldosterone levels may not be sufficient to prevent glucose induced increases in serum potassium in NIDDM patients.
INTRODUCTIONS
Hypertonic glucose administration given to normal subjects ordinarily produces hypokalemia mediated by insulin, which counteracts the tendency of hypertonicity to draw potassium from intracellular to the extracellular fluid compartment1–4). Aldosterone also appears to play a part in this internal potassium balance to affect the transcellular distribution of potassium5). It has been reported by several studies that increases in blood glucose levels after acute oral or intravenous glucose loading in patients with diabetes mellitus are sometimes followed by increased blood potassium levels6–11). However, the reasons why it occurs, magnitude, frequency, and clinical importance of acute glucose load induced increments of serum potassium levels are still unknown. Also, most of these diabetic subjects of previous reports were insulin deprived patients, i.e, IDDM, with selective hypoaldosteronism as well as with baseline hyperkalemia or with, at least, upper high range of serum potassium levels6–8). Therefore, this study was undertaken to evaluate the derangements of potassium homeostasis as well as to determine other factors such as pH to influence serum potassium levels after oral glucose loading in patients with noninsulin dependent diabetes mellitus (NIDDM, Type 2 DM), who had baseline normokalemia and normal aldosterone levels.
SUBJECTS AND METHODS
Ten NIDDM patients taking only oral hypoglycemic agents or controlled on diets and four nondiabetic control subjects participated in this study after informed consent. Besides diabetes mellitus, these patients had no evidence of other diseases including hypertension, renal insufficiency or proteinuria by history, physical examination, or laboratory testing. Oral hypoglycemic agents were withheld 3 days before the day of study, and otherwise, receiving their usual diets, all fasted overnight. The subjects remained supine from 10 AM to the end of the study at 1 PM. Starting at 11AM after a baseline period of 1 hr, they drank 100 g of glucose in 200 ml water and were observed for the next 2 h. Venous blood, taken via an indwelling catheter in antecubital vein containing heparin on line to prevent clotting and avoiding hemolysis in procedure of serum preparation right after collection of blood with extreme care if indicated, at 0 just before oral intake of glucose, 30, 60, 90, 120 min, was analyzed for serum potassium, sodium, and venous pH (by automated multiple analysis system using ion selective electrodes and glucose oxidase method, Nova profile 5), serum creatinine (by automated bichromatic analysis system, Hitachi 736–20), and serum osmolality by freezing point depression (Model 3D II, Advanced Instruments, INC., Massachusetts, U.S.A). Serum aldosterone level of all prepared and stored serums at −20°C was measured by radioimmunoassay (Kit from Abbott laboratory) at same time. Nondiabetic control subjects were designated as group 1. Diabetic subjects were divided in two groups according to mean values of changes of serum potassium levels from baselines throughout the study for 2 hours after oral glucose loading, i.e., group 2 and 3 with increases and decreases of it respectively. Differences between groups were evaluated using Student’s t tests. Results were expressed as mean±SE or mean±SD as appropriate.
RESULTS
1. General Information and Characteristics of Study Subjects
Ten noninsulin dependent diabetic patients, after the administration of 100 g of oral glucose, were divided into six patients with gradual paradoxical increases of mean values of changes from baseline serum potassium levels (group 2) unlike nondiabetic control subjects (group 1) and four patients with similar decreases of it (group 3) to four nondiabetic control subjects as shown in Table 1 and Fig. 1. Sex distribution of the study subjects revealed predominance in males, except equal numbers in group 3. Ages and known duration of NIDDM were similar between group 2 and 3, but ages of controls (group 1) were much younger.
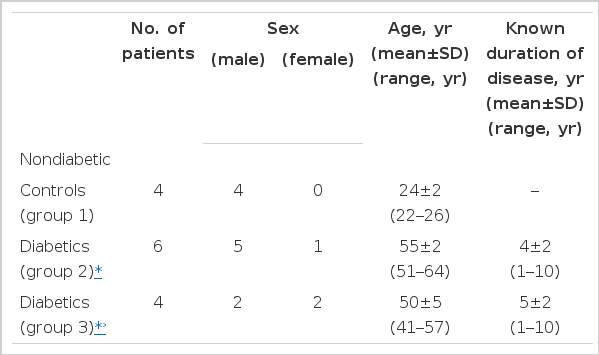
Age, Sex and Known Duration of Diseases of Study Subjects

Changes in mean values (±SE) of serum potassium on time course to controls (group 1) and to diabetics with (group 2) and without (group 3) paradoxical increases of it after glucose load. *p<0.01 compared to group 1 and 3
Basal blood levels in each subgroup were presented in Table 2. Mean serum potassium levels (mEq/L) were within normal ranges with the lowest in group 2 (3.7±0.1) followed by group 1 (3.8±0.1) and group 3 (3.9±0.1). Between group 1 and group 3 showing both similar decrease in serum potassium levels after oral glucose loading had no difference in all basal blood levels except fasting blood glucose (87±3 vs 187±32 mg/dL), serum osmolality (293±1 vs 301±1 mOsm/kg water) and aldosterone levels (94.5±7.7 vs 72.0±1.6 pg/ml) of no significant statistical differences. Also, between group 1 of nondiabetic controls and group 2 with paradoxical increase of serum potassium after oral glucose loading, there was no statistically significant difference despite some difference of mean basal levels in serum creatinine (1.1±0.2 vs 0.9±0.1 mg/dL), serum glucose (87±3 vs 157±41 mg/dL), and serum aldosterone (94.5±7.7 vs 75.5±6.9 pg/IL). However, in group 2, compared to group 3 of NIDDM patients, basal mean levels of serum potassium and serum osmolality were lower (3.7±0.1 vs 3.9±0.1 mEq/L, 288±2 vs 301±1 mOsm/kg water, respectively), and basal venous pH was higher with statistical significance (p<0.05). Basal mean serum aldosterone levels in group 2 and 3 of NIDDM subjects were within normal range (normal range of Japanese healthy subjects on supine position, 122±72 pg/ml) though lower than that of group 1.
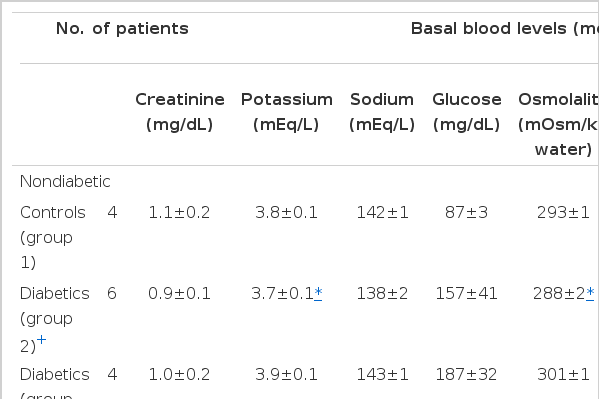
Characteristics of Study Subjects
2. Glucose Tolerance
As expected, the administration of 100 g of oral glucose to control nondiabetic subjects (group 1) was followed by a gradual decrease in serum potassium (Fig. 1). The fall reached a mean value of about 0.36 mEq/L (range, 0.1 to 0.57 mEq/L) at 90 and 120 minutes after glucose. As a result, three of four subjects became hypokalemic (serum potassium level, <3.5 mEq/L) from 3.71 to 3.14, from 3.5 to 3.2, and 3.91 to 3.44 mEq/L. Similar results were obtained in 4 NIDDM patients (group 3) with decreased mean value of about 0.34 mEq/L (range, 0.02 to 0.50 mEq/L) leading to hypokalemia in two of four patients from 3.9 to 3.4 and 3.86 to 3.44 mEq/L. However, in contrast, the remaining 6 NIDDM patients (group 2) were followed by a gradual paradoxical increase in serum potassium. The increases of serum potassium levels reached mean value of about 0.44 mEq/L (range, 0.1 to 1.1 mEq/L) at 120 minutes, when serum glucose levels had also reached stable ranges. Due to these small physiologic increments of serum potassium, the absolute serum potassium levels were within normal ranges (serum potassium level, <5.0 mEq/L) with maximum level up to 4.54 mEq/L from basal level of 3.44 mEq/L from basal level of 3.44 mEq/L in a patient. Changes in mean values of serum potassium levels at 90 and 120 minutes after oral glucose load were significantly higher in group 2 than group 1 and group 3 (p<0.01) (Fig. 1, 2).

Changes in mean values (±SE) of serum glucose on time course to controls (group 1) and to diabetics with (group 2) and without (group 3) paradoxical increases of serum potassium after glucose load. *p<0.01, **p<0.005 compared to group 1 and 3
Changes in mean values of blood glucose after glucose administration were significantly higher in group 2 than group 1 and group 3 at 60, 90 and 120 minutes (p<0.01 at 60 min., p<0.005 at 90 and 120 min.) (Fig. 2). There was a direct correlation between mean values of increments in serum glucose and those in serum osmolar changes (r=0.85, p<0.001) on 2 hours time course as well as between mean values of increments in serum potassium and those in serum osmolar changes on 2 hours time course (r=0.68, p<0.01) (Fig. 3, 4).
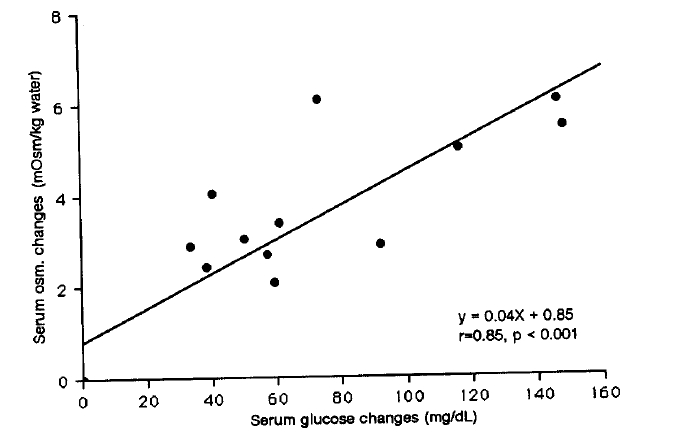
Correlation between mean values of changes of serum glucose and those of osmolar changes at 30, 60, 90 and 120 minutes after glucose load in all three groups.
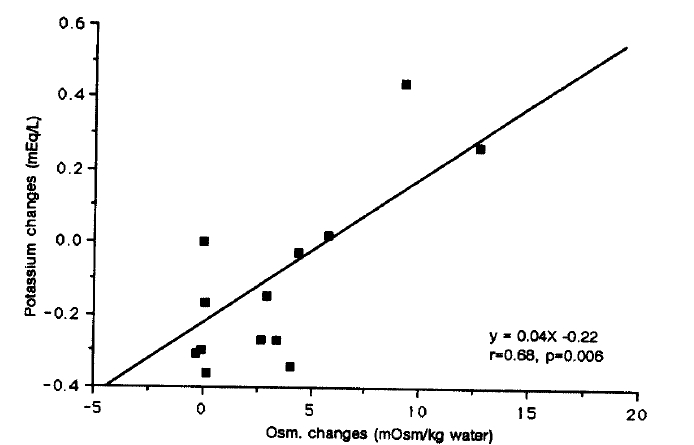
Correlation between mean values of changes of serum osmolality and those of serum potassium changes at 30, 60, 90, and 120 minutes after glucose load in all three groups.
Changes in mean values of serum aldosterone after oral glucose administration rose in group 2 with paradoxical increases of serum potassium and fell in subjects of group 1 and group 3 with decrease of serum potassium, thus following serum potassium values. Changes in mean values of serum aldosterone values at 120 minutes after oral glucose loading were significantly higher in group 2 than group 1 and 3 (p<0.005) (Fig. 5).

Changes in mean values (±SE) of serum aldosterone on time course to controls (group 1) and to diabetics with paradoxical increases in serum potassium (group 2) and without it (group 3) after glucose load. **p<0.005 compared to group 1 and 3
Changes in mean values of venous pH did not show any uniform significant changes in each subgroup, and there was no correlation between changes of serum potassium and venous pH in diabetic and nondiabetic control subjects (Fig. 6).
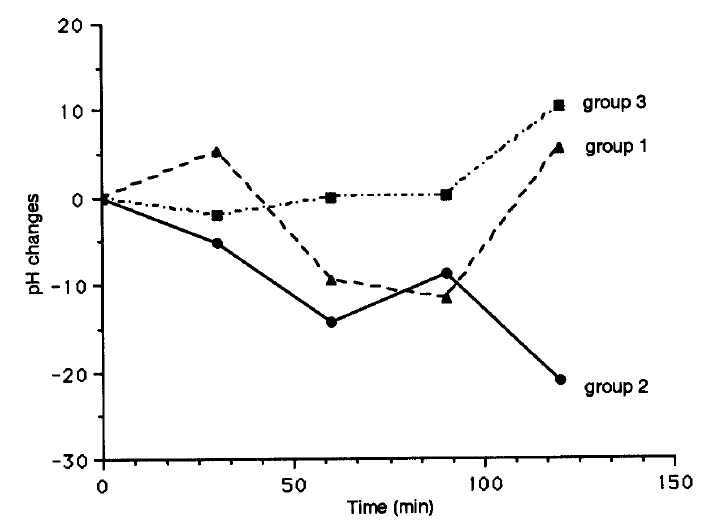
Changes in mean values of venous pH on time course to controls (group 1) and to diabetics with paradoxical increases in serum potassium (group 2) and without it (group 3) after glucose load.
DISCUSSION
When normal subjects are given hypertonic glucose acutely, an early transfer of potassium to the extracellular fluid, due to hypertonicity1–4), occurs, but a concomitant increase in insulin secretion facilitating the intracellular movement of both glucose and potassium produces the decrease in serum potassium frequently leading to hypokalemia as the net result5–11). Similarly, in this present study, after acute oral glucose loading, four control subjects were followed by a gradual decrease in changes of mean values of serum potassium with the fall of a mean value of 0.36 mEq/L at 120 minutes and reached the hypokalemic range (serum potassium concentration < 3.5 mEq/L) in three of four control subjects (Fig. 1). However, in diabetic subjects, since the report of Goldfarb et al.6,7) in 1975 and 1976 describing two patients with diabetes mellitus and selective hypoaldosteronism, in addition to baseline hyperkalemia showing acute increases in serum potassium levels in response to hyperglycemia after intravenous administration of glucose, several studies confirmed this so called paradoxical increase in serum potassium concentration after oral or intravenous glucose loading8–11). The two patients in the study of Goldfarb et al.6) and many patients in the study of Perez et al.8) observed this paradoxical increase in diabetic subjects with baseline hyperkalemia, some degree of renal insufficiency and with combined insulin and aldosterone deficiency. In the normal subjects and in two patients with either aldosterone or insulin deficiency alone in the report of Goldfarb et al.6), the serum potassium levels were lowered or not changed. But, in 1978, Viberti9) found that this paradoxical increase in serum potassium by 0.2 to 1.0 mEq/L (mean, 0.6 mEq/L) in eight diabetics with normal potassium levels, normal renal function and without “clinically overt” hypoaldosteronism, though aldosterone levels were not measured in this study. Also, in 1978, Ammon et al.10) reported a diabetic patient, who exhibited glucose induced paradoxical increase despite normal plasma and urinary aldosterone levels, and in 1981, Nicolis et al.11) observed four insulin deprived patients with diabetes mellitus and normal potassium and aldosterone levels, who became paradoxically hyperkalemic after 100 g of oral glucose loading with a rise of blood potassium concentrations averaging 1.3 mEq/L (range, 0.7 to 1.8 mEq/I) greater than those observed by Perez et al. and Viberti8,9). As described in these previous studies, the underlying mechanisms whereby these paradoxical increases of potassium concentrations in diabetic subjects and complex roles of lack of insulin, presence or absence of aldosterone, and other contributing factors such as baseline potassium level, renal insufficiency and previous potassium balance were not well defined so far.
As reported, most of these previous study subjects were insulin deprived (Insulin dependent diabetes mellitus, IDDM, Type 1 DM) or at least insulin requiring patients6–11). There is a paucity in the study of potassium derangements following the acute glucose loading in subjects of noninsulin dependent diabetes mellitus (NIDDM, Type 2 DM). However, many other frequent studies revealing subjects at a risk of hyperkalemia out of proportion to the degree of renal impairments with a propensity toward underlying selective hypoaldosteronism were commonly associated with noninsulin dependent diabetic patients, (type 2 DM) as well as insulin dependent diabetes mellitus, (type 1 DM)12–14).
This study was aimed to see the prevalence of paradoxical increases of serum potassium concentrations in oral hypoglycemic agents or diet controlled noninsulin dependent diabetes mellitus (NIDDM) following acute oral glucose load as well as the presence or absence of hypoaldosteronism, changes of serum aldosterone levels, other factors such as pH and the contribution of them toward the possible changes of serum potassium after oral glucose loading.
The results of these studies showed that, in noninsulin dependent diabetics who are in two physiologic defects, i.e, abnormal insulin secretion and resistance to insulin action in target tissues15), the rise in blood glucose after oral glucose administration leading to hyperosmolality elicited heterogeneous responses with changes in mean values of serum potassium with gradual paradoxical increases up to about 0.44 mEq/L at 120 minutes in six diabetic subjects of ten diabetic patients. In the remaining 4 patients, with similar decreases up to about 0.34 mEq/L in changes of mean values of serum potassium levels was like that seen in four nondiabetic control subjects. Three of four nondiabetic subjects and two of four diabetic patients with these similar decreases in serum potassium became hypokalemic (serum potassium concentration<3.5 mEq/L), whereas no patient of six diabetic patients with paradoxical increases of serum potassium developed hyperkalemia (serum potassium concentration>5.0mEq/L) (Fig. 1). These findings, compared to higher incidence of hyperkalemia of previous studies of mostly insulin requiring patients, would be related to relative lack of baseline hyperkalemia in our study subjects. Baseline serum potassium levels showed a significant difference (3.7±0.1 vs 3.9±0.1 mEq/L, p<0.05) as well as baseline serum osmolality (288±2 vs 301±1 mOsm/Kg water, p<0.05) between these two diabetic subgroups (Table 2). The reasons for these heterogeneous responses for ten NIDDM patients are unclear yet. But, in view of significant correlation between both mean values of changes of serum osmolality and those of serum potassium changes (Fig. 4), as well as between mean values of increments in serum glucose and those in serum osmolar changes (Fig. 3) in all diabetic subjects and nondiabetic control subjects, and equal significant difference of baseline serum potassium and baseline serum osmolality, diverse hyperosmolality related to various degree of abnormal insulin secretion and end organ resistance to the effects of insulin in noninsulin dependent diabetics would be at least in part the likely answers for it. In more recent studies, hyperosmolality induced with hypertonic saline caused hyperkalemia equally in diabetic and in diabetic patients16), and in the patients with renal failure acute increase in blood osmolality by hypertonic NaCl was a cause of hyperkalemia independent of insulin levels17). This suggests that hyperosmolality may cause increased blood potassium levels even when insulin levels are normal. Therefore, the role of insulin regulating potassium metabolism in humans is complex and incompletely known.
All ten diabetic subjects, in whom heterogeneous response in serum potassium levels developed when they were fed glucose, had normal baseline serum levels of aldosterone and potassium. The paradoxical rises and falls in serum potassium concentrations in both ten diabetics and four control subjects parallels the rises and falls of changes in mean values of serum aldosterone levels (Fig. 5). Our findings support that aldosterone deficiency is not a prerequisite for hyperkalemic effects of hypertonicity in diabetics9–11,16), and aldosterone responds promptly to even minor changes in blood potassium concentration (0.2 to 0.3 mEq/L) as a potent and directly acting aldosterone secretogogue independent of changes in extracellular fluid volume and the renin-angiotensin system18,19), but they indicate that this response is not immediately effective in returning plasma potassium level toward normal.
This conclusion agrees with the well-known time delay intervening between the administration of aldosterone and the onset of a kaliuretic response20). However, in this study, since blood insulin levels were not measured, the influence of mineralocorticoid replacements were not evaluated, and NIDDM patients with hypoaldosteronism were not included for oral glucose loading, still the complex hormonal, especially insulin and aldosterone, roles in derangements of serum potassium in NIDDM patients after oral glucose loading remains to be solved and needs more study. But, we can only speculate on the importance of these two factors in our present study.
In addition to two hormones-Insulin and aldosterone, and the degree of hypertonicity, other factors such as blood pH21,22) and beta adrenergic receptors23,24) may contribute to potassium derangements by the influences on transcellular movement of potassium. Metabolic acidosis and inhibition of beta adrenergic receptor with medication were known as factors to develop hyperkalemia. But, the subjects in our study had no medications of beta blockers or beta stimulators and no evidence of clinically overt autonomic neuropathy. In venous pH, the subgroup of diabetic subjects with decrease in serum potassium after glucose load was significantly more acidemic with higher baseline serum potassium level compared to the other subgroup of diabetics with paradoxical increase in serum potassium after it (3.9±0.1 vs 3.7±0.1 mEq/L in serum potassium levels, 7.37±0.01 vs 7.40±0.01 in venous pH, p<0.05) (Table 2). However, there was no uniform parallel changes in venous pH on time course following the changes of serum potassium after oral glucose loading in diabetic and control subgroups (Fig. 6).
In conclusion, the heterogeneous serum potassium changes after acute oral glucose loading were observed in noninsulin dependent diabetes mellitus (NIDDM) patients. More than half of these NIDDM patients (six of ten) showed the paradoxical increases in serum potassium levels in the presence of baseline normokalemia, normal renal function and normal aldosterone levels. These abnormalities may predispose to unexpected acute aggravation of hyperkalemia, particularly in the setting of baseline hyperkalemia already challenged by severe acidosis, impaired renal function, severe hyperglycemia, or with potassium salts or potassium-sparing diuretics. The mechanism of this heterogeneity of serum potassium changes in NIDDM would be related to in part various degree of abnormal insulin secretion and end organ resistance in insulin effects, but it remains for more study including further clarification of complex roles of both insulin and aldosterone in addition to other factors, such as hypertonicity, blood pH and beta adrenergic receptors.