Correlation between Blood Pressure Changes Assessed by 24-hour Ambulatory Blood Pressure Monitoring and Urine Microalbuminuria Excretion Rate in Normal and Essential Hypertension
Article information
Abstract
To document the correlation between renal damage and circadian blood pressure variation, urinary microalbumin excretion rate (UAER) and 24-hour ambulatory blood pressure monitoring (24-hr ABPM) were performed in 16 normotensives and 29 stage I–III essential hypertensive subjects (whole-day mean BP; 120.13/79.06 mmHg vs 152.59/94.31 mmHg, p<0.05).
The BP variables of 24-hr ABPM included hourly mean arterial pressure (MAP), maximum, minimum and mean systolic and diastolic BP of the awaking (daytime) and sleep time (nighttime), and whole-day mean BP. Subsequently, BP reduction of maximum, minimum and mean BP between awaking time and sleep time were also calculated as other variables.
UAER was not different between the normotensive and hypertensive group (9.44 ± 11.48 vs 11.87 ± 9.27 μg/min, p>0.05). 10 subjects (2/16 in normal vs 8/29 subjects in hypertensives) revealed over 16 μg/min of UAER.
All of the awaking BP variables and whole-day mean BP were correlated with the UAER in whole subjects and hypertensives, but almost sleep BP variables except maximum DBP and mean DBP were not. On the contrary, only daytime minimum DBP and SBP were correlated with UAER in normotensives.
The common best correlated BP variable in awaking time was minimum BP (DBP and SBP; r=0.49, r=0.44 in whole, r=0.51, r=0.58 in hypertensives, r=0.54, 0.56 in normotensives, all p<0.05).
Hourly MAP at 24 PM in whole subjects (r=0.49, p<0.05) and that of at 22 PM in hypertensives were best correlated (r=0.71, p<0.05). Those from 15 PM to 1 AM in whole subjects were also significantly correlated with the UAER (r=0.33∼0.44, all p<0.05).
But in hypertensives, all the hourly MAPs were correlated except those of 4, 5, 6, 10, 11 AM and 14 PM. On the contrary, in normal group, the hourly MAP were not completely related to UAER throughout 24 hours (all p=NS).
Among all computed day-night BP reductions, only minimum DBP was significantly correlated with the UAER (r=0.34, p=0.022).
This study suggests that not only awaking BP but also day-night minimum DBP reduction are highly responsible for the renal impairment in essential hypertension.
INTRODUCTION
Hypertension finally delivers target organ damages (TOD) such as retinal vessel damage and left ventricular hypertrophy (LVH), which are obviously related to patients’ morbidity and mortality in the future.
Initially, Devereux et al1) showed a weak correlation between LVH and sleep BP but lower than that of awaking BP. Pessina et al2) reported that mean daytime BP is strongly related to those TOD using 24-hr ABPM and casual BP. But, according to some authors3), nighttime BP is more related than that of waking BP to LVH especially in women, and day-night BP reduction is inversely correlated with LVH.
Recently, Palatini et al4) found that higher TOD was present in the patients with increased daytime BP variability and reduced day-nighttime BP fall. However, almost all investigators did not include the kidney as a target organ in their study. Thus, until now, only a few data are available which document relationship between circadian BP changes and renal damage.
Macroproteinuria (>300 mg/day) is shown in at least 10% of the essential hypertensive patients, suggesting over renal impairment5), but microalbuminuria (30∼300 mg/day or <200 μg/min) is also shown in 40% of the essential hypertension patients6).
Yudkins et al7) have documented that increased urinary microalbumin excretion rate (UAER) means an independent risk factor of the cardiac morbidity and mortality, especially in insulin-dependent diabetes and normal individuals. And Redon et al8) have also demonstrated that microalbuminuria is closely related to the degree of hypertension.
Thus UAER can be used as a predictor of the future progression of renal impairment in various disorders9).
The purpose of this study is to verify the correlation between UAER as a predictor of renal damage and BP variables assessed by 24-hr ABPM in normal and essential hypertension.
SUBJECTS AND METHODS
This study included 29 hypertensive and 16 normotensive subjects who were aged under 65 years old (53±10.1, Mean±SD). 23 subjects were male and 21 subjects were female (Table 1).
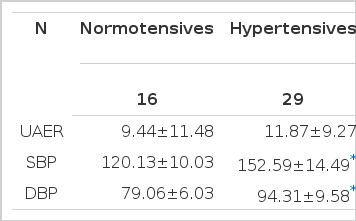
Profile of Normotensive and Hypertensive Subjects
Hypertension was defined when mean daytime BP was over 140/90 mmHg and less than 210/120 mmHg (stage I–III by WHO classification). All subjects had received intermittent or no antihypertensive therapy without proper control.
Subjects with evidence of diabetes mellitus, history of past or present nephropathy with macroproteinuria, other endocrine diseases, congestive heart failure, coronary heart disease, or over 5 years history of hypertension, and patients with decreased creatinine clearance (less than 80 ml/min) were excluded.
After at least 4 weeks wash-out period, 24-hr ABPM (Accutraker II, Suntech Co., Australia) were performed under the strict recommendation of keeping the sleeping and awaking time (11 PM and 7 AM). Blood pressure was measured automatically at 30 minutes interval. Acquired BP data were transferred and assessed variables by Accusoft software installed on IBM personal computer.
Simultaneously, urine was collected for 24 hours and stored in −20°C until assay. Urine microalbumin was measured by RIA kit (Diagnostic Products Co. USA). UAER was calculated by the quantity of excreted microalbumin × urine volume/1440, described as μg/min.
STATISTICAL ANALYSIS
The BP variables of 24-hr ABPM included the maximum and minimum BP, mean BP in awaking and sleep time and whole-day, and 1 hour interval mean arterial BP (hourly MAP). BP reductions of maximum, minimum and mean systolic and diastolic BP between awaking and sleep time (day-night BP fall) were calculated as other variables.
Regression analysis was performed to assess correlation coefficient between UAER and the above BP variables using SAS package.
Data are described as mean±SD and thought to be significant when the probability (p) is less than 0.05.
RESULTS
1. Crude DATA (Table 2–4)

The BP Variables from 24-hr ABPM and Their Correlations with UAER in Normal, hypertensives and Whole Subjects
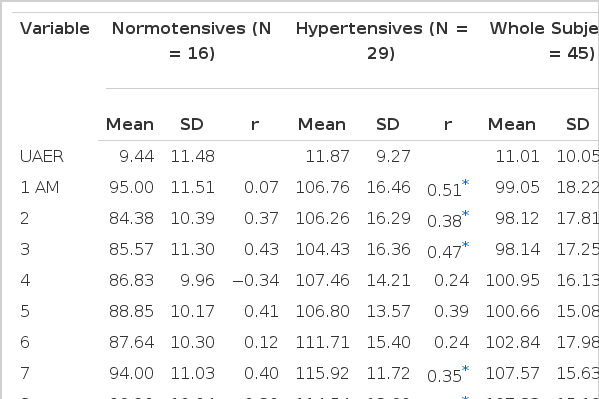
Hourly Mean Arterial Pressure (MAP) Throughout 24 Hours and Its Correlation with UAER
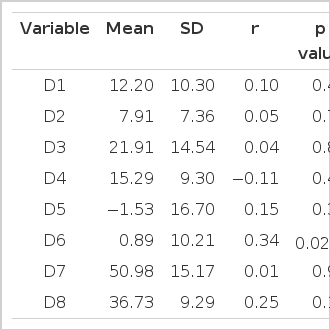
Correlation between Various BP Differences and UAER in Whole Subjects
Mean UAER was 11.00±10.05 μg/min in total subjects, 9.44±11.48 μg/min in normotensive and 11.87±9.27 μg/min in hypertensive group.
The circadian variation gained from hourly MAPs throughout 24 hours consisted of 2 peaks which were 99.53±11.81 mmHg at 11 AM and 96. 31±7.53 mmHg at 18 PM in normotensive group and 120.58±14.20 mmHg at 12 AM and 122.65±13.07 mmHg at 20 PM in hypertensiver group (Fig. 1). Those two BP peaks within each group were not different (p>0.05). But BP peaks in hypertensive group tend to delay 1∼2 more hours in time than those of normotensives.
-
In awaking time, the hypertensive group revealed the maximum BP 180.83/116.59 mmHg, the minimum BP 127.72/77.52 mmHg and the mean BP 155.86/96.69 mmHg. And the normotensives yielded the maximum BP 148.63/97.75 mmHg, the minimum BP 98.13/62.75 mmHg and the mean BP 123.13/80.88 mmHg.
In sleep time, the hypertensive group revealed the maximum BP 160.38/100.21 mmHg, the minimum BP 129/77.45 mmHg and the mean BP 143.55/88.14 mmHg. The normotensives yielded the maximum BP 124.06/84.44 mmHg, the minimum BP 99.19/65.38 mmHg and the mean BP 111.13/74.13 mmHg.
Throughout the whole day, all the BP variables of hypertensive group were significantly higher than those of normotensive group (all p<0.05).
Whole-day mean BP were 141.04/88.89 mmHg in whole subjects, 120.13/79.06 mmHg in normotensive, and 152.59/94.31 mmHg in hypertensive group (normotensives vs hypertensives, p<0.05).
-
Day-night BP fall of whole-day mean BP was 12.20±10.30/7.91±7.36 mmHg. That of maximum BP was 21.91±14.54/15.29±9.30 mmHg and minimum BP −1.53±16.70/−0.89±10.21 mmHg.
The BP fall between maximum SBP in daytime and minimum SBP in nighttime was 50.98±15.17/36.73±9.29 mmHg.

Circadian BP variation according to hourly MAP in normotensive (normal) and hypertensive group.
2. Correlations between UAER and 24-hr ABPM Variables in Each Group
UAER in whole subjects and hypertensive group were correlated with mean BP (SBP r=0.36 and 0.52; DBP r=0.40 and 0.54, all p<0.05), maximum BP (SBP r=0.30 and 0.51; DBP r=0.37 and 0.53, all p<0.05) and minimum BP (SBP r=0.44 and 0.58; DBP r=0.49 and 0.52, all p<0.05) in awaking time (Fig. 2). But, in control group, the UAER was only correlated with minimum BP (SBP r=0.56; DBP r=0.54, p<0.05).
In sleep time, only maximum DBP and mean DBP were correlated with UAER (r=0.41 in whole subjects; r=0.58 in hypertensive group, all p<0.05), while there was no correlation between UAER and BP variables in normotensive group.
Whole-day mean BP of whole subjects and hypertensive group were related to their UAER (SBP r=0.33 and 0.49; DBP r=0.40 and 0.56 all p<0.05). But that of normotensives was not related to UAER.
The hourly MAPs of normotensives were not correlated with their UAER. But, in hypertensive group, they were well correlated with UAER mainly from midday (12 AM) to midnight (3 AM) and in the morning (from 7 to 9 AM).
Among the day-nighttime BP differences, only the minimum DBP fall was correlated with UAER (r=0.34, p=0.022) (Fig. 3). Other BP differences were never correlated in whole subjects (Table 4).

Scatterplot for UAER vs minimum BPs in daytime in hypertensive group.
Scatterplot for UAER vs MAP at 23 PM in hypertensive group.
DISCUSSION
As approximately 10% of the hypertensives have macroproteinuria, which is considered as an unfavorable outcome9), early detection and control of renal TOD is one of the major therapeutic goals in hypertension management.
Recently, urinary microalbumin excretion rate (UAER) was proven to be not only highly predictive of progression to overt nephropathy during the next 10∼15 years10–13) but also to be used as a predictor of cardiovascular morbidity and mortality in patients with diabetes mellitus and normotensives7,14).
Prevalence of microalbuminuria is 3.7∼23% in patients with diabetes mellitus and over 40% in patients with essential hypertension6).
But microalbuminuria can be seen even not only in normotensives, but also transiently in cases of hyperglycemia, congestive heart failure, water loading, urinary tract infection and excessive physical activity. Thus, it’s clinical implication has been still controversial and unclear.
Some investigators documented that microalbuminuria in essential hypertension was well correlated with mean arterial pressure (MAP) measured by casual BP or 24-hrs ABPM as well. But 24-hrs ABPM has been known as a more useful measure to evaluate the degree of hypertension and to follow up for the hypertension than casual BP15,16). Moreover, by using ABPM, not only diurnal variation of the patients but also other important information such as BP variability and BP load throughout the 24 hours can be acquired.
Concerning the next 10∼15 years in patients with IDDM, significant cut-off values of UAER are widely variable depending on investigators.
Parving et al10) reported that 75% of the IDDM patients having over 28 μg /min developed overt nephropathy. Vibert et al11) reported 87% of the patients having over 30 μg/min. But Mogensen12) et al reported 86% of the patients with over 15 μg/min. And Mathiesen et al13) found 100% of the patients having over 70 μg/min. The generally accepted cut-off range of the UAER is 16 μg/min, but in this study only 10 subjects (2/16 in normal, 8/29 in hypertension) were encountered.
UAER of normotensives showed 9.44±11.48 μg/min in this study, while hypertensive subjects showed 11.87±9.27 μg/min which was not different statistically (p>0.05). Actually, another six hypertensive subjects (6/51, 11.7%) had a higher value of UAER (over one fold dilution, >60 μg) in our study. One was excluded because the 24 hours urine volume was so little (less than 60 ml/day) even though the UAER yielded 68 μg/min. Another five subjects were excluded due to excessive range of UAER (from 200 to over 500 μg/min) suggesting macroproteinuria. However their excessive UAER were not correlated with their BP variables, and showed widely spreading pattern in scatter plot insignificantly. The most important reason for exclusion of those cases was that we thought that if the UAER could be and early meaningful predictive of the renal impairment, it should be low value, at least less than 60 μg/min (one fold dilution).
Revealing the UAER quite lower than those of other investigators may suggest that those who have a short term history of hypertension probably have not profound renal impairment yet.
However, good correlation between mean whole-day BPs and UAER suggests that UAER can be a useful predictive and follow-up measure for renal TOD due to essential hypertension.
Our result shows that good correlation between the whole-day mean BPs or daytime BP variables with UAER in hypertensives is consistent with almost all other investigations. But in normotensive group, only the minimum DBP in daytime, being the common best correlate, was related to UAER. In nighttime, no significant correlation was found between BP variables of normotensives and UAER, while only maximum DBP was correlated in hypertensives. The above results are very impressive findings that can provide us with therapeutic references. Consequentely, our results reflect that daytime BP, especially DBP, is more responsible for the renal TOD than night BP is. Throughout the whole day, hourly MAPs of control were completely not related to UAER, while those of hypertensives were significantly related with near all the hours, especially during evening and midnight.
It is an important finding for the antihypertensive strategy in TOD therapy and prevention, because the BP circadian rhythm of hypertensives is still maintained though its highest BP peak is shifted to the late evening hours which somewhat differ from that of normal (Fig. 1).
Devereux et al1) previously found a weak correlation between LVH and nighttime BP, lower than that with daytime BP. Recently, Palatini et al4) demonstrated the variability of daytime SBP, but peak BP is considerably related to LVH and retinal damage in hypertension. On the contrary, Verdecchia et al3) described that nighttime BP was well or loosely correlated with LV mass index.
But our data was partially compatible with other observations because the hourly MAPs were related to UAER with wide-ranging hours from evening to midnight.
Thus, the authors’ result suggest the possibility that successful BP suppression by adequate antihypertensive drugs during those hours could decrease or prevent the renal TOD.
Verdecchia et al17) documented that cardiac complications are inversely correlated with day-night BP fall, and those of the female are closely related with cardiac morbidity. Also, other investigators4,18) indicated that decreased day-night BP fall was closely related to other TODs, especially in LVH and strokes.
But according to our data, UAER is positively correlated with day-night minimum DBP fall, but not with other day-night falls of BP variables, which suggests that more UAER is more DBP fall. Thus, some discrepancies still remain between others and our investigation.
It has been known that early stage essential hypertension preserves normal circadian rhythm similar to those of normotensives, as seen in our data, but shows deeper day-night BP fall than that of normal19).
But on the other hand, it has been also well known that diabetic nephropathy20), chronic renal failure patients with overt proteinuria or bedridden old-aged patients and severe hypertension21,22) show broken circadian rhythm and reduced day-night BP fall.
Consequently, to maintain normal circadian BP variation is to preserve considerable day-night BP reduction, while patients with broken circadian BP rhythm are not. Thus, it is natural that more day-night BP fall means more severe renal damage. Therefore, a strong possibility has remained that other investigations contained a lot of subjects with broken circadian rhythm such as diabetes with or without hypertension in their studies.
Apparently, our study did not provide the correlation between day-night BP falls and renal damage in the different sexes, but it is likely to remain for future study.
In conclusion, not only BP changes from mid-day to mid-night but also day-night BP fall of minimum DBP may play an important role in renal impairment of essential hypertension. And further distinct relationships between essential hypertension and various TOD, including renal and cardiovascular system, should be clarified.