The Body Mass Index as a Prognostic Factor of Critical Care
Article information
Abstract
Background/Aims
Obesity is a worldwide concern, but its influence on critical care outcomes is not well understood. We tested the hypothesis that abnormal body mass index (BMI) would be an independent predictor of higher mortality rates in intensive care unit (ICU).
Methods
We retrospectively reviewed patients who had admitted to the ICU from January 2007 to December 2007. Admission BMI was analyzed as both a three categorical (underweight, < 18.5 kg/m2; normal weight, 18.5 to 24.9 kg/m2; overweight and obese, ≥ 25 kg/m2) and continuous variables among all patients with an ICU lenth of stay ≥ 4 days. The primary outcome was ICU mortality.
Results
The multivariate analysis on ICU mortality selected Mortality Prediction Model-Admission (MPM at time zero) (hazard ratio [HR], 1.024; p = 0.001; 95% confidence interval [CI], 1.010 to 1.037), failed extubation (HR, 5.092; p = 0.0001; 95% CI, 2.742 to 9.456) as significant risk factors. When controlling these variables, none of the BMI group and BMI as a continuous variable had an independent association with ICU mortality.
Conclusions
BMI did not have a significant influence on ICU mortality. The ICU mortality was influenced more strongly by severity of illness and failed extubation rather than BMI.
INTRODUCTION
Body mass index (BMI) is an index that reflects total body fat content. By the definitions of the National Institutes of Health (NIH) and World Health Organization (WHO), a person with a BMI of < 18.5 kg/m2 is defined as underweight, BMI of 18.5 to 25 kg/m2 as normal weight, whereas overweight is defined as a BMI of 25 to 29.9 kg/m2, obese as a BMI of 30 to 39.9 kg/m2 and morbidly obese, ≥ 40 kg/m2 [1,2].
Obesity is increasing worldwide [1,3]. Obesity has been associated with an increased risk for diabetes and for cardiovascular and pulmonary diseases, and an increased risk of death associated with these disorders. Additionally, obese patients have more frequent hospitalizations because obesity is associated with the progression of many underlying disorders [2].
A previous study also showed a higher mortality for those who were underweight with respect to NIH criteria. This association may be caused by thinness and inadequate nutritional reserves to compensate for the stress associated with critical illness [4]. Although it is widely believed that individuals with abnormal BMI have poor outcomes, few data are available on the morbidity and mortality associated with BMI in patients admitted to the intensive care unit. Thus, we sought to investigate the association of BMI, especially the overweight and obese categories, with intensive care unit (ICU) mortality, duration of ICU care, and frequency of adverse events. Our hypothesis was that poor clinical outcomes after critical care would be observed in patients in the abnormal BMI group.
METHODS
Study population
Data were collected from January 2007 to December 2007 and included 501 critically ill patients over 18 years of age who were admitted to the ICU of Ewha Womans University Medical Center, a tertiary referral hospital. Thirty patients who stayed less than 72 hours from admission were excluded (Fig. 1), as the initial period of ICU is most influenced by the primary cause of ICU admission [2].

Included and excluded subjects in study. In total, 501 critically ill patients admitted to the intensive care unit (ICU) were recruited; 30 patients who stayed less than 72 hours from admission were excluded. Thus, data from 471 were analyzed.
Study design
The degree of obesity was assessed by BMI, calculated as BMI = body weight, kg / height, m2. Patients were stratified into three groups according to the current NIH and WHO criteria for BMI [5]. Underweight subjects had BMI < 18.5 kg/m2, normal weight subjects had BMI 18.5 to 24.9 kg/m2, and overweight and obese subjects had BMI ≥ 25 kg/m2. Demographic data were collected including age, gender, comorbidities, as were ICU-related data including duration of ICU care, ICU mortality, presence of nosocomial infection occurring > 48 hours after hospitalization, and other adverse events. Severity of illness was measured at the time of ICU admission using the "Mortality Prediction Model-Admission" scoring system (MPM at time zero). MPM at time zero includes the following parameters: emergency admission, cardiopulmonary resuscitation prior to ICU admission, cancer as part of the presenting problem, chronic renal failure, probable infection, previous ICU admission within 6 months, surgical service at ICU admission, Glasgow Coma score, age, heart rate at ICU admission, and systolic blood pressure [6]. The study was approved by the Institutional Review Board, and the need for informed consent was waived.
Statistical analysis
Data were analyzed using the SPSS version 12.0 (SPSS Inc., Chicago, IL, USA) to assess the effects of factors on ICU mortality. Descriptive frequencies were expressed using the mean ± SD. Difference testing between the groups was performed using analysis of variance (ANOVA), Student's t test, chi-squared test, or Fisher's exact test, as appropriate. Scheffe's correction was used for multiple comparisons. We performed a multivariate Cox proportional hazard model with time to in-hospital death right censored at 60 days as the dependent factor in the overall population to avoid an effect on the duration of ICU care from late mortality. A p values of < 0.05 were deemed to indicate statistical significance.
RESULTS
Among the 471 patients, 17.4% were underweight, 64.1% were of normal weight, and 18.5% were overweight or obese (Fig. 2). Table 1 lists the characteristics of the study population (n = 471). The average age was 62 years, with a male-to-female ratio of 3 : 2. The mean percentage of predicted mortality by MPM was 39. No difference among the three groups in severity of illness at admission was observed. Patients who were overweight or obese were more likely to have preexisting hypertension (p ≤ 0.001). Patients who were underweight were less likely to have preexisting diabetes mellitus or hypertension and more likely to have preexisting pulmonary disease (p = 0.001 (Table 1).

Histogram representing the distribution of body mass index. Among the 471 patients, 17.4% were underweight, 64.1% were normal weight, and 18.5% were overweight or obese.
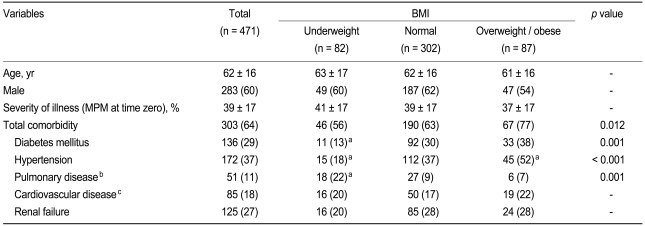
Patient characteristics according to BMI categories
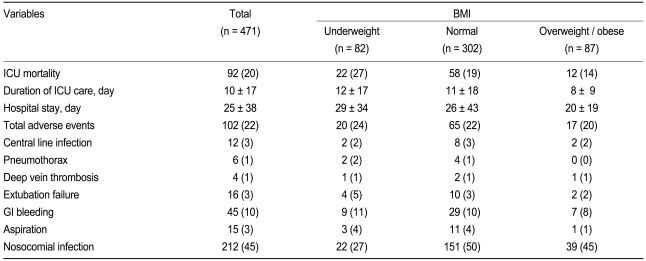
Table 2 presents the differences in ICU outcome among the BMI categories. No statistically significant difference was found among BMI groups with respect to ICU mortality, duration of ICU care, duration of hospital care, or adverse events, except nosocomial infection. Nosocomial infection revealed a significant difference among BMI groups (p = 0.001). Using Scheffe's post hoc analysis, it was found that underweight patients had lower risk of nosocomial infection than did those of normal weight (p = 0.001). To further evaluate the effect of BMI on ICU mortality, Cox regression analysis was used (Table 3). The hazard ratio (HR) of BMI as a continuous variable was 0.964 (p = 0.234; 95% confidence interval [CI], 0.908 to 1.024). Compared with having normal BMI, the HR for being underweight was 1.232 (p = 0.414; 95% CI, 0.746 to 2.036) and that for being overweight or obese was 0.762 (p = 0.393; 95% CI, 0.408 to 1.421). No statistically significant relationship between ICU mortality and BMI was found (Fig. 3).
Difference in outcomes among BMI categories
Univariate analysis of ICU mortality
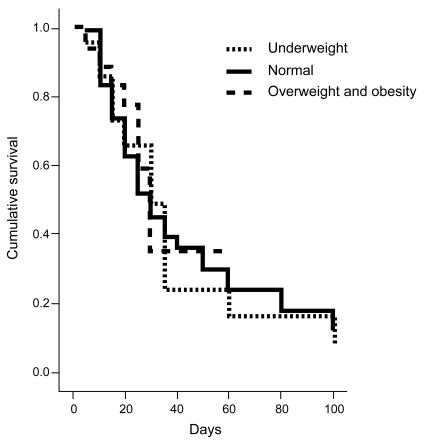
Survival curves stratified according to body mass index: underweight (< 18.5 kg/m2), normal range (18.5 to 24.9 kg/m2), overweight and obese (25 to 39.9 kg/m2). Comparison of survival experience using Wilcoxon statistic. The overall comparison among the three groups showed no difference (p = 0.86). Comparisons between two groups revealed no difference between the normal and underweight groups or between the normal and overweight groups (p = 0.61, 0.80, respectively).
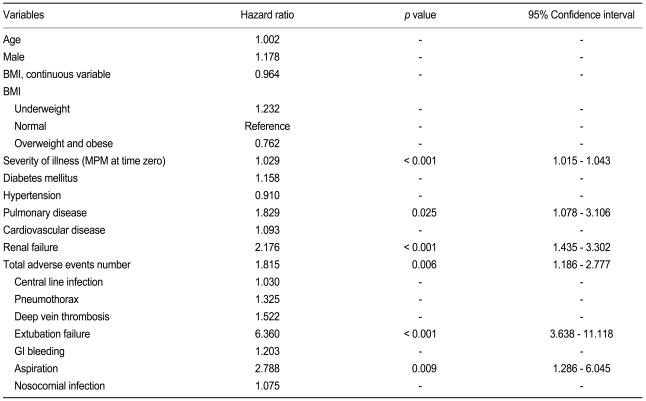
The HR for ICU mortality was increased with increasing severity of illness at admission (MPM at time zero), preexisting pulmonary disease, renal failure, total number of adverse events, extubation failure, and aspiration. When these variables were controlled, no BMI group showed an independent association with ICU mortality by multivariate analysis. The multivariate analysis selected severity of illness at admission (MPM at time zero; HR, 1.024; p = 0.001; 95% CI, 1.010 to 1.037) and extubation failure (HR, 5.092; p ≤ 0.001; 95% CI, 2.742 to 9.456) as significant risk factors (Table 4).
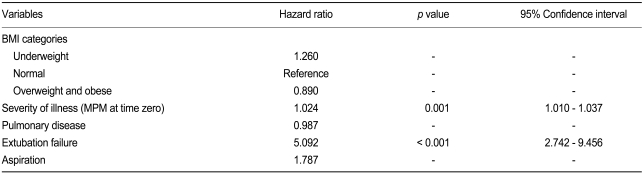
Multivariate analysis on ICU mortality
DISCUSSION
With an increase in the number of overweight and obese patients admitted to the ICU, morbidity and mortality have become a concern for the ICU physician. Many investigators have reported data from the ICU on the proportion of critically ill patients stratified by BMI categories and on outcomes after critical care according to BMI. In obese patients, despite a high incidence of comorbid conditions and susceptibility to physiological derangement [7-9], no independent effect of obesity on outcome of critical illness has ever been clearly demonstrated. Because obese patients have significant changes in physiology, they are at risk for adverse outcomes in the ICU [10].
In a prospective study by Goulenok, a high BMI, of > 27 kg/m2, was associated with high ICU mortality. In a recent large cohort study of ICU patients in Europe, increased morbidity was associated with higher BMI in patients [11]. Obesity was associated with longer ICU stays and increased severity of illness, but no difference was found with respect to nosocomial infection or duration of mechanical ventilation in another previous study [12]. In the present study, abnormal BMI had no significant influence on ICU mortality. In contrast to previous reports, the obese group showed a trend toward reduced mortality and reduced duration of ICU care and hospital stay compared with the underweight and normal groups.
Reasons for the different findings between previous studies and our study may include the following. First, our study included a relatively smaller proportion of obese and severely obese (BMI ≥ 30 kg/m2) subjects compared with previous studies. In our study, the abnormal BMI group was 35.9% of the total, whereas it was 58.1% in the European observational sepsis occurrence in acutely ill patients (SOAP) study [12,13]. Second, baseline characteristics of the study populations were different. For example, obese patients had higher hypertension prevalence and under-weight patients showed a greater prevalence of pulmonary disease and a lower prevalence of nosocomial infection in our study compared with previous studies.
Cox regression analysis identified two prognostic factors relating to mortality: severity of illness at admission (MPM at time zero) and extubation failure. Extubation failure as an adverse event has previously been identified as the most important factor associated with higher mortality [14] and increased duration of ICU and hospital stay after initial extubation. Obese patients have an underlying ventilation-perfusion mismatch that causes hypoxia [13], decreased compliance of the lung, a high incidence of post-extubation wheezing [15], and an increased risk of aspiration [16,17]. All these factors contribute to extubation failure, especially in obese subjects.
The second prognostic marker in this study was severity of illness as scored by MPM. MPM is well established as system for scoring illness severity in the ICU and as a predictor of hospital outcome [18,19].
Limitations of this study include the small sample size (n = 471) and relatively small proportion of obese and severely obese (BMI ≥ 30 kg/m2) patients compared with studies in Western populations [11]. Second, registered body weight at the time of ICU admission may be different from a patient's original body weight due to errors in recall or acute changes resulting from the critical illness, though this should be have little influence in determining outcome.
The prevalence of obesity has been steadily increasing worldwide, and obesity itself is considered a chronic disease as well as a major public health problem. However, very few data are available on the association between BMI and critical care outcome. Further study is needed to identify important correlates of critical care in relationship to BMI so that this information can be used to care for patients and improve outcomes.
In conclusion, BMI showed no significant influence on morbidity or mortality in critically ill patients. Mortality in critical care was associated with severity of illness at admission and ICU-related complications, especially extubation failure.
Notes
No potential conflict of interest relevant to this article was reported.