Current Status of Dialysis Therapy in Korea
Article information
Abstract
The number of patients with end-stage renal disease (ESRD) is rising very rapidly as the number of elderly and patients with diabetes increases in Korea. ESRD Registry Committee of the Korean Society of Nephrology (KSN) collected dialysis therapy data in Korea through an online registry program on the KSN website. The status of renal replacement therapy in Korea at the end of 2009 was as follows. First, total number of patients with ESRD was 56,396 (hemodialysis [HD], 37,391; peritoneal dialysis [PD], 7,618; functioning kidney transplant [KT], 11,387). The prevalence of ESRD was 1,113.6 patients per million population (PMP). Proportion of patients undergoing renal replacement therapy was 66.3% with HD, 13.5% with PD, and 20.2% with KT. Second, a total of 8,906 (HD, 6,540; PD, 1,125; KT, 1,241; incidence rate of 175.9 PMP) patients developed ESRD in 2009. Third, the most common primary causes of ESRD were diabetic nephropathy (45.4%), hypertensive nephrosclerosis (18.3%), and chronic glomerulonephritis (11.1%). Fourth, mean urea reduction rate was 67.5% and 73.8% in male and female patients, respectively, undergoing HD. Mean Kt/V was 1.38 in male patients and 1.65 in female patients. Fifth, the overall 5-year survival rate of male patients undergoing dialysis was 65.4% and that of female patients was 67.4%.
INTRODUCTION
A patient registry and a statistical evaluation of patients with end-stage renal disease (ESRD) is useful to estimate the number and distribution of patients for targeted therapy by groups specializing in dialysis (Korean Society of Nephrology; KSN). They can be applied to clarify the characteristics of ESRD and dialysis therapy, as well as the complications or results based on scientific evidence, to improve the quality of dialysis therapy and provide socioeconomic health administration information for a future health plan. Based on the growth of the elderly population and patients with diabetes, the prevalence of ESRD and the number of hemodialysis (HD) machines is increasing very rapidly in Korea compared to other developed counties [1,2].
The first Korean nationwide registry of patients with ESRD was reported by Professor Byung Suk Min in 1977. The KSN launched an official registry program as "Insan Prof. Min Memorial Renal Replacement Therapy Registry" in 1985 after his death by North Korean terrorists.
Data collection
The KSN ESRD Registry Committee has collected data about dialysis centers and patients through an online registry program at the KSN internet website (http://www.ksn.or.kr) since 2001. This program also has a graphic evaluation function for dialysis adequacy (Kt/V, nPCR) and a peritoneal equilibrium test. For security of the patient's personal information, the program can be opened only by designated dialysis staff with a hospital code and password. Information about dialysis centers that did not respond was collected through paper mail questionnaires.
DATA ON DIALYSIS THERAPY IN KOREA
Prevalence and incidence of ESRD in Korea
A total of 37,391 patients with ESRD underwent maintenance HD and 7,618 underwent peritoneal dialysis (PD), whereas 11,387 had a functioning kidney transplant (KT). Overall, 56,396 patients with ESRD were in Korea at the end of 2009. The prevalence per million population (PMP) was 738.3 undergoing HD, 150.4 undergoing PD, and 224.8 KTs. The overall PMP was 1113.6 with ESRD (Fig. 1A). This prevalence rate is similar to that of most European countries but about half of that in the United States and one-third of that in Japan, according to international data from annual US renal data reports [2-4]. The increasing rate of prevalence per year was about 12% during 2000-2009.
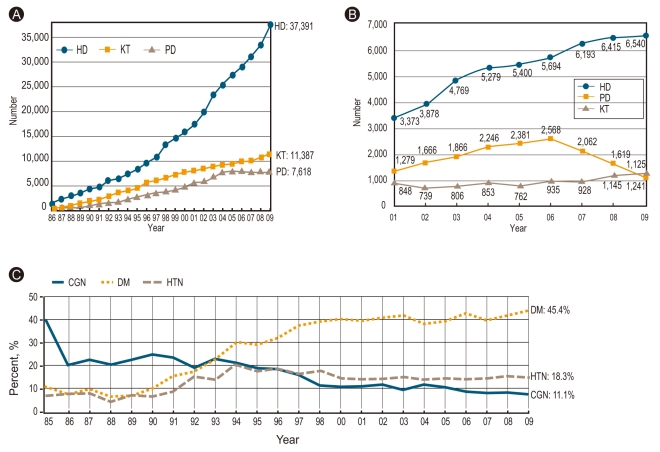
Prevalence and incidence of ESRD in Korea. (A) Numbers of renal replacement therapy patients at the end of each year. (B) New renal replacement therapy patients by year. (C) Three major causes of ESRD. ESRD, end-stage renal disease; HD, hemodialysis; KT, kidney transplant; PD, peritoneal dialysis; CGN, chronic glomerulonephritis; DM, diabetes mellitus; HTN, hypertensive nephrosclerosis.
A total of 8,906 patients (175.9 PMP) underwent new renal replacement therapy in 2009 (Fig. 1B). A total of 6,540 (129.1 PMP) new patients with ESRD underwent HD, 1,125 (22.2 PMP) underwent PD, and 1,241 (24.5 PMP) KTs were performed. The number of new patients undergoing PD has been decreasing since 2007 but those of HD and KT has increased, which is similar to what occurred in the United States [2].
The most common causes of ESRD in new patients were diabetic nephropathy, hypertensive nephrosclerosis, and chronic glomerulonephritis (45.4%, 18.3%, 11.1%, respectively; Table 1). Among these three underlying diseases, diabetic nephropathy increased very rapidly during 1990-2000 (Fig. 1C). The proportion of Korean patients with ESRD and diabetic nephropathy was higher compared to some Asian countries and the United States [2].
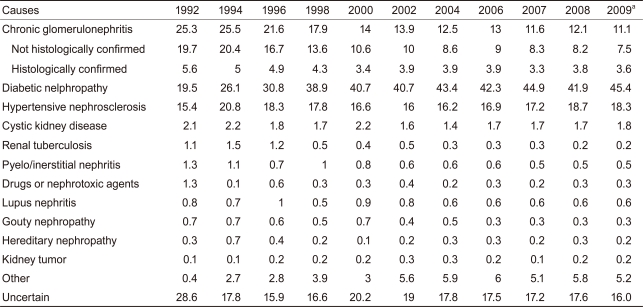
Causes of end-stage renal disease in new patients
Renal replacement therapy modalities
In 2009, approximately 73% of new patients with ESRD started renal replacement therapy with HD, and about 13% patients started PD; the prevalence rates of patients undergoing HD, PD, and KT were 66.3%, 13.5%, and 20.2%, respectively (Fig. 2A).

Renal replacement therapy modalities. (A) Proportion of renal replacement modalities. Annual prevalence and incidence in 2009. (B) Number of hemodialysis centers and hemodialysis machines. (C) Percent distribution of patients undergoing hemodialysis according to the dialysis center classification. (D) Distribution of patients undergoing dialysis based on their life zone in Korea. KT, kidney transplant; PD, peritoneal dialysis; HD, hemodialysis.
The number of HD centers and HD machines is also increasing rapidly in Korea. In total, 614 HD centers and 13,874 HD machines were available in Korea at the end of 2009 (Fig. 2B). The ratio of machines per center was 22.6 and that of patients per machine was 2.7.
About one-third of patients underwent maintenance HD at a university hospital in the late 1990s, whereas about half of patients currently undergo HD at private dialysis clinics (Fig. 2C).
A distribution analysis of patients with ESRD according to life zone in Korea showed that about half of patients undergoing HD and more than half of patients undergoing PD lived in the capital area (Fig. 2D).
Dialysis patient demographics
The gender ratio of patients undergoing HD therapy was 57.6% male vs. 42.4% female, while it was 55.6% male vs. 44.2% females for those undergoing PD therapy.
The mean age of patients undergoing dialysis was 57.3 ± 13.8 years. The age distribution of patients undergoing dialysis revealed two peaks: one at age 50 years and another at age 65 (Fig. 3A), indicating the occurrence of at least two different disease groups. The age distribution according to year since 1986 showed that peak age shifted toward older age, and that the current peak age includes patients in their 60s (Fig. 3B). Elderly patients (> 65 years) undergoing dialysis increased to 33.8% of the overall number of patients undergoing dialysis in 2009.
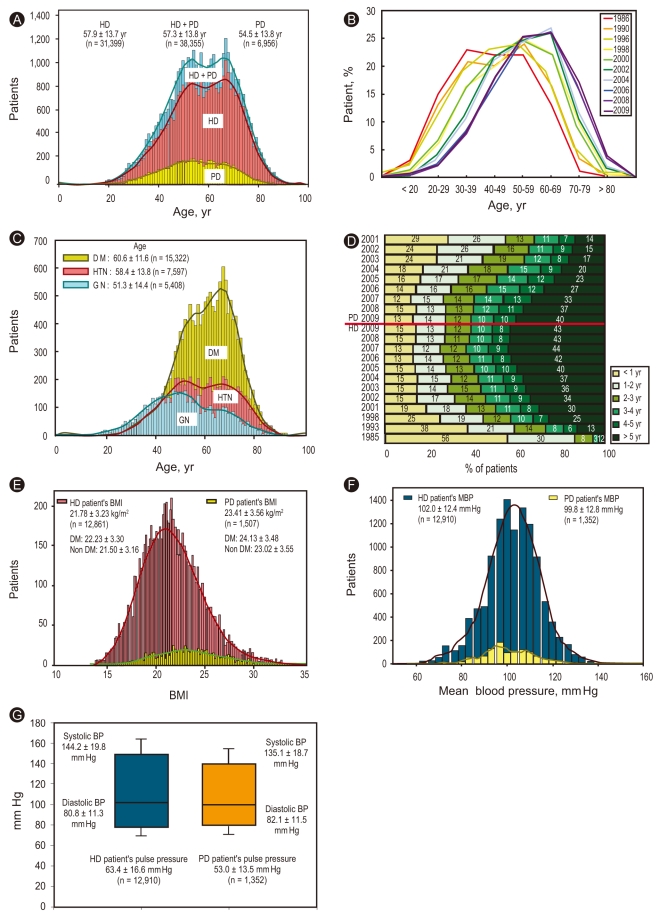
Dialysis patient demographics. (A) Age distribution of patients undergoing dialysis according to dialysis modality. (B) Age distribution of patients undergoing dialysis. Note that the peak age has shifted toward an older age. (C) Age distribution of patients undergoing dialysis according to underlying diseases: patients with diabetes mellitus (DM), hypertensive nephrosclerosis (HTN), and glomerulonephritis (GN). Note the difference in peak age between GN and DM. (D) Duration of maintenance hemodialysis and peritoneal dialysis. Percentage of estimated patient numbers by year. (E) Body mass index (BMI) distribution in patients undergoing hemodialysis (HD) and peritoneal dialysis (PD). (F) Distribution of mean blood pressure (MBP) in patients undergoing HD and PD. The blood pressure (BP) in patients undergoing HD was higher than that of patients undergoing PD. (G) Systolic and diastolic BP with pulse pressure in patients undergoing HD and PD. Note the difference in pulse pressure between the two groups.
The age distribution according to underlying disease showed that the peak age for chronic glomerulonephritis was 51.3 years and that for diabetic nephropathy was 60.6 years (Fig. 3C).
About 43% of patients undergoing HD and 40% of patients undergoing PD were on dialysis for more than 5 years, which was an increase from 30% and 14%, respectively, since 2001 (Fig. 3D).
About 51% of nondiabetic patients undergoing HD were on dialysis for more than 5 years, but only about 29% of patients with diabetes undergoing HD were on dialysis for more than 5 years. Moreover, about 45% of nondiabetic patients undergoing PD were on dialysis for over 5 years, but about only 32% of patients with diabetes undergoing PD were on dialysis for more than 5 years.
The mean body mass index (BMI) of patients undergoing HD was 21.8 ± 3.2 kg/m2 and that of patients undergoing PD was 23.4 ± 3.6 kg/m2 (Fig. 3E). Of patients undergoing HD, the mean BMI of those with diabetes was 22.2 ± 3.3 kg/m2 and that of nondiabetic patients was 21.5 ± 3.2 kg/m2.
The mean blood pressure of patients undergoing HD was 102 ± 12.4 mm Hg and that of patients undergoing PD was 99.8 ± 12.8 mm Hg (Fig. 3F), but the pulse pressure of patients undergoing HD was much higher than that of patients undergoing PD (63.4 vs. 53.0 mm Hg, respectively; Fig. 3G).
Erythropoietin therapy, HD, and PD therapy characteristics
In 2009, the mean hematocrit of patients undergoing HD was 31.5% and that of patients undergoing PD was 30.2%, which were reversed from 2001 figures. Theoretically, patients undergoing PD had a lower prevalence of anemia, but recently developed erythropoietin therapy has increased hematocrits in patients undergoing HD. This rapid increase in hematocrit from 2004 to 2005 was due to an increase in the erythropoietin therapy reimbursement level (Fig. 4A). This therapeutic result is shown quite clearly in Fig. 4B, in which 31% of patients undergoing HD were injected with 8,000 units or more erythropoietin per week, whereas only 15% of patients undergoing PD were injected with 8,000 units or more erythropoietin per week (20% of patients undergoing PD were not administered erythropoietin).
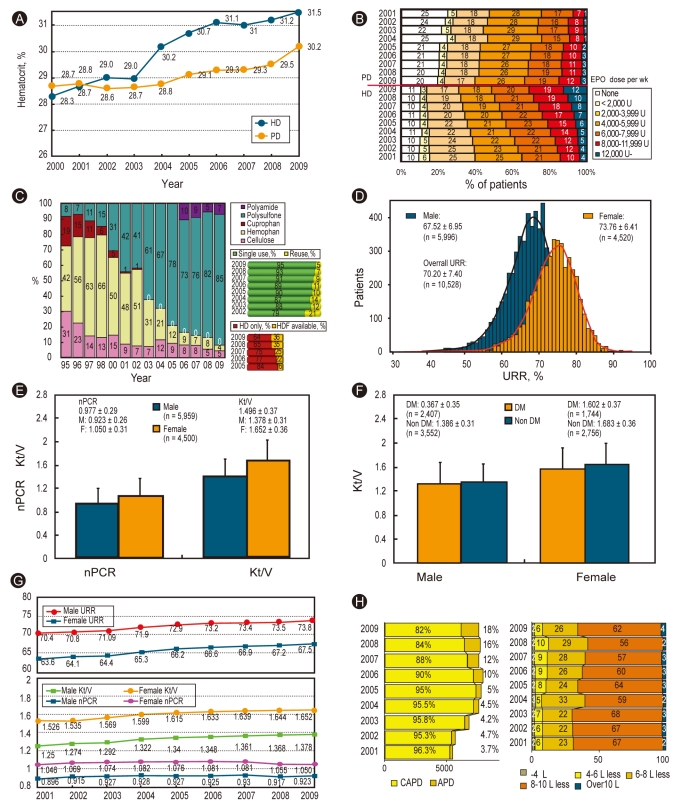
Erythropoietin therapy, hemodialysis (HD) and peritoneal dialysis (PD) therapy characteristics. (A) Changes in hematocrit (%) in patients undergoing dialysis: HD vs. PD. Note the increase in the hematocrit of patients undergoing HD. (B) Percent distribution of erythropoietin (EPO) doses prescribed for patients undergoing HD and PD. (C) Currently using HD membrane and dialysis membrane reuse and percentage of hemodiafiltration (HDF) in private clinics. (D) Distribution of the urea reduction ratio (URR) in patients undergoing HD. Note the difference between males and females. (E) Dialysis adequacy parameters (nPCR and Kt/V) of patients undergoing HD. (F) Dialysis adequacy parameters (Kt/V) for patients with diabetes mellitus (DM) and nonDM who were undergoing HD. (G) Annual changes in dialysis adequacy parameters for patients undergoing HD. (H) Percent distribution of peritoneal dialysis type and doses (2009, n = 2,836). CAPD, continuous ambulatory peritoneal dialysis; APD, automated peritoneal dialysis.
Most (85%) HD centers use polysulfone dialyzers, whereas about 5% of centers reuse dialyzers. Hemodiafiltration therapy was available in 36% of dialysis centers in Korea (Fig. 4C).
Gender differences in the urea reduction ratio are shown in Fig. 4D. The urea reduction ratio in male patients undergoing HD was 67.5% and that in females undergoing HD was 73.8%. This difference was due to the use of the same dialysis dose on different body masses. The overall mean urea reduction ratio was 70.2 ± 7.4%.
The normalized protein catabolic rate and Kt/V were 0.977 ± 0.29 and 1.946 ± 0.37, respectively, which were both higher in female patients than male patients (Fig. 4E). The Kt/V was higher in nondiabetic patients than patients with diabetes probably due to the quality of dialysis vascular-access points (Fig. 4F).
The quality of HD therapy has improved annually (Fig. 4G), but the protein catabolic rate has decreased recently, probably due to the increase in the number of elderly patients undergoing dialysis.
The percentage of patients using automated PD rose to 18% in 2009, but the overall PD dose (dialysate amount) did not increase (Fig. 4H).
Morbidity, causes of death, and survival rates of patients undergoing dialysis
The most common complication (51%) in patients undergoing HD was vascular disease, including hypertension, cerebrovascular accidents, and other vascular diseases (Table 2). Approximately 56% of patients undergoing PD had vascular disease, and a higher infection complication rate was evident in patients undergoing PD (9.1%) compared to those undergoing HD (5.2%).

Comorbidities of patients undergoing dialysis in 2009
The causes of death in patients undergoing dialysis were cardiac, infection, vascular disease, in that order, and one-quarter of the causes of death were unknown or miscellaneous (Fig. 5A). Some year-to-year variation was observed due to limitations in the death reports.

Morbidity, causes of death and survival rates of patients undergoing dialysis. (A) Comparison of the causes of death for patients undergoing hemodialysis (HD) vs. peritoneal dialysis (PD) from 2001 to 2009. (B) Overall survival in registered patients undergoing dialysis since 2001 (male, 19,787; female, 14,688). (C) Survival of patients undergoing HD and PD since 2001 (HD, 27,579; PD, 6,896). (D) Overall survival of non-diabetes mellitus (DM) and patients with DM undergoing dialysis since 2001 (non DM, 17,932; DM, 16,543).
The overall survival rates for patients undergoing dialysis were 94% after 1 year and 66% after 5 years of dialysis (Fig. 5B). These survival rates were higher than those in the United States and Japan [2,3] but were calculated from registered patients undergoing dialysis from 2001. That registry, however, includes only about two-thirds of the total number of patients undergoing dialysis in Korea because the registry included voluntary enrollment by KSN members.
The 5-year survival rate in patients undergoing HD was higher than that of patients undergoing PD (67.4% vs. 59.4%, respectively; Fig. 5C) and that for nondiabetic patients was higher than that of patients with diabetes (75.8% vs. 55.9%, respectively; Fig. 5D).
KT and dialysis costs
In 2009, KT was performed in 1,241 cases, which rose with the increase in the number of available cadaver donors (Fig. 6A). The KT rate was 28 cases per 1,000 patients undergoing dialysis, which was below the world average [2]. However, the number of patients waiting for KTs increased more sharply; 8,488 surviving patients undergoing dialysis were enrolled on the Korean Network of Organ Sharing waiting list at the end of 2009.

Kidney transplantation and dialysis costs. (A) Annual number of kidney transplantations (KTs) in Korea (including data from the Korean Network for Organ Sharing). aSurviving number of patients waiting for KTs at the end of each year. (B) Annual number of patients with chronic kidney disease (International disease code: N18) and medical costs. Data from the National Health Insurance Corporation.
Based on the increased number of patients undergoing dialysis, overall dialysis cost in Korea has rapidly increased to 820 billion Korean won in 2009 (National Health Insurance Corporation; 1 US dollar = 1,100 Korean won; Fig. 6B).
CONCLUSIONS
Because of the increase in the elderly population and the number of patients with diabetes, the number of patients with ESRD has increased rapidly to 1,114 PMP at the end of 2009. A high proportion (45%) of patients with diabetes and ESRD and a decrease in the proportion undergoing PD was recently observed. The adequacy of dialysis and anemia therapy has been improving steadily in Korea.
Acknowledgments
As director of the ESRD Registry Committee, Korean Society of Nephrology, I would like to deeply thank all of the dialysis center medical doctors and nurses in Korea for participating in this survey. FMC Korea, Boryung Pharm, and Gambro Korea also shared their data for confirmation.
Notes
No potential conflict of interest relevant to this article was reported.