Validity of Glycated Hemoglobin in Screening and Diagnosing Type 2 Diabetes Mellitus in Chinese Subjects
Article information
Abstract
Background/Aims
The application of glycated hemoglobin (HbA1c) for the diagnosis of diabetes is currently under extensive discussion. In this study, we explored the validity of using HbA1c as a screening and diagnostic test in Chinese subjects recruited in Nanjing, China.
Methods
In total, 497 subjects (361 men and 136 women) with fasting plasma glucose (PG) ≥ 5.6 mmol/L were recruited to undergo the oral glucose tolerance test (OGTT) and HbA1c test. Plasma lipid, uric acid, and blood pressure were also measured.
Results
Using a receiver operating characteristic curve, the optimal cutoff point of HbA1c related to diabetes diagnosed by the OGTT was 6.3%, with a sensitivity and specificity of 79.6% and 82.2%, respectively, and the area under the curve was 0.87 (95% confidence interval, 0.83 to 0.92). A HbA1c level of 6.5% had a sensitivity and specificity of 62.7% and 93.5%, respectively. When comparing the HbA1c ≥ 6.5% or OGTT methods for diagnosing diabetes, the former group had significantly higher HbA1c levels and lower levels of fasting and 2-hour PG than the latter group. No significant difference was observed in the other metabolism indexes between the two groups.
Conclusions
Our results suggest that HbA1c ≥ 6.5% has reasonably good specificity for diagnosing diabetes in Chinese subjects, which is in concordance with the American Diabetes Association recommendations.
INTRODUCTION
The oral glucose tolerance test (OGTT) is regarded as the "gold standard" for the diagnosis of diabetes mellitus (DM) and impaired glucose regulation (IGR) [1]. However, the OGTT is poorly reproducible, time-consuming, and unsuitable for large-scale screening [2]. Clinical doctors have begun to recognize that point-of-care blood glucose testing cannot accurately monitor glycemic fluctuation, or "drift of glucose," and its clinical significance. Glycated hemoglobin (HbA1c) is an indicator that ref lects the average plasma glucose (PG) levels over the recent 2 to 3 months. The HbA1c test is relatively stable and has less variability and fewer interferences with environmental factors than point-of-care glucose testing [3,4].
Recently, the application of HbA1c in the diagnosis of DM was fully endorsed by The American Diabetes Association (ADA) in an updated and promulgated 2010 version of "The Clinical Practice Recommendations for the Diagnosis and Treatment of Diabetes" [5]. The recommendation was made that HbA1c ≥ 6.5% can be used as a diagnostic criteria for DM. In this study, we examined the HbA1c and OGTT results of 497 Chinese subjects with impaired fasting glucose (IFG). We evaluated the validity of using HbA1c as a screening and diagnostic test for diabetes in Chinese patients with IFG.
METHODS
Subjects
The health care center of Jiangsu Province Institute of Geriatrics has provided diabetes-screening services to the community of Nanjing City since 2009. In the period between September 2009 and February 2010, 3,012 subjects without a past history of chronic illness attended the center and received a fasting PG test. Among them, 497 (16.5%) subjects (361 men and 136 women) had fasting PG levels ≥ 5.6 mmol/L. Their mean (± SD) age was 62.2 ± 11.3 years. All subjects had not received prior OGTT assessment or had a past history of DM or IGR and had not received lifestyle or pharmacological intervention, such as dietary counseling, exercise, or antidiabetic drugs. Patients with anemia were excluded early from the study, although detailed hemoglobinopathy screening was not performed. The Jiangsu Province Health Administrative Department and its Ethics Committee approved the study. All subjects consented to participate in the study.
Assessment
After overnight fasting, each subject was evaluated using simple health assessments and was administered a 75-g OGTT (10-12 hours). The health assessments included measurement of blood pressure (BP), body weight, height, and waist circumference (WC). BP was measured twice using a standard mercury manometer in the sitting position after the subject rested for at least 15 minutes. The average of the two measurements was recorded. Body weight, height, and WC were measured with the patient wearing light clothing and no shoes. The minimum waist measurement between the xiphisternum and umbilicus was taken as the WC. Body mass index (BMI) was calculated as the weight (kg) divided by the height squared (m2).
Prior to the OGTT, all subjects had at least 3 days of unrestricted diet (> 150 g of carbohydrate daily). HbA1c, lipid profiles (total cholesterol [TC], triglyceride [TG], high-density lipoprotein cholesterol [HDL-C]) and uric acid (UA) were measured in the fasting blood samples. All blood specimens were analyzed at the Central Laboratory of Endocrinology and Metabolism, Jiangsu Province Institute of Geriatrics. PG was assayed using the glucose oxidase method. The HbA1c assay was standardized under the National Glycohemoglobin Standardization Program with traceability to the Diabetes Control and Complications Trial (DCCT) reference method. The test used ion exchange high-performance liquid chromatography (HLC-723G7) with an inter-assay coefficient of variation (CV) at 0.2% and an intra-assay CV at 2.0%. The lipid profiles and UA were measured by the automatic biochemistry analyzer (Hitachi 7000, Hitachi Ltd., Tokyo, Japan). Low-density lipoprotein cholesterol was calculated using Friedewald's equation [6].
Glycemic status was classified according to the ADA 2010 diagnostic criteria using PG values in the OGTT [1]. The definition of normal glucose tolerance (NGT) was modified in this group of subjects with IFG and defined as fasting PG ≥ 5.6 and < 7.0 mmol/L and 2-hour PG < 7.8 mmol/L. IGR was defined as fasting PG ≥ 5.6 and < 7.0 mmol/L and 2-hour PG ≥ 7.8 and < 11.1 mmol/L. DM was defined as fasting PG ≥ 7.0 and/or 2-hour PG ≥ 11.1 mmol/L. Test results were further validated using HbA1c ≥ 6.5%.
Statistical analysis
Statistical analysis was performed using the software SAS version 15.0 (SAS Inc., Cary, NC, USA). Continuous variables were presented as the mean ± SD and categorical data as number (%). Group data were compared by normal testing and the test for homogeneity of variance. The difference in the mean between groups was analyzed using one-way analysis of variance (ANOVA) and the intergroup comparison was made using the least significant difference (LSD) test. A p value < 0.05 (two-tailed) was considered statistically significant. The optimal cutoff point of HbA1c in the patients with DM diagnosed with the OGTT was calculated by utilizing the receiver operating characteristic (ROC) curve.
RESULTS
Of the 497 subjects, according to the OGTT results, 155 (31.2%) subjects had DM, 230 (46.3%) had IGR, and 112 (22.5%) had NGT. Table 1 summarizes the clinical parameters of these subjects according to their glycemic status. In particular, HbA1c values in subjects with NGT, IGR, and DM were 5.84 ± 0.77%, 6.06 ± 0.77%, and 6.88 ± 0.99%, respectively (p value < 0.05 comparing the three groups). Age, BMI, WC, systolic BP, fasting and 2 hours PG, TG, and HDL-C were significantly different between any two groups of NGT, IGR, and DM.
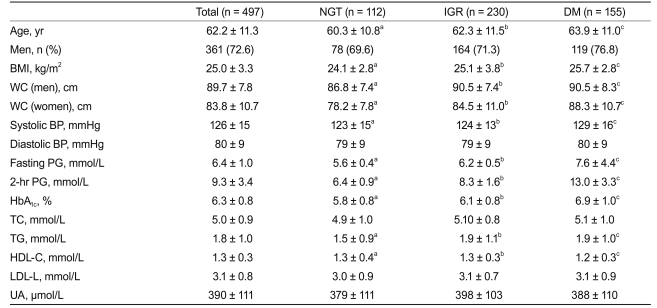
Clinical parameters of 497 Chinese subjects according to their glycemic status based on OGTT results
In total, 213 subjects with DM were diagnosed by either HbA1c ≥ 6.5% and/or the OGTT. Among these 213 subjects, 154 were diagnosed by HbA1c and 155 were diagnosed by the OGTT; 96 fulfilled both criteria (the "overlapping" group), accounting for 45.1% of all the newly diagnosed patients who had DM. Table 2 summarizes the clinical characteristics of the DM group diagnosed by the different criteria with or without excluding the "overlapping" group. In those diagnosed by HbA1c, the HbA1c level was higher, and the fasting and 2-hour PG values were lower than those diagnosed by the OGTT. After excluding the "overlapping" group, the DM subjects, regardless of the diagnostic test used, had significantly lower fasting and 2-hour PG and HbA1c levels, compared with those included in the "overlapping" group. No significant difference was noted for other clinical indexes such as BP and lipid profile (Table 2).
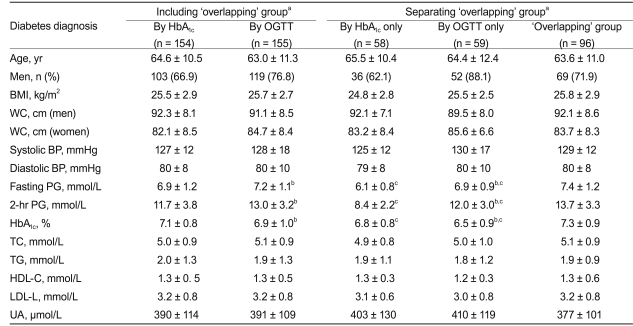
Comparison of clinical parameters among 213 subjects with diabetes diagnosed by different methods
With OGTT as the reference standard for diagnosing DM, the optimal cutoff point of HbA1c was 6.3%, with sensitivity and specificity at 79.6% and 82.2%, respectively. The corresponding area under the curve (AUC) of the ROC curve was 0.87 (95% confidence interval [CI], 0.83 to 0.92). Using HbA1c ≥ 6.5% as a diagnostic tool, the sensitivity and specificity were 62.7% and 93.5%, respectively (Fig. 1).
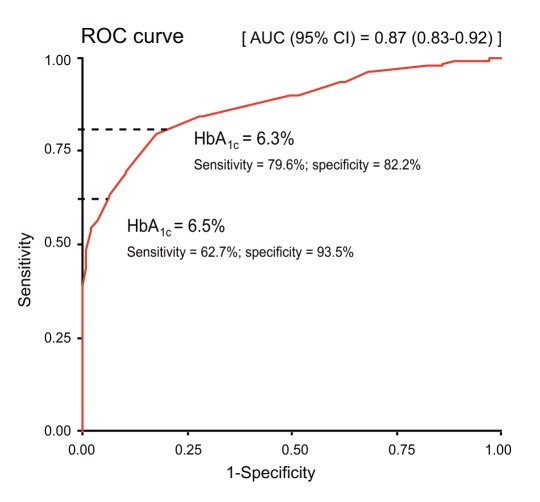
The ROC curve for diabetes diagnosis using HbA1c, with OGTT as the reference standard. ROC, receiver operating characteristic; HbA1c, glycated hemoglobin; OGTT, oral glucose tolerance test; AUC, area under the curve; CI, confidence interval.
DISCUSSION
DM is an important clinical and social health problem. Alarmingly, many undiagnosed subjects remain, who may account for up to 50% of the diabetic population [7]. The onset time of type 2 diabetes has been estimated to be 9 to 12 years before diagnosis. Currently, the OGTT is still the "gold standard" for diagnosing DM and IGR. However, the glucose values obtained by the OGTT are poorly reproducible, and many problems related to the standardization of glucose testing remain [2,8,9]. In addition, the subjects need to receive strict preparation before the OGTT. Due to the above reasons, an increasing demand for adopting HbA1c to diagnose DM has arisen. Recently, the ADA revised their "Clinical Practice Recommendations for the Diagnosis and Treatment of Diabetes" such that HbA1c was recommended for diagnosing diabetes [1]. The International Diabetes Federation, the European Association for the Study of Diabetes, and the World Health Organization have also incorporated HbA1c as an alternative method for diagnosing DM [10].
Our results showed that the comparison of HbA1c levels between any two groups of NGT, IGR, and DM had significant differences (p value < 0.01). This observation might be explained by recent evidence showing that HbA1c could reflect different stages of glucose metabolism [11]. Compared to PG as a point-of-care test, HbA1c reflects the patients' average glycemic status over the past 2 to 3 months and it is not influenced by current diet, drug treatment, and blood sampling time [12-14]. However, many studies have found that ethnicity might influence the level of HbA1c [14-16]. A large international study comparing the relationship between HbA1c and the average PG levels among African Americans and Caucasians showed that African Americans had a higher HbA1c under the same PG level [14].
In our study, the optimal cutoff point for HbA1c in diagnosing DM was 6.3% with a sensitivity and specificity of 79.6% and 82.2%, respectively. In addition, the AUC under the ROC curve was high at 0.87 (95% CI, 0.83 to 0.92). These values are similar to the reported optimal HbA1c cutoff point of 6.2% used by the United Kingdom Prospective Diabetes Study (UKPDS), 6.1% by the DCCT [17], 6.1% by Hu et al. [18] from Shanghai, China, and 6.1% by Mohan et al. [19] in Asian Indians, but higher than that reported by Nakagami et al. [20] from the Japan National Diabetes Survey (5.6%). Our study had 259 subjects whose HbA1c levels were lower than 6.3%. In other words, if only those with HbA1c ≥ 6.3% need to receive an OGTT to confirm their glycemic status, then 52.2% (259/497) of the subjects would not require an OGTT. Currently, the ADA recommends that either HbA1c (≥ 6.5%) or the OGTT can be used as diagnostic criteria for DM. Since HbA1c may be affected by ethnicity, understanding the effectiveness of using HbA1c to diagnose DM in the Chinese population is important. Based on the ROC curve, the sensitivity and specificity were 62.7% and 93.5%, respectively, when using HbA1c ≥ 6.5% to diagnose DM in our population. Similarly, various studies reported that using HbA1c ≥ 6.5% for diagnosis gave a high specificity (> 95%), while the sensitivity was suboptimal (40-50%) [21,22]. Nevertheless, since DM is a serious disease with significant medical implications, a more specific diagnostic approach is necessary to avoid a large number of false positives.
In this study, we enrolled subjects with fasting PG ≥ 5.6 mmol/L (those with IFG) so as to recruit more patients with IGR or DM. Therefore, the HbA1c levels of the subjects may be slightly higher than those of the general community. Among the 497 subjects in our study, 42.9% (n = 213) were diagnosed with diabetes by HbA1c (n = 154), the OGTT (n = 155), or both (n = 96). This particularly high prevalence of diabetes should not be interpreted as the usual rate in the general population in Jiangsu Province. We found that the PG and HbA1c levels were not well correlated in our population, especially among the subjects with DM who were diagnosed by either one but not both criteria. The HbA1c level was higher, while the fasting and 2-hour PG was lower in subjects with DM diagnosed by HbA1c as compared to those diagnosed by the OGTT. This result highlights the importance of validating the recommended HbA1c diagnostic level in different populations before formally adopting it. The International Expert Committee recommended HbA1c ≥ 6.5% as the diagnostic cutoff for DM based on the existence of retinopathy with data from the Evaluation of Screening and Early Detection Strategies for Type 2 Diabetes and Impaired Glucose Tolerance (DETECT-2) Study [10,23]. Our data examined this approach and reported a high specificity of 93.5% with a HbA1c cutoff level of 6.5%, suggesting this newly recommended diagnostic tool could be applicable to the Chinese population, thus validating the recommended standards of the ADA [1]. However, our sample size was relatively small and with a low proportion of women (27.4%). Further studies are needed to confirm our results.
In conclusion, with OGTT as the "gold standard" reference for diagnosing DM in Chinese in Nanjing, the optimal cutoff point of HbA1c was 6.3% with a sensitivity and specificity of 79.6% and 82.2%, respectively. HbA1c ≥ 6.5% has reasonably good specificity (93.5%) for diagnosing diabetes, which is in concordance with the ADA recommendations.
Acknowledgements
This study was funded by the Jiangsu Province Science and Technology Department (SBE201078340) and Jiangsu Province Health Department (H200931).
We would like to express our sincere thanks to the medical and nursing staff of the Diabetes Care and Research Center of Jiangsu Province Institute of Geriatrics for the design and execution of the study and the team members of the Department of Medicine and Therapeutics, Chinese University of Hong Kong, for guidance and comments on writing this article.
Notes
No potential conflict of interest relevant to this article was reported.