Normalization of Negative T-Wave on Electrocardiography and Right Ventricular Dysfunction in Patients with an Acute Pulmonary Embolism
Article information
Abstract
Background/Aims
Right ventricular dysfunction (RVD) is associated with poor prognosis in patients with acute pulmonary embolism (APE). Echocardiography and computed tomography (CT)-angiography may be difficult to perform in a serial follow up, unlike electrocardiography (ECG). Many ECG findings specific for APE have been reported, and many studies have found that negative T-waves (NTW) in precordial leads are most frequently observed in patients with APE. We analyzed serial changes in precordial NTW to detect RVD and predict the recovery of RVD in patients with APE.
Methods
We examined 81 consecutive patients diagnosed with APE using CT-angiography or echocardiography. ECG, transthoracic echocardiography, and laboratory tests were performed within 24 hours of admission, and daily ECG follow-up was performed. Precordial NTWs were defined by the new development of pointed and symmetrical inverted T-waves in at least three leads. Recovery of NTW was defined as flattening or upright inverted T-waves in more than two leads.
Results
Of the 81 patients with APE, 52 (64%) had RVD according to echocardiography. Among the patients with RVD, 33 (63%) showed precordial NTW. The multivariate logistic regression analysis revealed that NTW was the strongest independent predictor for RVD (odds ratio, 22.8; 95% confidence interval, 2.4 to 221.4; p = 0.007). Time to normalization of NTW was associated with improvement of RVD on echocardiography (r = 0.84, p < 0.01).
Conclusions
Precordial NTW was a reliable finding to identify RVD in patients with APE. Improvements in RVD can be predicted by normalizing precordial NTW.
INTRODUCTION
Right ventricular dysfunction (RVD) is associated with a poor prognosis and high mortality rate in patients with an acute pulmonary embolism (APE) [1-9]. Generally, echocardiography has been used to evaluate RVD noninvasively. However, the results of echocardiography (ECG) depend on the experience of the attending physician, and the reproducibility of ECG is limited. Thus, it may be difficult to perform ECG in emergency settings.
Because of its simplicity, widespread availability and low cost, 12-lead ECG has definite clinical advantages for emergency triage of patients with APE [2,3]. Various ECG findings specific to APE have been reported [7,9]. Many studies have reported that precordial negative T-waves (NTW) are most frequently observed in patients with APE [7]. However, only a few studies have examined the relationship between the serial changes in precordial NTW and recovery of RVD in patients with APE. We aimed to determine the role of ECG for identifying RVD and predicting recovery from RVD in patients with APE.
METHODS
Subjects
We examined 81 consecutive patients diagnosed with APE using computed tomography (CT)-angiography or echocardiography from January 2004 to February 2010 at our hospital. Twelve-lead ECG, transthoracic echocardiography, and laboratory tests, including cardiac troponins and B-type natriuretic peptide (BNP) were performed within 24 hours of admission. A daily ECG follow-up was performed.
Electrocardiographic evaluation
ECG parameters during hospitalization were analyzed. At least four recordings were made per day for the first 3 days (generally every 6 hours), then once per day for at least 1 week. Thus, we could observe normalization of NTW on precordial leads. Precordial NTW was defined by the new development of pointed and symmetrical inverted T-waves in at least three leads. Recovery of NTW was defined as flattening or upright inverted T-waves in more than two leads. Other ECG findings previously known to be associated with APE were also analyzed: 1) S1Q3T3, 2) complete or incomplete right bundle branch block (RBBB), 3) sinus tachycardia, 4) peripheral low voltage, and 5) pulmonary P-waves. The S1Q3T3 pattern was defined according to the criteria of McGinn and White (S-wave on lead I- and Q-wave on lead III with an amplitude > 0.15 mV (1.5 mm) associated with inversion of the T-wave on lead III). Complete or incomplete RBBB was defined according to conventional criteria. Sinus tachycardia was defined as an increase in sinus rhythm to > 100 beats/min. Peripheral low voltage was determined when the amplitude of the largest QRS deviation (positivity or negativity) on peripheral leads was < 5 mm. A pulmonary P-wave was determined when its amplitude reached 0.25 mV (2.5 mm) on lead II.
Echocardiographic evaluation
The diagnosis of RVD was confirmed by transthoracic echocardiography. Patients with one or more of the following were considered to have RVD: 1) RV dilatation (end-diastolic diameter > 30 mm in the parasternal long axis view), 2) RV free-wall hypokinesia, 3) paradoxical septal systolic motion, or 4) D-shaped left ventricle. The study population was grouped into patients with and without RVD.
Definition of adverse clinical events
The statistical analysis focused on the in-hospital period. The adverse clinical events were overall mortality and a complicated course, defined as death or one of the following: need for catecholamine blood pressure support, cardiopulmonary resuscitation, or mechanical cardiovascular support (intra-aortic balloon pumping, and percutaneous cardiopulmonary support) due to hemodynamic instability.
Statistical analysis
All values are expressed as mean ± SD, and categorical data are expressed as percentages. An analysis of variance was used for continuous variables. A chi-square analysis was used to compare categorical variables. Multiple logistic regression analysis was used to identify clinical predictors of clinical endpoints among the variables associated (p = 0.2) with endpoints in a univariate analysis. Odds ratios (ORs) and 95% confidence intervals (CIs) were calculated. Differences were considered statistically significant at p < 0.05. Data were analyzed with SPSS version 13.0 (SPSS Inc., Chicago, IL, USA).
RESULTS
Demographics and clinical outcomes
Eighty-one consecutive patients with objectively confirmed APE were considered for the study from January 2004 to February 2010 (Fig. 1). Patients had a mean age of 65 ± 14 years, and 44 (54%) were female (Table 1). Among the 81 patients, 52 (64%) had RVD on echocardiography. The mean values for BNP, creatine kinase, and cardiac troponin were significantly higher in patients with RVD, as compared to those in patients without RVD (Table 1). Most patients presenting with adverse clinical events, such as death, required catecholamine support for blood pressure, cardiopulmonary resuscitation, or mechanical cardiovascular support due to hemodynamic instability (Table 2).
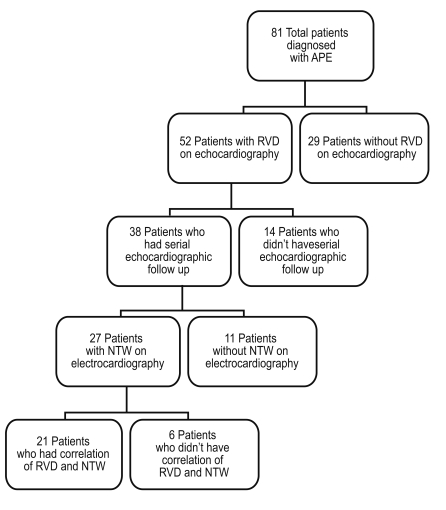
Flow chart of patients included in the study. APE, acute pulmonary embolism; RVD, right ventricular dysfunction; NTW, negative T-wave on precordial leads.
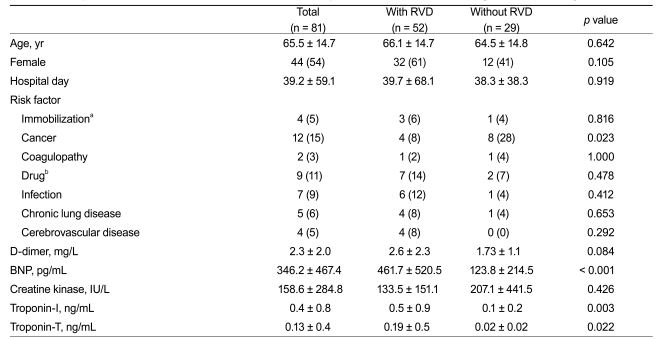
Comparison of baseline characteristics between patients with and without right ventricular dysfunction
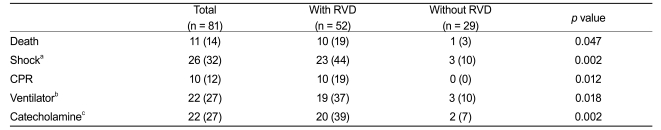
Comparison of adverse clinical events during admission between patients with and without right ventricular dysfunction
Electrocardiographic findings
Among the 81 patients with APE, sinus tachycardia was the most frequent ECG sign (44%) (Table 3). In the 52 patients with RVD, precordial NTW was the most frequent ECG sign (63%), and NTW was significantly more frequent in patients with RVD than in those without RVD (p < 0.0001). Similarly, sinus tachycardia, RBBB, and S1Q3T3 were significantly more frequently observed in patients with RVD than in those without RVD. A multivariate analysis revealed that NTW was associated with RVD (OR, 22.8; 95% CI, 2.4 to 221.4; p = 0.007), and was the most powerful predictor of RVD, as compared to other ECG signs or laboratory findings (Table 4). NTW had a sensitivity of 63.5%, specificity of 96.6%, and diagnostic accuracy of 75.3% to predict RVD.
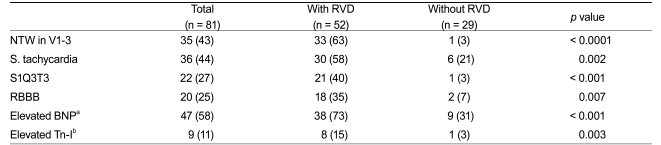
Comparison of electrocardiographic findings and biomarkers between patients with and without right ventricular dysfunction
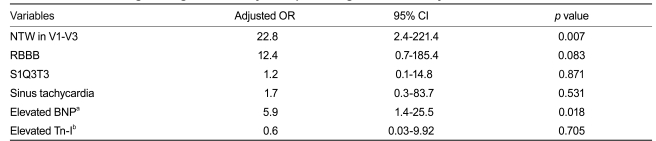
Multivariate logistic regression analysis to predict right ventricular dysfunction
Normalization of negative T-waves and recovery of right ventricular dysfunction
Among the 52 patients with RVD, we selected 27 who underwent serial echocardiographic follow-up and showed NTW on precordial leads. We analyzed recovery from RVD and serial changes in NTW during hospitalization (Fig. 1). Daily ECG follow-up was performed, and 21 patients showed normalized NTWs during hospitalization. Among these 21 patients, follow-up ECG was performed at the time of NTW recovery. Fig. 2 shows the correlation analysis between time to normalization of precordial NTW and time to recovery of RVD on ECG. Notably, time to NTW normalization and recovery of RVD were similar in most patients (correlation coefficient = 0.84, p value < 0.01). In 21 patients, the mean recovery time for RVD was 24.1 days, and the mean NTW normalization time was 23.5 days.

Correlation analysis between time interval to recovery of negative T-wave (NTW) and recovery of right ventricular dysfunction (RVD). Time to normalization of NTW was associated with improvement of RVD on echocardiography (correlation coefficient = 0.84, p value < 0.01).
DISCUSSION
In the present study, we examined well-known ECG findings (NTW, RBBB, sinus tachycardia, and S1Q3T3) of APE and determined their utility to identify RVD. Precordial NTW was the most frequent ECG sign of APE with RVD, consistent with the findings of previous studies [3-5]. Additionally, changes in NTWs were closely related to changes in RVD of APE. In other words, improvement in RVD in patients with APE might be predicted by the disappearance of NTWs on precordial leads (Fig. 3).
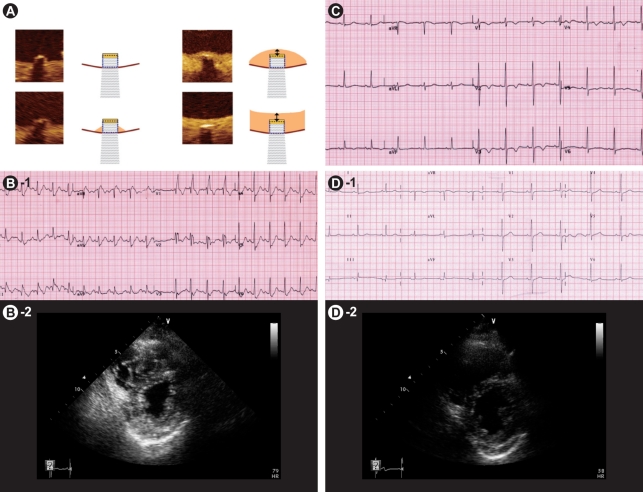
Representative examples of serial changes on electrocardiography (ECG) in a 67-year-old patient with a massive acute pulmonary embolism during admission for multiple bone fractures: (A) Normal ECG on admission. (B) On day 4, she complained of sudden dyspnea and fell into shock. The ECG showed sinus tachycardia and a complete right bundle branch block, and echocardiography showed a dilated right ventricle with right ventricular wall hypokinesia. (C) After thrombolysis, her symptoms and blood pressure improved. Follow-up echocardiography showed persistent right ventricular dysfunction. Note the T-wave inversion on leads V1 to V4. (D) On day 8, the ECG showed normalized T-wave inversion. So, echocardiography was performed and showed normalized right ventricular size and shape.
The mechanism responsible for the appearance of the NTWs in patients with APE is uncertain. It may be associated with the development of acute cor pulmonale, which features rapid right ventricular pressure overload and enlargement [1,2,5]. Some studies have attributed the mechanism of NTW to myocardial ischemia, and the release of various chemical mediators such as catecholamines and histamine [10-13].
In practice, severe myocardial ischemia shows the NTW of involved territory, altering the pathway of electrical repolarization. In contrast, NTW in patients with APE reveals a different pattern with no relation with involved territory, reaching over the left precordial leads. This probably occurs because rapid dilatation of the right ventricle by pressure overload causes both ventricles to shift to the left, subsequently leading to changes in the axis of the conduction system.
Early identification of high-risk patients with RVD by detecting NTW in precordial leads on admission has important therapeutic implications. Additionally, predicting recovery of RVD by the disappearance of NTW is important, because persistent RVD is associated with recurrent thromboembolic events. Grifoni et al. [14] reported that persistence of RVD at hospital discharge occurred in approximately 20% of patients who present with a first episode of APE, and that persistent RVD at hospital discharge after APE is associated with recurrent thromboembolic events. Thus, patients with APE and persistent RVD at discharge should receive strict surveillance for recurrence, and the issue of whether to extend the period of anticoagulation to reduce the risk of thromboembolic recurrence should be considered.
The present study was retrospective, performed at a single center, and included a small number of patients with APE. Furthermore, the timing for the follow-up ECG was not consistent; therefore, the exact time at which the RVD improved could not be confirmed. Further prospective studies with a larger number of patients are required to confirm the usefulness of precordial NTW for guiding the optimal timing of ECG follow-up to confirm improvement in RVD.
In conclusion, our study showed that precordial NTW was reliable for identifying RVD in patients with APE. A close correlation was observed between changes in precordial NTW and RVD recovery. These findings suggest that improved RVD can be predicted by normalizing precordial NTW.
Notes
No potential conflict of interest relevant to this article was reported.