The Progression of Bone Mineral Density Loss in Dialysis Patients Compared with the General Population
Article information
Abstract
Background/Aims
The aim of this study was to compare the progression of bone mass loss in chronic hemodialysis patients (CHPs) with that in general population patients (GPPs) over an 18-month period.
Methods
The control group consisted of 60 patients (aged 57.5 ± 10.9 years) with a glomerular filtration rate > 60 mL/min/1.73 m2. The study group included 80 patients undergoing hemodialysis (aged 59.3 ± 11.8 years; duration of dialysis 5.47 ± 5.16 years). Bone mineral density (BMD) testing was conducted in both groups using dual energy X-ray absorptiometry at hip and lumbar spine regions at baseline and after 18 months. Biochemical parameters (albumin, C-reactive protein, calcium, ionized calcium, alkaline phosphatase, and parathyroid hormone) were determined in all participants using standard laboratory procedures.
Results
The mean values of BMD (average hip + lumbar spine) were 0.900 ± 0.14 g/cm2 and 0.866 ± 0.14 g/cm2 in the GPP and 0.823 ± 0.16 g/cm2 and 0.769 ± 0.13 g/cm2 in the CHP groups at baseline and 18 months, respectively. The statistical significance (p value) of hip bone loss progression over 18 months was 0.0577 for GPP and 0.0002 for CHP, whereas that of lumbar spine bone loss progression was 0.6820 for GPP and 0.5389 for CHP.
Conclusions
The of progression bone mass loss was significantly greater in CHP than in GPP. Bone mass loss was evident even over 1 month, albeit in only the CHP with accelerated osteoporosis.
INTRODUCTION
Low bone mass is common in end-stage renal disease (ESRD) patients, especially those undergoing hemodialysis. ESRD patients usually exhibit accelerated bone loss due to abnormal bone turnover that leads to a high prevalence of bone health problems, e.g., osteopenia and osteoporosis [1,2].
Osteoporosis is defined as a skeletal disorder characterized by compromised bone strength predisposing to an increased risk of fracture [3]. The most common definition is that of the World Health Organization (WHO), which defines osteoporosis on the basis of bone mineral density (BMD) measurements applied to the lumbar spine or femoral neck.
Nowadays, dual energy X-ray absorptiometry (DEXA) is the most recommended method for estimating BMD because of its high precision and accuracy, as well as its short scan time and low radiation dose.
The aim of this study was to compare the progression of bone mass loss in chronic hemodialysis patients (CHPs) with that of general population patients (GPPs) over an 18-month period.
METHODS
Patients
The control group (CG) consisted of 60 patients selected from a base of 150 patients from general populations (GPs) by proportionate sampling strategies that began by stratifying the GP into relevant subgroups. The number of participants recruited from each subgroup was equal to their proportion in the population according to predefined criteria: age, smoking, diabetes, and hypertension. The group consisted of 36 males and 24 females aged 57.5 ± 10.9 years, their mean body mass index (BMI) was 27.8 ± 4.41 kg/m2. Eighteen patients were smokers, 24 were hypertonic, and 12 were diabetics. Exclusion criteria were reduced glomerular filtration rate ≤ 60 mL/min/1.73 m2 estimated by the modification of diet in renal disease formula. Two patients from the GP with lethal outcomes during the 18-month period of examination were excluded from the study.
The study group (SG) included 80 patients undergoing hemodialysis (53 males and 17 females, aged 59.3 ± 11.8 years, their mean BMI was 23.5 ± 3.6). Twenty patients were smokers, 37 were hypertonic, and 16 were diabetics. The mean duration of dialysis was 5.47 ± 5.16 years. All subjects were on dialysis therapy for at least 3 months. Thirteen patients on dialysis who died during the 18-month period of examination were excluded from the study.
All participants signed an informed consent and the study was approved by the ethics committee of our institution.
Assessment
In both groups (the CG is referred to as the "GPPs" group and the SG as the "CHPs" group) we conducted BMD testing using DEXA at the beginning of the study (baseline) and after 18 months. DEXA scans were performed using a Hologic Delphi QDR4500A/SL system (Hologic Inc., Fort Myers, FL, USA). BMD was measured by DEXA in the lumbar spine and hip. Two X-ray beams with differing energy (about 140 kVp and 14.3 mAs) were used for measurement of BMD. The BMD was determined based on the absorption of each beam by bone after subtraction of the absorption of soft tissue [4,5].
For assessment of the spine, the patient's legs were supported on a padded box to flatten the pelvis and lower the (lumbar) spine. For assessment of the hip, the patient's foot was placed in a brace that rotates the hip inward. In both cases, the detector was passed slowly over the area, generating images on a computer monitor [5].
Absolute BMD values, Z-scores (number of standard deviations [SDs] below an average person of the same age) and T-scores (number of SDs below the BMD of a younger reference group) of the lumbar spine and right femoral neck were recorded as BMD (g/cm2), T-score and Z-score (for femoral neck, total and L1 to L4 region). The WHO defined the following categories based on bone density in Caucasian females: normal bone, T-score greater than -1; osteopenia, T-score between -1 and -2.5; osteoporosis, T-score less than -2.5.
Biochemical parameters and bone metabolism marker levels (albumin, C-reactive protein, calcium, ionized calcium, alkaline phosphatase, and parathyroid hormone [PTH]) were determined in all participants using standard laboratory procedures performed on a Cobas Mira S Analyzer (Roche Diagnostics, Holliston, MA, USA).
Statistical analysis
The data were analyzed using IBM SPSS version 20.0 (IBM, Armonk, NY, USA). Results are expressed as means ± SD or percentage. Student's t test for unpaired data was used to compare the GPP and the CHP groups. A paired t test and repeated measures ANOVA were used to compare baseline and 18-month data within a group. Simple linear regression analysis was performed to assess the associations between dependent and independent variables.
RESULTS
The numerical differences in the composition of both groups between baseline and 18 months were due to deaths: 13 patients on dialysis and two in the general group, resulting in totals of 67 patients in the CHP versus 58 in the GPP group. The demographic characteristics of both groups are presented in Table 1.
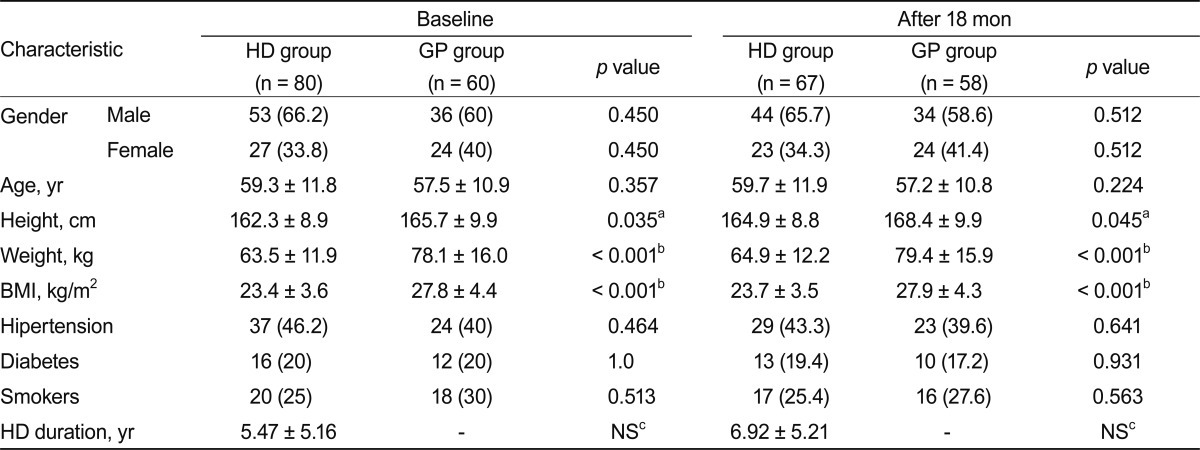
The demographic characteristic of studied patients
The average femur neck bone mass loss in the GPP group was 0.056 g/cm2 during the investigated period of 18 months, or 3.11 mg/cm2 per month. Loss of bone mass in the CHP group for the same localization and period was 0.092 g/cm2, or 5.11 mg/cm2 per month. The average lumbar spine bone mass loss in the GPP group was 0.012 g/cm2 over the 18-month period, or 0.66 mg/cm2 per month; whereas the bone mass loss in the CHP group for the same localization and period was 0.016 g/cm2, or 0.89 mg/cm2 per month.
Absolute BMD values, T-scores, and Z-scores obtained by DEXA for the GPP and CHP groups at both time points are presented in Figs. 1 and 2.

General population patient absolute bone mineral density (BMD) values, T-scores, and Z-scores obtained dual energy X-ray absorptiometry data in both scanned periods. Values are presented as mean ± SD or range (highest and lowest value). F, femur; L, lumbar.
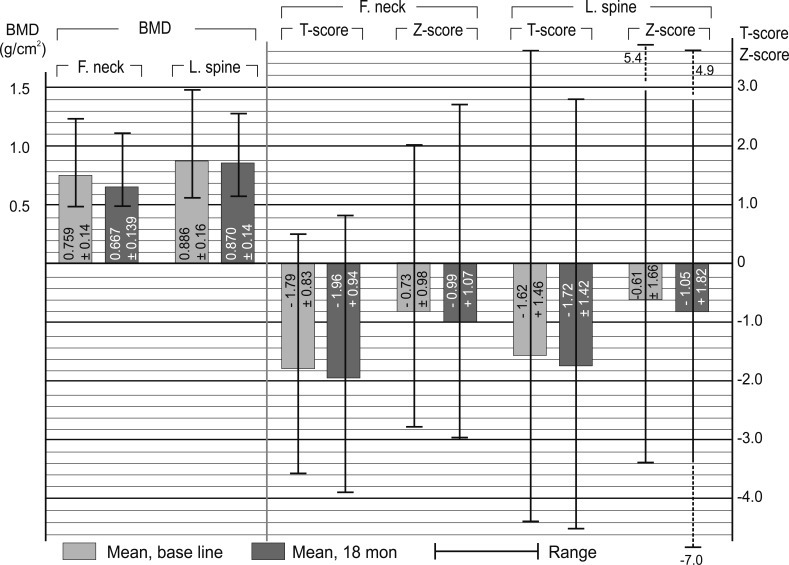
Chronic hemodialysis patient absolute bone mineral density (BMD) values, T-scores, and Z-scores obtained dual energy X-ray absorptiometry data in both canned periods. Values are presented as mean ± SD or range (highest and lowest value). F, femur; L, lumbar.
The mean femoral neck and lumbar spine BMDs were 0.900 ± 0.14 g/cm2 at baseline and 0.866 ± 0.14 g/cm2 after 18 months in the GPP group, and 0.823 ± 0.16 g/cm2 at baseline and 0.769 ± 0.13 g/cm2 after 18 months in the CHP group. The two-tailed p value (between femoral neck BMD at baseline and after 18 months) was 0.0577 for the GPP group and 0.0002 for the CHP group; whereas that between lumbar spine BMD at baseline and after 18 months was 0.6820 for the GPP group, and 0.5389 for the CHP group.
At baseline, there were 12 CHP subjects with osteoporosis (T-score < -2.5); this number increased to 20 after 18 months. The correlation between BMI and BMD was; r = -0.36 (p = 0.005). The mean BMD of males (after matching by hemodialysis duration, 2 to 10 years) was 0.804 ± 0.14 g/cm2, whereas that of females was 0.675 ± 0.085 g/cm2.
Comparisons of hip and lumbar spine BMD between the GPP and CHP groups (f test for equal variances, statistical t test, and coefficient of two-tailed probability p) are presented in Fig. 3.
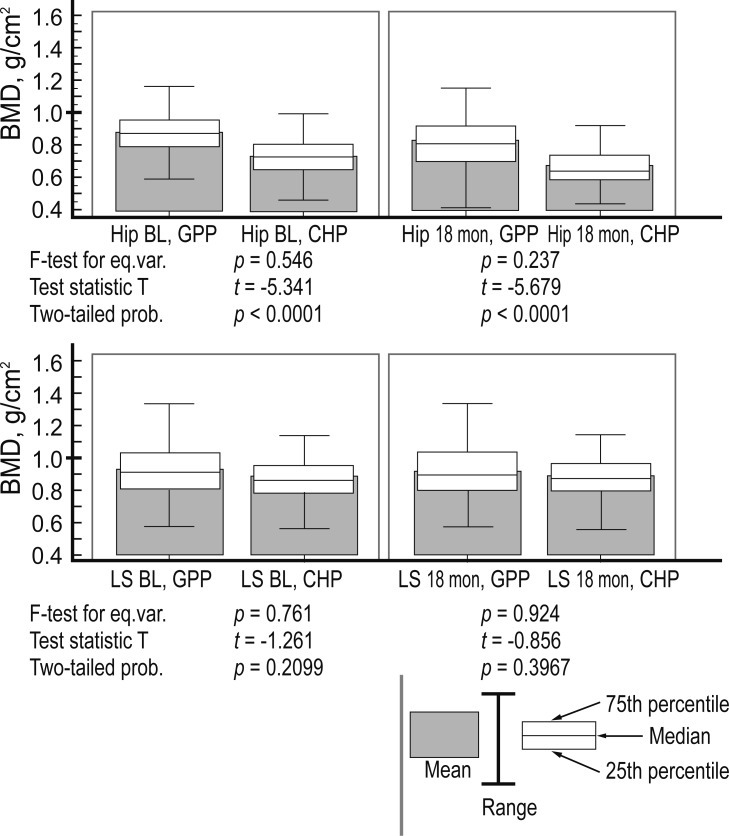
A t test for unpaired data between general population patient (GPP) and chronic hemodialysis patient (CHP) groups. BMD, bone mineral density; BL, base line; LS, lumbar spine; eq. var., eqyal variances; prob., probability.
Within the CHP group, the hip BMD between baseline and 18 months showed a p < 0.001 and f = 32.99 (Greenhouse-Geisser, G-G); the lumbar spine BMD between baseline and 18 months showed a p < 0.9797 and f = 0.00065 (G-G). Among the GPP group, the hip BMD results between baseline and 18 months showed a p < 0.001 and f = 32.12 (G-G), while those of the lumbar spine BMD were p < 0.240 and f = 1.41 (G-G).
Levels of laboratory markers involved in bone metabolism (albumin, C-reactive protein, calcium, ionized calcium, alkaline phosphatase, and PTH) are presented in Table 2. The values are listed separately for the CHP and GPP groups at baseline and after 18 months. The correlation of each parameter with lumbar spine BMD is presented as simple linear regression indexes r and p.
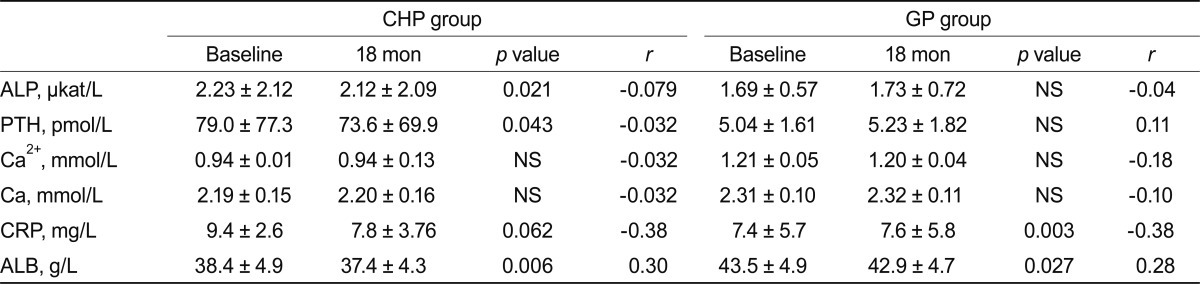
Correlation between laboratory markers and lumbar spine bone mineral density in chronic hemodialysis patient (CHP) and general population (GP) group
DISCUSSION
We compared the progression of bone mass loss in CHPs and GPPs over an 18-month period. Is it true that bone mass loss is much more pronounced among hemodialysis patients? Significant hyperparathyroidism; i.e., serum PTH > 70 pmol/L according to the guidelines, is usually associated with high bone turnover, and leads to low BMD in patients on hemodialysis. Bone density is not decreased in low bone-turnover states, as assessed by biochemical markers. There is a negative correlation between real bone turnover and mineral density [6]. In the current study, the CG (GPP) did not include a young healthy population; it consisted of participants selected from the GP that are not spared from the normal process of atherosclerosis, aging, and osteoporosis. The patients in this group had functioning kidneys, to exclude the influence of renal comorbidity.
In this bone DEXA densitometry-based study, we detected a high prevalence of osteoporosis in a relatively young hemodialysis patient population. Bone loss likely begins much earlier and progresses more rapidly in hemodialysis patients. Over a relatively short time (18 months), bone loss was more pronounced at the femoral neck region tha n the lumbar region (p = 0.0002). We found a moderate reduction in mean BMD in this unselected population of CHPs. The mean Z-score of (-0.4) obtained by DEXA measurement of the femoral neck implies that these patients were only moderately worse off than their age-matched controls. The loss of femoral bone mass in the GPP was less pronounced and showed weak statistical significance (p = 0.0577). Loss of femoral neck bone mass in the CHP group was twice that of the GPP group in terms of the monthly absolute loss of density, expressed in mg/cm2. The lumbar spine BMD was greater than the femoral neck BMD; this difference was greater in the CHP group. The reason for the greater BMD in the spine than the femoral neck may lie in the fact that DEXA relies on measurement of the relative absorption of dual energy X-ray beams projected blindly through the body. The X-ray beams could be absorbed by densely calcified aorta rather than the spine, causing a falsely elevated BMD reading [6,7]. The difference in bone density between the spine and femoral neck was less evident in the GPP group than in the CHP group; likely due to the smaller degree of aortic calcification in the GPP resulting in low absorption of the X-ray beam, leading to an elevated BMD value. However, the average absolute bone density was obtained as the sum of the hip and spine bone densities [3,8].
In the GPP group, only factors associated with the genesis of osteoporosis in the elderly were evident, but in chronic kidney disease (CKD) patients, osteoporosis is accelerated due to the synergism of age and factors related to renal comorbidity. Age and weight emerged as important determinants of BMD in our study. Age-related bone loss plays an important role in the pathogenesis of osteoporosis and has been shown to occur in normal adults at a rate of 2% to 3% annually after the age of 42 years, increasing to 3% to 5% for 6 to 9 years following menopause in females [9,10]. The results of several studies of dialysis patients showed a negative association between age and BMD in female, but not male, patients with ESRD. We identified a similar association among our patients. Most studies in hemodialysis patients have not assessed patient weight. Only two studies (including ours) reported an association between BMI and BMD results (p = 0.005). Furthermore, many studies of BMD in dialysis patients have not examined the effect of gender. One previous study found no difference between the rate of bone loss in males and females [11]. In the current study, after hemodialysis duration matching, we observed a high rate of bone loss in females and a low rate of bone loss in males.
BMD measurements are most frequently made using DEXA technology. This imaging method is generally applied to the spine and hip; however, the spine presents problems in CKD due to the misleading BMD elevation in the anterior-posterior projection due to the aortic calcification that is observed frequently in CKD patients. In addition, spinal osteophytes and aortic calcification (both common findings in CKD patients) may interfere with the accuracy of DEXA lumbar spine BMD measurements. Measurements of BMD at the hip and radius may provide better precision with fewer artifacts. Other limitations of the current study include the small number of participants and relatively short follow-up period.
In conclusion, the progression of bone mass loss was significantly greater in the CHP group than in the GPP group over an 18-month period. Bone mass loss was evident on even a monthly basis, albeit in only CHP with accelerated osteoporosis. Progression in the GPP group was very slow, with no statistical significance during the relatively short period of examination.
Acknowledgments
My deepest gratitude to supervisor of my manuscript, Prof. Kosta Sotiroski, professor of statistics, Faculty of Economics, Prilep, R. Macedonia, who generously helped me by giving me advice about statistical methods. I am grateful to him for transferring great part of his valuable experience to me.
Notes
No potential conflict of interest relevant to this article is reported.