Elevated thyroid stimulating hormone levels are associated with metabolic syndrome in euthyroid young women
Article information
Abstract
Background/Aims
The existence of an association between thyrotropin (thyroid stimulating hormone, TSH) levels and metabolic derangement in euthyroid subjects is controversial. We examined the association between high normal TSH levels and metabolic syndrome in healthy young women.
Methods
The study recruited 2,760 young female volunteers (age, 18 to 39 years) with TSH levels in the normal range (0.3 to 4.5 mU/L). We defined metabolic syndrome using the 2007 International Diabetes Federation criteria. Using a TSH level of 2.5 mU/L as an upper reference limit, as recommended by the National Academy of Clinical Biochemistry, we divided the subjects into high-(n = 453) and low-TSH groups (n = 2,307).
Results
The prevalence of metabolic syndrome was significantly higher in the high-TSH group than in the low-TSH group (7.5% vs. 4.8%, p = 0.016). Central obesity (22.3% vs. 17.3%, p = 0.012) and hypertriglyceridemia (8.0% vs. 4.2%, p = 0.0007) were significantly more frequent in the high-TSH group than in the low-TSH group. Waist circumference, systolic and diastolic blood pressure, and triglycerides were significantly associated with the TSH level after adjusting for age and body mass index (BMI). Subjects in the high-TSH group had a 2-fold greater risk of metabolic syndrome than subjects in the low-TSH group after adjusting for age and BMI (odds ratio, 1.9; 95% confidence interval, 1.1 to 3.2).
Conclusions
Healthy young women with TSH levels > 2.5 mU/L should be assessed for the presence of metabolic syndrome, even if their TSH levels are in the normal range.
INTRODUCTION
Metabolic syndrome, a cluster of disorders including central obesity, glucose intolerance, hypertension, and dyslipidemia, has been used to identify individuals at risk of cardiovascular disease (CVD) [1,2].
Thyroid dysfunction is a risk factors for CVD mediated by the effects of thyroid hormones on lipid metabolism and blood pressure [3-5]. Some studies have shown that insulin resistance (IR) or hyperinsulinemia is associated with overt or subclinical hypothyroidism and metabolic syndrome [5-7]. However, the existence of an association between slightly elevated thyroid stimulating hormone (TSH) levels that are still within the normal range and metabolic derangement remains controversial.
The prevalences of subclinical hypothyroidism and metabolic syndrome tend to increase with age [1,8]. CVD risk increases markedly in the postmenopausal period because of the sudden decline in the protective effect of estrogen in women [9]. Many studies have revealed an association between subclinical hypothyroidism and metabolic syndrome or cardiovascular risk factors in postmenopausal women [10,11] but there are a few similar studies in children or adolescents [12,13]. However, no studies have examined the association between thyroid hormone levels and metabolic syndrome in young women of reproductive age.
In 2003, the National Academy of Clinical Biochemistry (NACB) recommended lowering the upper reference limit of TSH to 2.5 mU/L based on a large-scale epidemiological survey that revealed that more than 95% of normal individuals have TSH levels < 2.5 mU/L and that those with higher TSH levels are likely to have various thyroid disorders [8,14-16].
In this study, we examined the associations between high normal TSH levels and metabolic syndrome and IR. We also assessed the clinical implications of using a TSH level of 2.5 mIU/L as the upper limit of normal for detecting metabolic disturbances in healthy young women.
METHODS
Study subjects
Between 2008 and 2010, we surveyed the health and nutritional status of women younger than 40 years living in Seoul, South Korea. Participants were recruited using newspaper and online advertisements. Of the 2,950 subjects who voluntarily participated in this study, we excluded 140 subjects because they were younger than 18 years; these subjects were excluded because the test results for adolescent girls may have different clinical implications than those for adult women. We wished to focus on subjects with TSH levels in the normal range (0.3 to 4.5 mU/L), and so 50 subjects with TSH levels < 0.3 or > 4.5 mU/L were also excluded. Ultimately, data from 2,760 subjects were used in this analysis. Based on the new upper normal limit of TSH from the NACB guidelines [8], we divided the study subjects into high-(TSH, 2.6 to 4.5 mU/L; n = 453) and low-(TSH, 0.3 to 2.5 mU/L; n = 2,307) TSH groups.
The Institutional Review Board of Ewha Womans University Mokdong Hospital approved this study. Informed consent was obtained from all participants. We certify that all applicable institutional and governmental regulations concerning the ethical use of human volunteers were followed during this study.
Clinical, anthropometric, and laboratory measurements
None of the subjects had been prescribed any medications for hypertension, dyslipidemia, or diabetes mellitus, or any antithyroid medications, thyroid hormone, or estrogen replacement therapy. Weight and height were measured with the subjects wearing light clothing and no shoes; the body mass index (BMI) was also calculated (kg/m2). The waist circumference was measured on bare skin during midrespiration at the narrowest indentation between the 10th rib and iliac crest to the nearest 0.1 cm.
The fasting plasma glucose (FPG) and 2-hour post-load plasma glucose (2 hr-PG) levels were obtained using a standard 75-g oral glucose tolerance test (OGTT). The fasting plasma insulin (FPI) and 2-hour post-load plasma insulin (2 hr-PI) concentrations were measured using a human insulin-specific radioimmunoassay double antibody kit (Diagnostic Products, Los Angeles, CA, USA). The areas under the curve (AUC) for glucose and insulin were calculated using the trapezoidal rule. A homeostasis model analysis of IR (HOMA-IR) was calculated as FPG (mmol/L) × FPI (µU/mL) / 22.5 [17]. The OGTT-derived metabolic clearance rate (MCR) of glucose was calculated as reported by Stumvoll et al. [18] and was used as an insulin sensitivity index.
Statistical analyses
The data analysis was performed using SAS version 9.1 (SAS Institute, Cary, NC, USA). All data were expressed as means ± standard deviation (SD). Student's t test was used to compare differences between various parameters. Pearson's correlation coefficients were calculated to determine the strength of the associations. Multiple linear regression analysis was performed to evaluate the association of TSH and metabolic parameters. Model 1 is the crude model; model 2 includes age; model 3 includes age and BMI; and model 4 includes age, BMI, and HOMA-IR. Since insulin, triglycerides (TG), high density lipoprotein cholesterol (HDL-C), and HOMA-IR showed slightly skewed distributions, the p values are based on logarithmic data, while the mean values are presented as untransformed data. All p values were 2-tailed, and statistical significance was defined as p < 0.05.
RESULTS
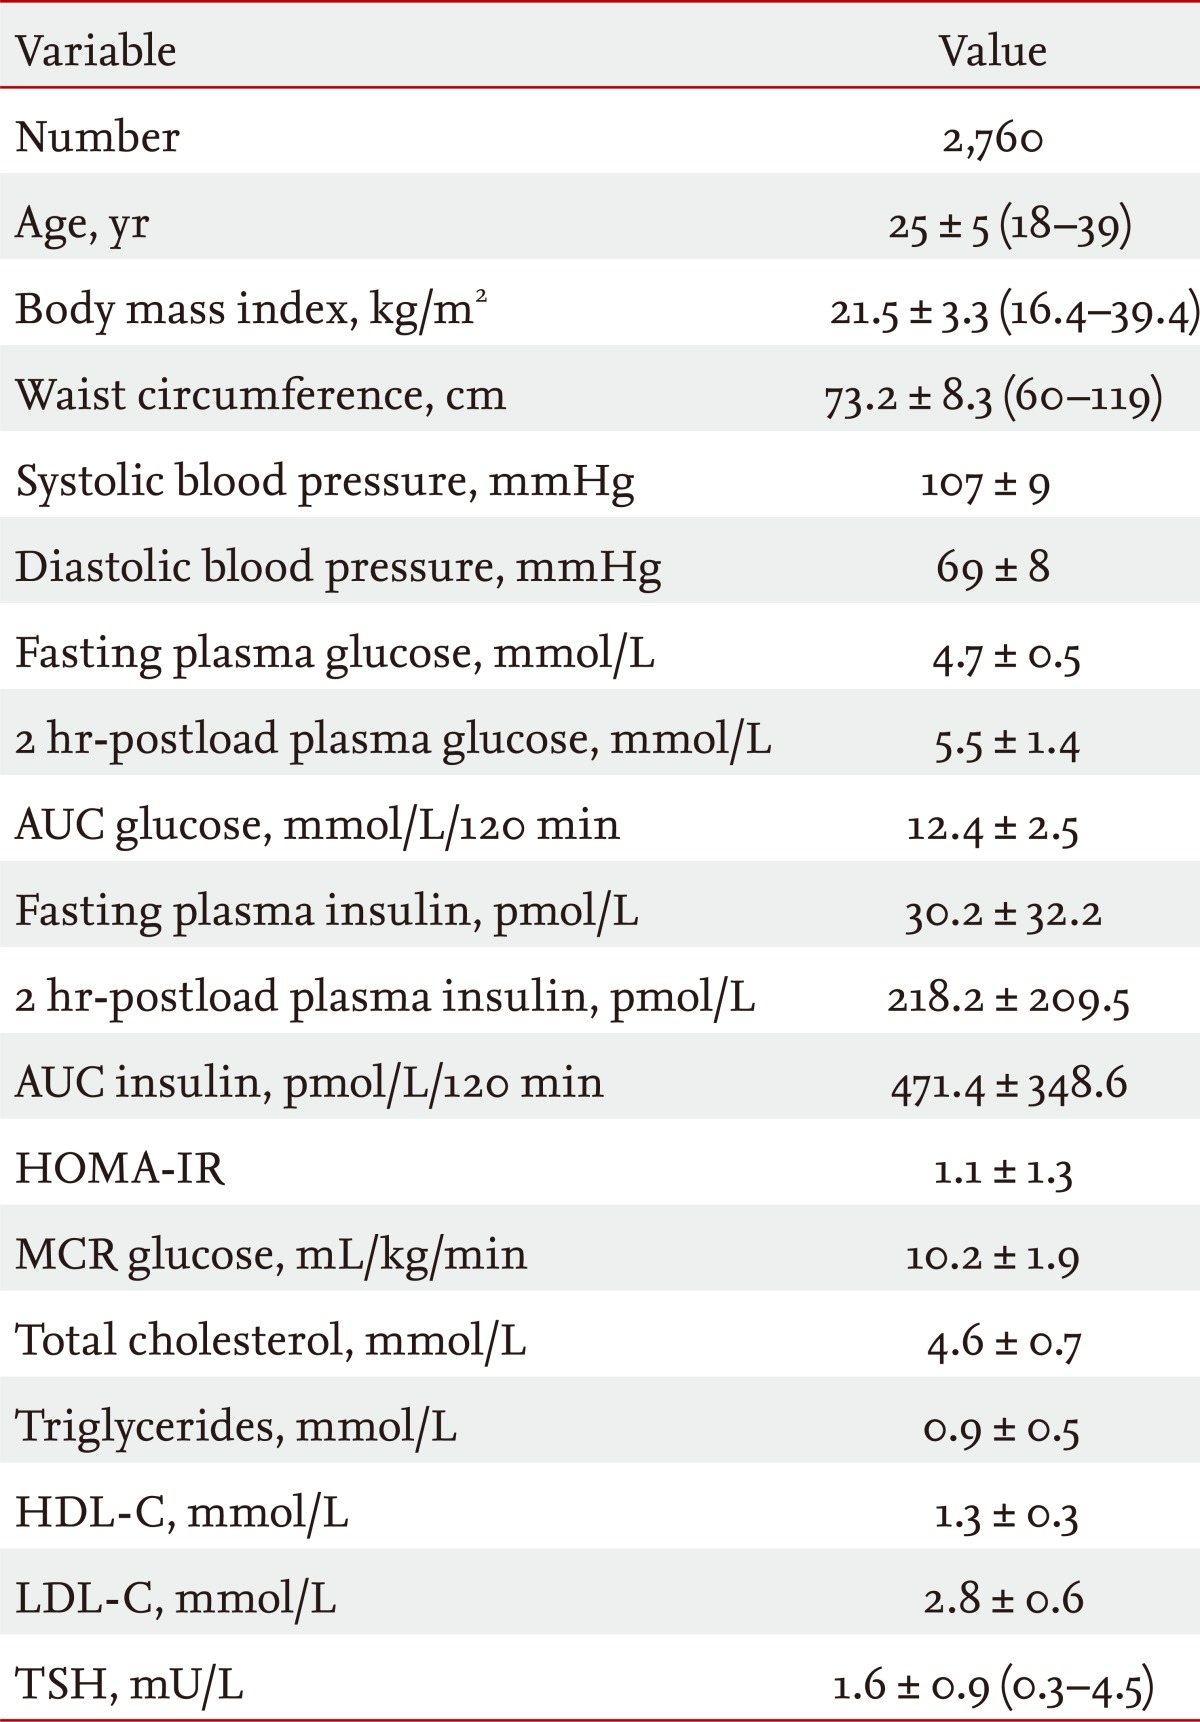
Table 1 shows the clinical characteristics of the 2,760 study subjects. The mean age was 25 ± 5 years (range, 18 to 39), and the mean BMI was 21.5 ± 3.3 kg/m2 (range, 16.4 to 39.4). The overall age-adjusted prevalence of metabolic syndrome was 5.2%. Table 2 shows that the prevalences of metabolic syndrome (7.5% vs. 4.8%, p = 0.016), central obesity (22.3% vs. 17.3%, p = 0.012), and hypertriglyceridemia (8.0% vs. 4.2%, p = 0.0007) were significantly higher in the high-TSH group than in the low-TSH group. Among all of the subjects, TSH levels were significantly positively correlated with age, BMI, waist circumference, systolic and diastolic blood pressure, 2 hr-PG, glucose AUC, 2 hr-PI, total cholesterol, and TG and negatively correlated with the MCR (Table 3).
Metabolic characteristics of the subjects

Prevalence of metabolic syndrome and its components

Correlation coefficients (r) of thyroid stimulating hormone with metabolic parameters
The association of TSH levels with the presence of metabolic syndrome components was assessed using multiple linear regression analysis (Table 4): model 1 unadjusted; model 2 adjusted for age; model 3 adjusted for age and BMI; and model 4 adjusted for age, BMI, and HOMA-IR. Higher TSH levels were associated with increased waist circumference, systolic and diastolic blood pressure, and TG in models 1 to 3 and with increased TG in all models. Multiple logistic regression analysis revealed that the age- and BMI-adjusted odds ratio that predicted the presence of metabolic syndrome was 1.9 (95% confidence interval, 1.1 to 3.2) for the high-TSH group relative to the low-TSH group (data not shown).
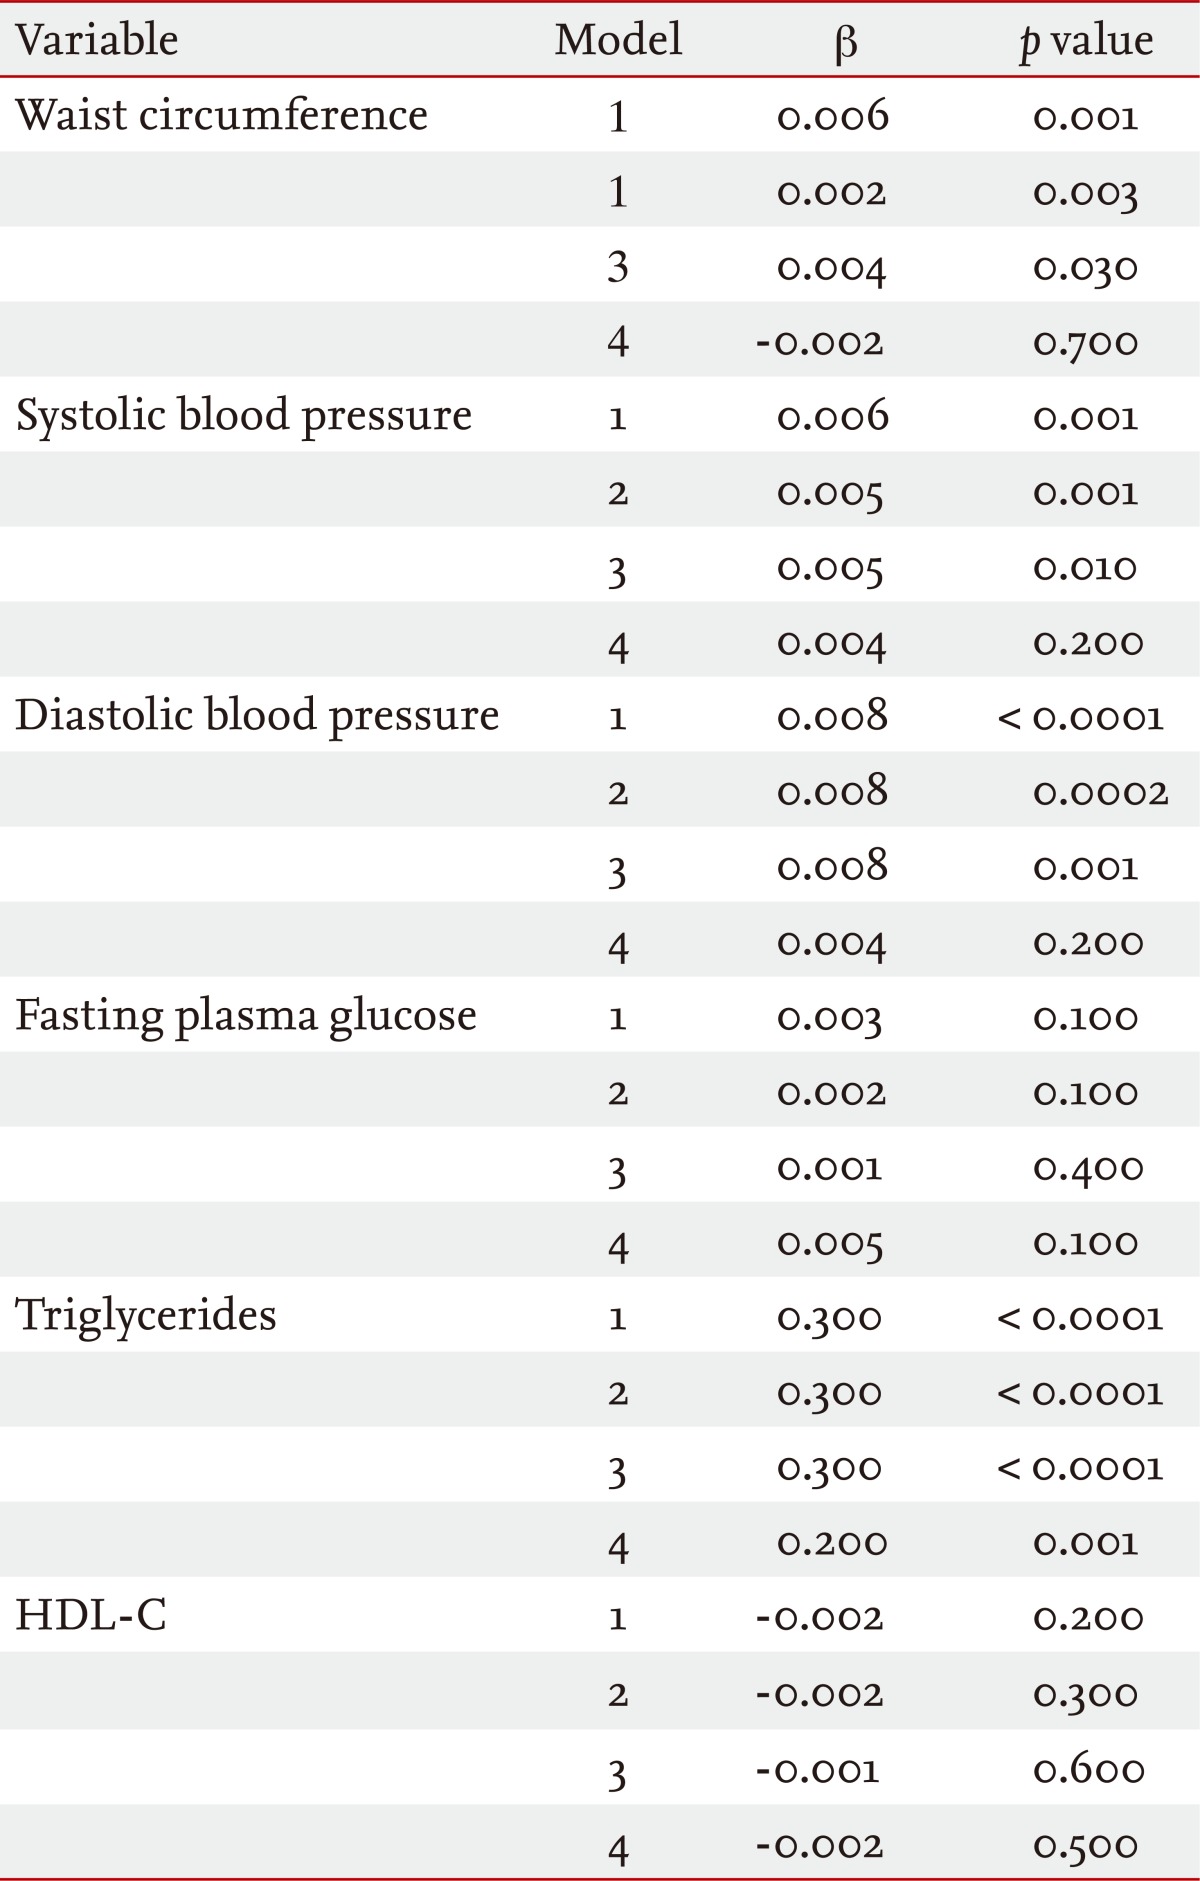
Association of thyroid stimulating hormone as an independent variable with metabolic parameters by multiple linear regression analyses
DISCUSSION
In this study, we observed that increased TSH levels within the normal range were significantly correlated with various metabolic syndrome parameters and IR/hyperinsulinemia in 2,760 healthy young Korean women. The prevalence of metabolic syndrome was significantly higher in subjects with TSH levels > 2.5 mU/L than in the low-TSH group. Of the metabolic syndrome components, central obesity, and hypertriglyceridemia were significantly higher in the high-TSH group.
The relationship between obesity and thyroid dysfunction is complex and still not clear. Since thyroid hormones modulate many metabolic pathways relevant to the resting energy expenditure, hypothyroidism is associated with modest weight gain [19,20]. Many previous studies have demonstrated a positive correlation between the TSH level and BMI in obese subjects, although the TSH levels were within the normal range [21-23]. Possible causes of increased TSH levels in obese individuals include neuroendocrine dysfunction, leptin-induced hypothalamic-pituitary axis alteration, and thyroid hormone resistance due to partially bioinactive TSH protein [24,25]. Many cross-sectional and longitudinal studies have reported a correlation between TSH and leptin, and the circulating leptin levels are correlated with body adiposity and IR [19,22-24]. Therefore, leptin might have an important role in the link between TSH and obesity, possibly via IR.
Since thyroid hormones regulate the hepatic lipoprotein production, TSH might be associated with unfavorable serum lipid concentrations, especially if the TSH level is > 10 mU/L [26] or if the TSH level is within the reference range [27,28]. Our finding of a positive association between the TSH and TG levels was consistent with other results. A population-based study observed that elevated TSH levels within the reference range were associated with less favorable lipid levels, and this correlation was linear across the entire reference range of TSH [29]. High TG levels might result from the reduced activity of lipoprotein lipase or the impaired clearance of lipoproteins dependent on LDL receptor function in individuals with hypothyroidism [29,30]. Our study was limited because we did not measure thyroid autoantibodies. Michalopoulou et al. [31] reported that subjects with high-normal TSH (2.0 to 4.0 mU/L) with positive thyroid autoantibodies had higher serum cholesterol levels than those without thyroid autoantibodies. Therefore, it is possible that our subjects in the high-TSH group showing a higher frequency of dyslipidemia had thyroid autoantibodies and subclinical hypothyroidism.
We identified a positive, linear association between systolic and diastolic blood pressure and TSH level. However, the prevalence of hypertension did not differ between the high- and low-TSH groups. Although hypothyroidism can cause hypertension, many researchers have reported controversial results regarding the relationship between elevated TSH levels and blood pressure, and most studies did not find a significant association [32-34].
We observed that the prevalence of impaired fasting glucose (IFG) was quite low and not significantly different between the high- and low-TSH groups. Data from the 2007 to 2009 Korea National Health and Nutrition Surveys showed that the prevalence of IFG was 9.7% in 30- to 39-year-old women [35]. Considering the younger age of our study subjects (18 to 39 years), the low frequency of IFG observed in this study is not surprising. This is consistent with many other reports that did not find an association between fasting glucose levels and TSH levels within the normal range. Although the frequency of IFG was not associated with increased TSH levels, we observed a significant correlation between TSH and both the 2 hr-PG and glucose AUC, suggesting that elevated TSH levels are associated with hyperglycemia or impaired glucose tolerance.
Since IR is the key pathophysiological component of metabolic syndrome, its accurate measurement is mandatory. However, the hyperinsulinemic euglycemic clamp test, the gold standard for assessing IR, is impractical clinically. HOMA is an easily applied method, but its accuracy is not clear [36]. Therefore, we used the MCR of glucose from the OGTT as an insulin sensitivity index in addition to HOMA, and the MCR was significantly correlated with the TSH level, while HOMA was not. Although the association between TSH and IR is assumed, many studies have reported inconsistent results, which could be due to the use of HOMA alone as an IR index.
Recent laboratory guidelines from the NACB cited clinical research showing that more than 95% of normal Caucasian subjects had TSH levels < 2.5 mU/L, and these guidelines suggested lowering the upper normal limit to 2.5 from 4.5 mU/L [8]. In our study, the mean and SD of TSH were 1.6 and 0.9 mU/L, respectively, and the mean + 1 SD was 2.5 mU/L, which is identical to the new lower upper limit of the reference range. Healthy young women with TSH levels > 2.5 mU/L had about a 2-fold increased risk of metabolic syndrome relative to those women with TSH levels < 2.5 mU/L. Therefore, our data support the lowering of the upper limit of the normal range to 2.5 mU/L.
In summary, we identified a significant association between elevated TSH levels within the normal range and metabolic syndrome in healthy young Korean women. Among the metabolic syndrome components, waist circumference, systolic and diastolic blood pressure, and TG were significantly associated with TSH levels, while fasting hyperglycemia and low HDL-C levels were not. Women with TSH levels > 2.5 mU/L had an approximately 2-fold greater risk of metabolic syndrome than those with TSH levels < 2.5 mU/L.
We suggest that healthy young women with TSH levels > 2.5 mU/L be assessed for the presence of metabolic syndrome, even if their TSH levels are in the normal TSH range.
KEY MESSAGE
1. Hypothyroidism is known to be associated with metabolic syndrome in relation to the insulin resistance.
2. Within the normal range of thyroid stimulating hormone (TSH), high TSH group had a 2-fold greater risk of metabolic syndrome than those with low TSH levels in this study.
3. Healthy young women with TSH levels greater than 2.5 mU/L should be assessed for the presence of metabolic syndrome even TSH levels are in the normal range.
Acknowledgements
This study was supported by grant from 2012 Ewha Global Top 5.
Notes
No potential conflict of interest relevant to this article is reported.