Metabolic syndrome criteria as predictors of subclinical atherosclerosis based on the coronary calcium score
Article information
Abstract
Background/Aims
The aim was to determine which of three sets of metabolic syndrome (MetS) criteria (International Diabetes Federation [IDF], National Cholesterol Education Program Adult Treatment Panel III [ATP III], and European Group for the Study of Insulin Resistance [EGIR]) best predicts the coronary artery calcification (CAC) score in a cross-sectional study. This has not been evaluated in previous studies.
Methods
A total of 24,060 subjects were screened for CAC by multi-detector computed tomography. The presence of CAC was defined as a CAC score > 0. The odds ratio for the presence of CAC was analyzed for three different sets of MetS criteria and according to number of MetS components.
Results
CAC was observed in 12.6% (3,037) of the subjects. Patients with MetS, as defined by the IDF, ATP III, and EGIR criteria, had a CAC rate of 23.0%, 25.1%, and 29.5%, respectively (p < 0.001). Comparisons of C statistics for multivariate regression models revealed no significant difference among the three sets of criteria. After adjustment for risk factors, the ATP III criteria produced a slightly higher odds ratio for CAC compared with the other criteria, but this difference was not significant. The risk factor-adjusted odds ratio for the presence of CAC increased from 1 to 1.679 as the number of MetS components defined by ATP III increased from 0 to ≥ 3 (p for trend < 0.001).
Conclusions
The presence of MetS was associated with the presence of CAC. There was no significant difference among the three sets of MetS criteria in terms of the ability to predict CAC. An increase in the number of MetS components was associated with an increased odds of CAC.
INTRODUCTION
Metabolic syndrome (MetS), as characterized by insulin resistance (IR), has recently gained considerable attention due to the link among metabolic diseases, obesity, and cardiovascular disease [1]. Many international organizations and expert groups have attempted to define MetS, and several different definitions exist [2,3]. Kim and Kim [4] used data from KNHANES to show that that prevalence of MetS varied greatly depending on the definition used.
Coronary artery calcification (CAC) can predict the risk of cardiovascular events [5]. Previous studies reported that the total amount of coronary calcium (usually expressed as the Agatston score) can predict coronary artery disease beyond the standard risk factors [6]. Patients with MetS have a high risk of CAC [7,8]. MetS, as defined by the National Cholesterol Education Program Adult Treatment Panel III (ATP III), was also independently associated with CAC in type 2 diabetes mellitus [7]. Furthermore, the Multiple Ethnic Study of Atherosclerosis showed that IR, as defined by the homeostasis model assessment of insulin resistance (HOMA-IR), can predict CAC incidence and progression [9].
Despite the clear association between MetS and CAC, it is not clear which MetS criteria best predict CAC. This study examined CAC predictability and prevalence according to three commonly used sets of MetS criteria. Similar analyses were also performed according to the number of MetS components.
METHODS
Study population
This cross-sectional study analyzed 24,062 subjects screened for CAC in an annual health check-up at the Heath Screening Center of Kangbuk Samsung Hospital from 2010 to 2011. Subjects underwent cardiac multi-detector computed tomography (MDCT) estimation of the CAC score (CACS) using identical equipment and standardized protocols. Of the 24,062 subjects, two were excluded for missing waist circumference (WC) data, leaving 24,060 eligible subjects.
Informed consent was obtained from all participants. The study design and protocol were approved by the Institutional Review Board (IRB) of Kangbuk Samsung Hospital and are in accordance with the 1975 Declaration of Helsinki. After the IRB approved this study, specific datasets were released by the data management group of the Kangbuk Samsung Health Study after deletion of participants' personal information.
Clinical and laboratory measurements
Anthropometric measurements included body weight, height, body mass index (BMI), WC, and systolic and diastolic blood pressure. BMI was calculated as weight in kilograms divided by height in meters squared (kg/m2). WC was measured in a standing position, at the midpoint between the anterior iliac crest and lower border of the last palpable rib, by a single examiner. Blood pressure was measured twice by a skilled nurse following at least 10 minutes of rest, and the mean value was calculated and recorded. Subjects who reported that they smoked were classified as 'current smokers.' Regular exercise was assessed using a physician-administered questionnaire in which subjects were asked if they participated in regular exercise 'of moderate intensity at least three times a week.' The presence of diabetes mellitus was determined according to self-reported data by the participants and the diagnostic criteria of the American Diabetes Association [10]. The presence of hypertension was defined by criteria recommended by the eighth report of the Joint National Committee on Prevention, Detection, Evaluation and Treatment of High BP (JNC8) [11] (i.e., a blood pressure ≥ 140/90 mmHg) or current use of antihypertensive medication or as self-reported by participants. Blood samples were collected from the antecubital vein following a minimum 12-hour overnight fast. The samples were analyzed for blood lipid profiles, fasting blood glucose levels, serum insulin levels, and glycated hemoglobin (HbA1c). Biochemical markers were measured using Bayer Reagent Packs on an automated chemistry analyzer (ADVIA 1650 Autoanalyzer, Bayer HealthCare, Tarrytown, NY, USA). Fasting blood glucose levels were measured using the hexokinase method. Lipid profiles, including values for total cholesterol (TC), triglycerides (TGs), low density lipoprotein cholesterol (LDL-C), and high density lipoprotein cholesterol (HDL-C), were measured by enzymatic colorimetric assay. Serum insulin concentrations were measured by immunoradiometric assay using an INS-IRMA kit (BioSource, Nivelles, Belgium). As a marker of IR, the HOMA-IR was calculated using the following formula [12]: HOMA-IR = [fasting insulin (IU/mL) × fasting glucose (mmol/L)]/22.5.
HbA1c was measured by immunoturbidimetric assay using a Cobra Integra 800 automatic analyzer (Roche Diagnostics, Basel, Switzerland) with a reference value of 4.4% to 6.4%. The methodology was aligned using the standards of the Diabetes Control and Complications Trial and National Glycohemoglobin Standardization Program (NGSP). The intra-assay coefficient of variation (CV) was 2.3%, and the interassay CV was 2.4%. Both these values were within the NGSP acceptable limits [13].
Measurement of coronary artery calcium
Participants underwent CAC quantification by MDCT (GE Healthcare, Tokyo, Japan). The total CACS was determined by summing the individual scores for the four major epicardial coronary arteries. Total CACS was reported in Agatston units [14]. CAC was categorized as present (Agatston score > 0) or absent.
Diagnostic criteria for MetS
MetS was defined according to the International Diabetes Federation (IDF), Modified ATP III, and European Group for the Study of Insulin Resistance (EGIR) criteria. To define high WC, ethnicity-specific values were used: high WC was defined as ≥ 90 cm in men or ≥ 85 cm in women in all three sets of MetS criteria [15]. The criteria were as follows:
IDF criteria [16]: WC ≥ 90 cm in men or ≥ 85 cm in women [15] plus two or more of the following criteria: (1) TG level ≥ 150 mg/dL or current treatment for this lipid abnormality; (2) HDL-C level < 40 mg/dL in men or < 50 mg/dL in women or current treatment for this lipid abnormality; (3) blood pressure ≥ 130/85 mmHg or use of antihypertensive medication; and (4) fasting plasma glucose level ≥ 100 mg/dL.
Modified ATP III criteria [17]: three or more of the following components: (1) WC ≥ 90 cm in men or ≥ 85 cm in women [15]; (2) TG level ≥ 150 mg/dL; (3) HDL-C level < 40 mg/dL in men or < 50 mg/dL in women; (4) blood pressure ≥ 130/85 mmHg; and (5) fasting glucose level ≥ 100 mg/dL. Note that the 2002 definition defined elevated fasting glucose level as ≥ 6.1 mmol/L (110 mg/dL); in 2004 this was changed to ≥ 5.6 mmol/L (100 mg/dL) in accordance with the American Diabetes Association's updated definition of impaired fasting glucose [18].
EGIR criteria [19]: fasting hyperinsulinemia (highest 25%) and at least two of the following criteria: (1) fasting glucose level ≥ 6.1 mmol/L (110 mg/dL); (2) blood pressure ≥ 140/90 mmHg or treatment for hypertension; (3) TG level > 150 mg/dL or HDL-C level < 40 mg/dL or treatment for dyslipidemia; and (4) WC ≥ 90 cm in men or ≥ 85 cm in women [15].
Statistical analysis
Statistical analyses were performed using SPSS version 18.0 (IBM Co., Armonk, NY, USA). For continuous variables, data are reported as the median (interquartile range) or mean ± SD and were analyzed by independent t test. For categorical variables, data are reported as proportions and were analyzed using the chi-square test. CACS, fasting insulin, and serum TGs were log-transformed for analysis to correct for skewed distributions. For ease of interpretation, these values are expressed as untransformed data in the tables in this paper. The associations between CAC and MetS components and cardiovascular risk factors were examined by Spearman correlation.
C statistics, which are analogous to the area under the receiver operating characteristic curve, were calculated to compare the ability of different logistic models to discriminate between the three sets of criteria with and without CAC. The DeLong algorithm was used to determine statistical significance [20]. Adjusted odds ratios (ORs) with 95% confidence intervals were derived according to the three sets of MetS criteria and by the number of MetS components in multiple logistic regression models for CAC, to determine which MetS criteria best predict CAC. The p values <0.05 were considered statistically significant.
RESULTS
Table 1 shows the general characteristics of the subjects. A total of 24,060 subjects (19,721 males and 4,339 females; mean age, 41 years) were analyzed. The proportion of participants with a CACS > 0 was 12.6% (CACS = 0, n = 21,023; CACS > 0, n = 3,037). The average CACS for the 24,060 subjects was 7.95 ± 58.53. Subjects with CAC (CACS > 0) were older, predominantly male, more obese, and had higher TG levels and lower HDL-C levels. More of these patients had a history of diabetes and hypertension and higher rates of other MetS components.
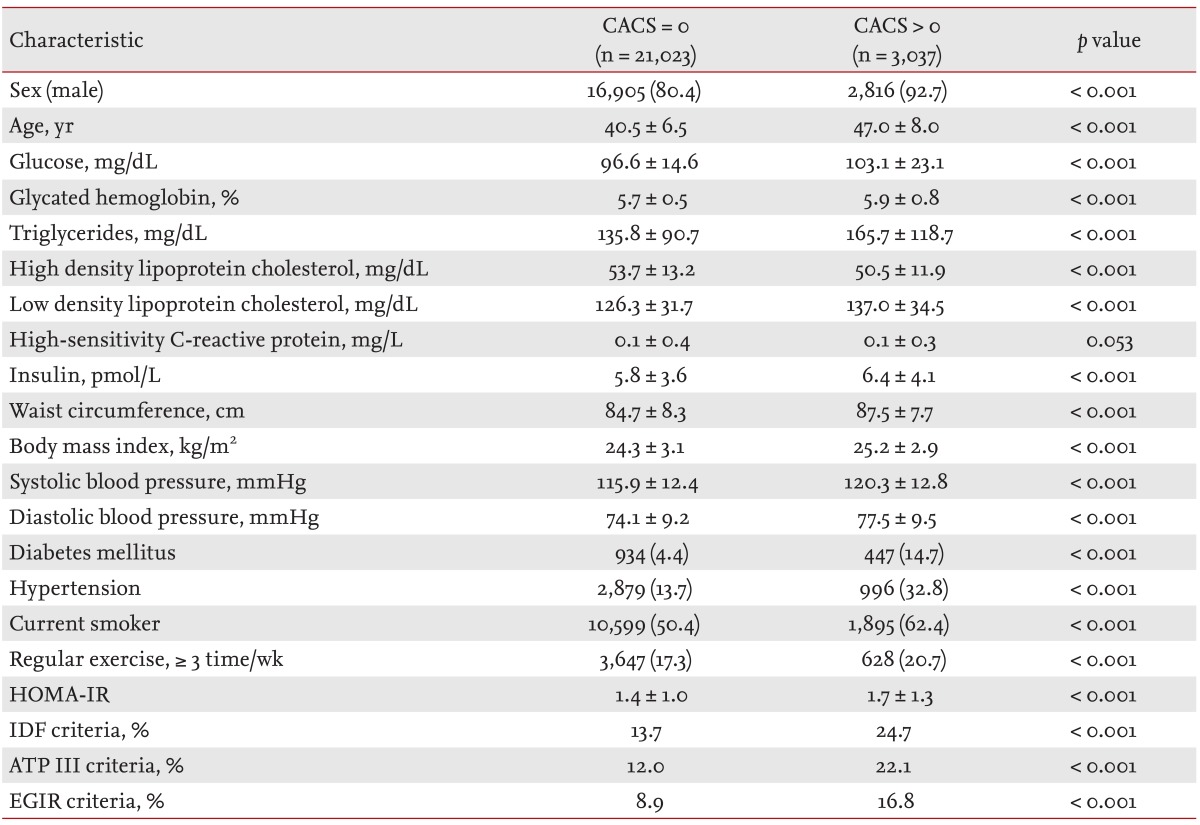
Baseline characteristics of subjects according to the presence of CACS
For all sets of MetS criteria, the prevalence of MetS was significantly higher in participants with a CACS > 0 than in those with a CACS = 0. The prevalence of MetS in subjects with CACS > 0 was 23.0% for the IDF criteria, 25.1% for the ATP III criteria, and 29.5% for the EGIR criteria (Table 1).
Spearman correlations for factors related to MetS and CACS are shown in Table 2. CACS was positively correlated with age, sex, WC, BMI, and other MetS factors, with the exception of HDL-C.
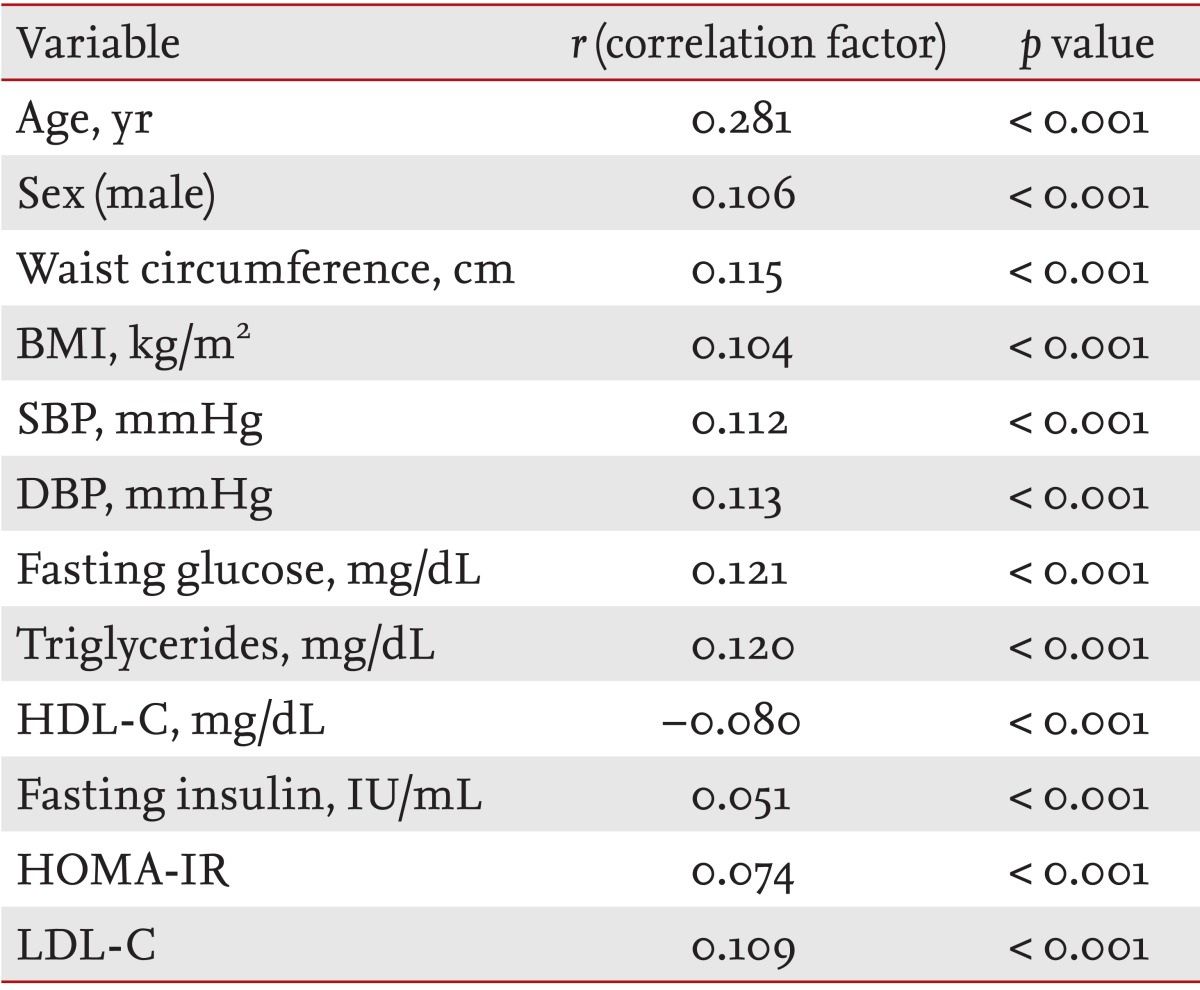
Spearman correlation of CACS with metabolic variables
To determine which set of MetS criteria best predicts CAC, ORs for the presence of CAC were calculated for the three sets of MetS criteria. MetS as defined by the IDF, ATP III, and EGIR criteria was associated with the presence of CAC (OR, 1.392 to 1.439; p < 0.001, presence versus absence of CAC) after adjustment for potential confounding factors (Table 3). C statistics for multivariate regression models were calculated to evaluate how well each definition predicts the risk of coronary artery disease. No significant differences were observed between the three sets of criteria (point estimates for C statistics = 0.788 to 0.789) (Table 3).
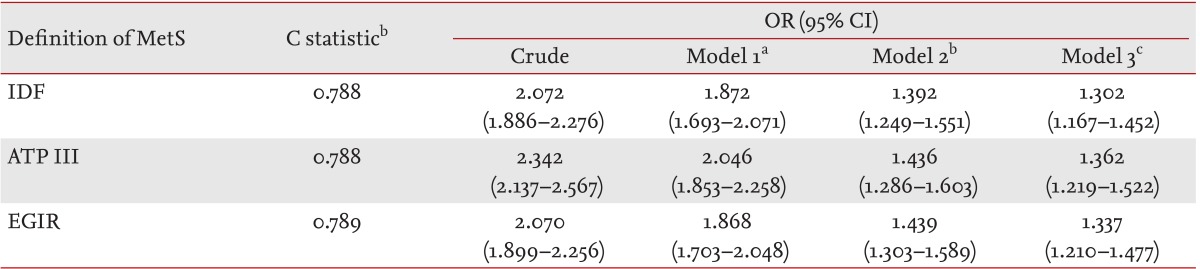
Odds ratios from multivariate logistic regression analysis of each set of metabolic syndrome criteria as a predictor of coronary artery calcium
Next, the association between CAC and the number of MetS components was evaluated. As expected, the presence of CAC according to an increasing number of MetS components was attenuated in multivariable logistic regression analysis. The proportion of subjects with CAC increased (from 6.7% to 22.5%) as the number of MetS components increased from 0 to ≥ 3 (p for trend < 0.001). This significant predictive trend persisted after adjustment for age, sex hypertension, diabetes mellitus, smoking status, and exercise. The ORs for CAC increased with the number of MetS components at approximately the same rate for all three sets of MetS criteria (Table 4).
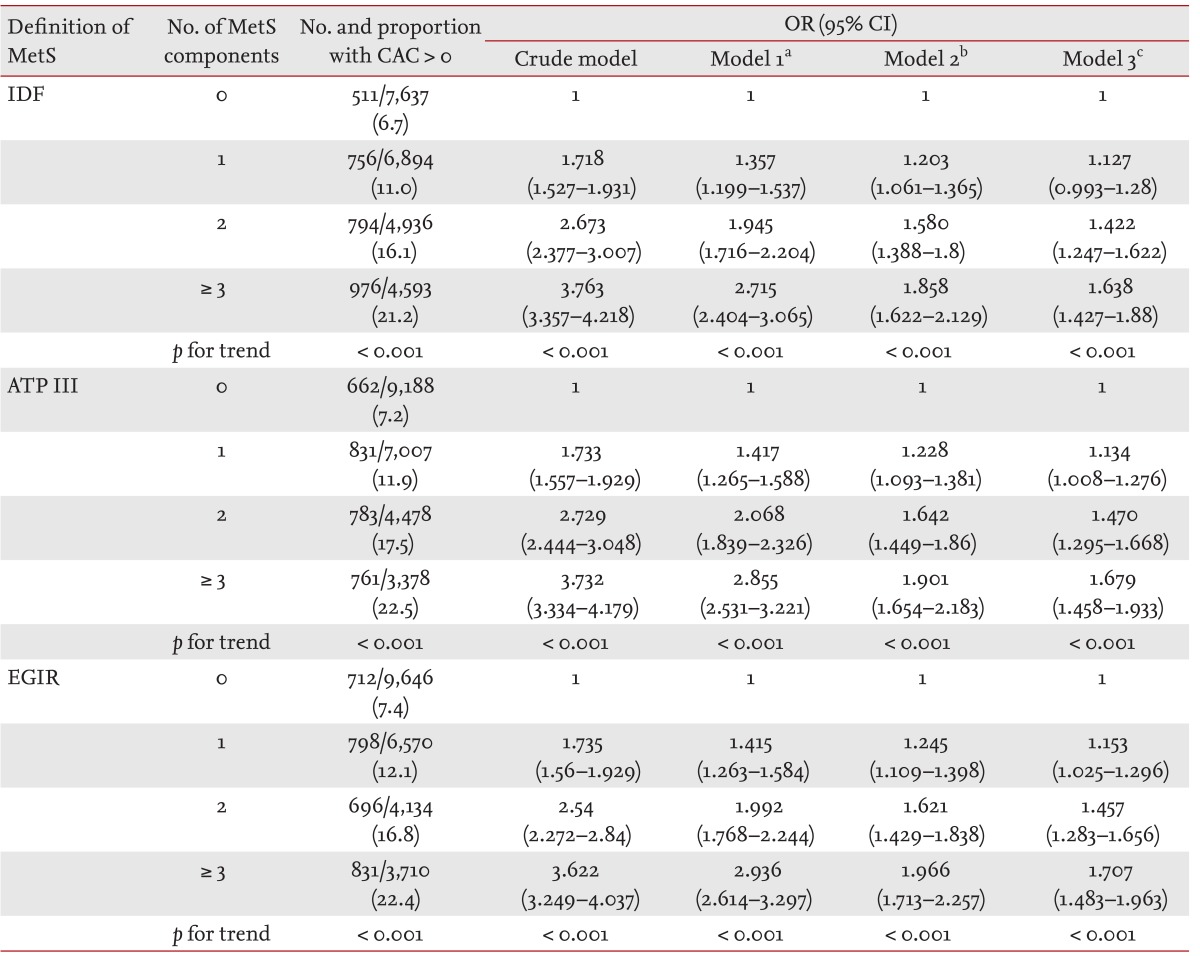
Odds ratios from multivariate logistic regression analysis of each set of metabolic syndrome (MetS) criteria as a predictor of coronary artery calcification according to the number of MetS components
DISCUSSION
This study found that the risk of CAC increased 1.3- to 1.4-fold when subjects were diagnosed with MetS according to any of the three sets of criteria included in this study (IDF, ATP III, and EGIR). When a multivariate model was used to predict the presence of CAC, there were no differences in C statistics among the three sets of MetS criteria. The risk of CAC gradually increased according to the number of MetS components. Thus, a MetS diagnosis (defined by any of the aforementioned criteria) or a higher number of MetS components seems to increase the likelihood of CAC. This suggests that CAC should be considered in subjects with MetS or a high number of MetS components, and that preventive strategies may be needed to reduce the risk of cardiovascular disease.
This study analyzed and compared data from a large number of subjects to assess the ability of three sets of commonly used MetS criteria to predict CAC. Previous research analyzed the associations between a single MetS criterion and cardiovascular disease mortality [7,21,22,23]. Recent studies have shown that a variety of MetS definitions exist, and that they are all associated with subclinical atherosclerosis [7,24,25]. Mehta et al. [7] showed that ATP III-defined MetS was independently associated with CAC in type 2 diabetes mellitus. They also reported that the point estimate C statistic for the prediction of significant CAC was 0.67 [24].
This study adds to earlier research by Narla et al. [25] showing that the ORs for CACS > 0 for MetS (as defined by ATP III, American Heart Association/National Heart, Lung and Blood Institute, and IDF criteria) were 1.6 to 1.7 in 458 asymptomatic men, after adjustment for age, smoking status, and LDL-C. Compared with our study, the study by Narla et al. [25] was smaller (458 subjects) and included a higher number of obese subjects. In our large number of study subjects, we examined the risk for CAC and CAC prediction for three sets of MetS criteria (IDF, ATPII, and EGIR) using C statistics.
Simon et al. [26] conducted a meta-analysis and found that detection of subclinical arterial disease in asymptomatic individuals is a worthwhile screening test for predicting future cardiovascular events. A variety of inva sive and non-invasive techniques are available to measure subclinical atherosclerosis [27]. Among these techniques, MDCT garnered great interest because CT indicates the presence and extent of coronary atherosclerosis and can quantify the exact amount of calcification [28]. CAC can be used as a marker for coronary atherosclerosis [6,29]. In one study, CACS = 0 was associated with a very low risk of a coronary event, while an elevated CACS was associated with an increased risk [30]. Another study found that in patients with type 2 diabetes, CACS > 10 could predict cardiovascular events [31]. In the present study, CACS > 0 was used as an outcome variable to predict subclinical atherosclerosis as it relates to MetS defined by the three sets of criteria in a large number of subjects.
Despite advanced research, there are many uncertainties about the pathophysiology of the link between MetS and CAC [3]. IR appears to play a major role and increases the risk of coronary artery disease even in the absence of hyperglycemia [32]. Early in the course of IR, free fatty acid levels increase because of loss of the suppressive effects of insulin on lipolysis in adipocytes and increased very low density lipoprotein production and other metabolic abnormalities [33]. These changes have a proatherogenic effect on IR [33]. Moreover, Bornfeldt and Tabas [34] reported that IR can promote atherogenesis, from the early stages to advanced plaque progression. The mechanism may involve both systemic factors, such as dyslipidemia or hypertension, and the proinflammatory state. It has the effect of disturbing insulin signaling at the multi-cellular level of the vessel, including in endothelial cells, vascular smooth muscle cells, and macrophages [34]. Such a pathophysiologic aspect may explain the association between CAC and MetS in the present study.
There are several limitations to this study. First, microalbuminuria and oral glucose tolerance tests were not included in the analyses. Thus, it was not possible to analyze all currently available MetS criteria. Second, this study was cross-sectional, and therefore, it was impossible to determine a causal relationship between MetS and the development of subclinical coronary atherosclerosis. Third, the prevalence of MetS or its components and the range of coronary calcification varies by ethnicity, and thus data from our study may not be applicable to different ethnicities. Lastly, our study lacked information on drug use for diabetes, hypertension, and dyslipidemia. Despite the limitations, this study has many strengths and is unique in that it compared the associations between different sets of MetS criteria and CAC in a large number of subjects.
In conclusion, MetS was significantly associated with the presence of CAC. In addition, the three sets of criteria for MetS were all comparable with each other in terms of predicting CAC. Subjects with a higher number of MetS components have an increased risk of CAC. These findings suggest the need for measures to prevent cardiovascular disease in subjects with MetS or MetS components.
KEY MESSAGE
The presence of metabolic syndrome (MetS) was associated with the presence of coronary artery calcification (CAC).
There was no significant difference among the three sets of MetS criteria in terms of ability to predict CAC.
An increase in the number of MetS components is associated with an increased odds of CAC.
Notes
No potential conflict of interest relevant to this article was reported.