Tumor necrosis factor α is a risk factor for infection in peritoneal dialysis patients
Article information
Abstract
Background/Aims:
It has been shown that circulating tumor necrosis factor α (TNF-α) is elevated in end stage renal disease patients; however, the relationship between TNF-α and the development of infection in these patients is unknown. In this study, we investigated the association of plasma TNF-α and interleukin 6 (IL-6) with infection in peritoneal dialysis (PD) patients. We also evaluated the association of their plasma levels with the production by peripheral blood mononuclear cells (PBMC), and with various clinical parameters.
Methods:
We enrolled 32 patients on maintenance PD and 10 healthy controls. Plasma and PBMC were isolated from blood. PBMC were stimulated with lipopolysaccharide in vitro.
Results:
Mean follow-up duration was 775 days. Six patients developed organ infections (five pneumonia and one liver abscess), and six patients developed PD peritonitis and eight developed exit site infection. Plasma TNF-α and IL-6 levels were significantly elevated in organ infections but not in peritonitis or in exit site infection. Plasma TNF-α was the only significant risk factor for organ infections and pneumonia in multivariate regression analysis. Patients with high plasma TNF-α levels showed a significantly greater cumulative hazard rate for organ infections compared to those with low TNF-α levels. Plasma TNF-α levels correlated with TNF-α production by PBMC and showed an inverse association with Kt/V.
Conclusions:
This is the first study showing that plasma TNF-α is a significant risk factor for infection in PD patients.
INTRODUCTION
Tumor necrosis factor α (TNF-α) is a pro-inflammatory polypeptide cytokine implicated in various diseases, and circulating TNF-α was found to be elevated in uremic patients [1]. Interleukin 6 (IL-6) is another important pro-inflammatory cytokine and elevated circulating IL-6 has been associated with cardiovascular diseases and mortality in end stage renal disease (ESRD) patients [2-5]. As for the causes of increased TNF-α and IL-6 in uremic patients, decreased clearance by kidney [6,7], and enhanced secretion by circulating mononuclear cells [8,9] have been suggested. Though the data are conflicting, TNF-α in ESRD patients has been implicated in malnutrition [1,10] cardiovascular diseases [3,11] and erythropoietin resistance [12], which have been attributed to the chronic inflammation state caused by TNF-α. Accordingly, clinical trials to suppress TNF-α in ESRD patients have been conducted by several investigators [12-14]. On the contrary, TNF-α is known to have favorable and protective effects against infections [15-17], and in fact, TNF-α inhibition therapy has been associated with development of infections [18]. Then, what is the role of elevated TNF-α on the development of infection in ESRD patients? There is no answer to this question yet, but there is indirect evidence that TNF-α may lead to increased risk of infection: Girndt et al. [8] found that the potential of mononuclear cells to produce TNF-α correlated with non-responsiveness to hepatitis B vaccination in hemodialysis (HD) patients, suggesting the role of TNF-α in the immunosuppressive state in uremia. On the other hand, the production of TNF-α and IL-6 by mononuclear cells has been studied extensively in peritoneal dialysis (PD) patients, where PD fluids were found to impair the production of these cytokines by peritoneal macrophages or peripheral blood mononuclear cells (PBMCs) [19-25]. Since patients’ body fluids are repeatedly exposed to PD fluids, it is possible that PD fluids per se in addition to uremia may alter the function of mononuclear cells in circulation.
In the present study, we investigated the association of TNF-α and IL-6 with infection, the association of their plasma levels with their production by circulating mononuclear cells, and the association of TNF-α and IL-6 with various clinical parameters in PD patients.
METHODS
Study subjects
We enrolled ESRD patients who had been on maintenance PD in the study, if they were 20 or older and did not have exclusion conditions including pregnancy, chronic viral infection (hepatitis and HIV), chronic inflammatory diseases, acute infection, or acute cardiovascular events. We also included healthy volunteers for controls who had no past medical history of chronic diseases and had not been on any medications. The study was approved by Ajou Institutional Review Board and written informed consent was obtained from the enrolled subjects.
Collection of blood samples and clinical data
Baseline characteristics of the patients were obtained from medical records. Blood samples for TNF-α and IL-6 were obtained at the start of the study when venipunctures were done for routine monthly blood tests, which included serum glucose, blood urea nitrogen, creatinine, albumin, cholesterol, white blood cell, and hematocrit. The data for C-reactive protein (CRP), Kt/V, and residual renal function (RRF) were obtained from medical records which had been done within 3 months of sample collection. Weekly Kt/Vurea was measured using a 24-hour collection of urine and a 24-hour collection of effluent for PD. RRF was calculated as the mean of creatinine clearance and urea clearance, normalized to the body surface area. Patients were followed up until death, loss to follow-up, switch to HD or transplantation, or study end.
Measurement of cytokines
Heparinized blood (10 mL) was collected to isolate plasma and PBMC. To isolate PBMC, blood was diluted with phosphate-buffered solution at 1 to 1 ratio, and then loaded on Ficoll-Paque gradient solutions (GE Healthcare Life Sciences, Little Chalfont, UK), centrifuged at 2,000 RPM for 30 minutes, and then mononuclear cell layers were collected. The isolated cells were suspended in RPMI 1640 media (Life Technologies, Waltham, MA, USA) supplemented with 10% fetal bovine serum and 0.05 mM 2-mercaptoethanol at the cell concentration of 1 × 10⁶/mL. The cells were incubated with or without 100 ng/mL of lipopolysaccharide of Escherichia coli (serotype 055:B5, Sigma-Aldrich, St. Louis, MO, USA) for 24 hours at 37°C with 5% CO2, and culture media were centrifuged at 15,000 ×g for 5 minutes at 4°C. Plasma samples and culture media were analyzed for TNF-α and IL-6 protein concentrations by enzyme-linked immunosorbent assay (ELISA) using commercially available ELISA kits (R&D Systems, Minneapolis, MN, USA) according to the manufacturer’s specifications.
Statistical analysis
All Data were represented as mean ± SD. Characteristics of the patient groups were compared by Mann-Whitney tests and chi-square tests. Time to infection was tested using Kaplan-Meier survival anaysis and log rank test. Cox regression analysis was used to evaluate the effect of risk factors for infections. Pearson correlation analysis measured the strength of a relationship between two variables. A p value below 0.05 was considered statistically significant. SPSS version 22 (IBM Co., Armonk, NY, USA) was used for the statistical analysis.
RESULTS
Study participants and follow-up
Altogether, 32 PD patients and 10 healthy controls were enrolled in the study. All patients had been on PD for a mean of 2.7 years (range, 0.2 to 10.5). After sampling blood, they were followed for a mean duration of 775 days (range, 21 to 1,176). During the study period, two patients expired, seven received kidney transplants, four were changed to HD, and one transferred to another institution. Five patients developed pneumonia and one patient developed liver abscess, and these six patients were categorized as organ infections to distinguish them from PD related infections including peritonitis and exit site infection. Six patients developed PD peritonitis and eight developed exit site infection. Time to infection from blood sampling was 474.0 ± 405.2 days (range, 51 to 1,083) for organ infections, 1,689.8 ± 1,054.3 days for peritonitis (range, 815 to 2,835) and 334.7 ± 341.3 days (range, 28 to 992) for exit site infection. Sixteen patients were using combinations of bicarbonate/lactate buffered glucose solutions, amino acid solution and icodextrin solution and the others were on combinations of lactate buffered glucose solutions and icodextrin solutions.
Mean plasma cytokine levels and the development of infections
Plasma TNF-α levels were significantly elevated in patients with organ infections (n = 6) compared to those without infections (n = 26) or healthy controls (n = 10) (Fig. 1). However, plasma IL-6 levels were not significantly different between patients with organ infections versus those without infections (Fig. 1). Plasma TNF-α and IL-6 levels were not different in patients with peritonitis or exit site infection as compared with those without infections (Table 1).
Organ infections and plasma tumor necrosis factor α (TNF-α) and interleukin 6 (IL-6) levels. ap = 0.000 vs. healthy controls, bp = 0.000 vs. healthy controls, cp = 0.000 vs. healthy controls and p = 0.017 vs. patients without infection, dp = 0.015 vs. healthy controls.
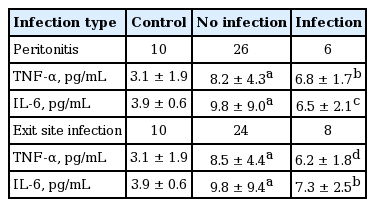
Plasma cytokine levels in peritoneal dialysis related infections
Plasma cytokine as a predictor for infections
In univariate Cox regression analysis, plasma TNF-α and IL-6 levels were significant risk factors for organ infections, whereas other variables that are considered to have effect on infections such as diabetes, age, CRP (inflammation marker), serum albumin (nutritional marker), Kt/V (dialysis dose marker), and PD duration were not significant risk factors for organ infections (Table 2). Multivariate Cox regression analysis of plasma TNF-α together with IL-6 and the other covariates showed that plasma TNF-α was the only significant risk factor for organ infections (Table 2). The same analysis for pneumonia with the other covariates showed that plasma TNF-α was the only significant risk factor again (hazard ratio, 1.344; 95% confidence interval, 1.022 to 1.767; p = 0.034). In contrast, PD related infections including peritonitis and exit site infection were not associated with plasma TNF-α or IL-6 (data not shown).

Univariate and multivariate analysis for organ infections
Clinical outcomes by plasma cytokine levels
The cumulative hazard rate for organ infections was significantly greater in patients with high plasma TNF-α (top tertile defined by higher than 7.5 pg/mL) as compared with those with low TNF-α (bottom tertile defined by lower than 5.7 pg/mL), whereas it was similar in high (top tertile defined by higher than 8.0 pg/mL) and low plasma IL-6 (bottom tertile defined by lower than 5.8 pg/mL) groups (p = 0.174) (Fig. 2). Similarly, patients with high plasma TNF-α showed a significantly greater cumulative hazard rate for pneumonia (p = 0.044 by log rank test). Top and bottom TNF-α tertile groups were comparable in patient characteristics (Table 3). Plasma TNF-α or IL-6 levels did not show significant correlations with serum albumin, serum creatinine, and body mass index (BMI) which are considered as nutritional indicators (Table 4). Plasma TNF-α showed a significant correlation with IL-6 levels, and a significant inverse correlation with Kt/V but not with RRF (Table 4).

Kaplan-Meier survival analysis of cumulative hazard rate for organ infections. (A) The line indicates data for patients with plasma tumor necrosis factor α (TNF-α) in the top tertile (> 7.5 pg/mL, n = 11) and in the bottom tertile (< 5.7 pg/mL, n = 12). The difference was significant at p = 0.009 by log rank test. (B) The line indicates data for patients with plasma interleukin 6 (IL-6) in the top tertile (> 8.0 pg/mL, n = 11) and in the bottom tertile (< 5.8 pg/mL, n = 11). The difference was not significant.

Demographic characteristics by plasma tumor necrosis factor α tertiles
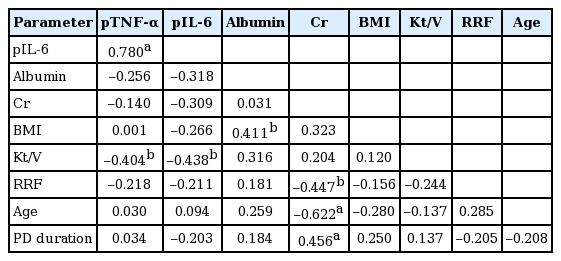
Correlation matrix of cytokines and clinical parameters
Cytokine production by PBMC in relation to plasma cytokine and infections
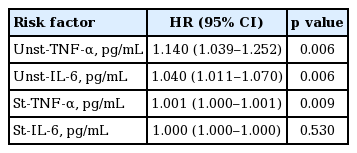
Pearson correlation analysis showed that plasma TNF-α and IL-6 levels were closely associated with the production by PBMC. Plasma TNF-α significantly correlated with unstimulated TNF-α production and showed a borderline significance with stimulated TNF-α production. The unstimulated TNF-α production inversely correlated with Kt/V but not with RRF (Table 5). Univariate Cox regression analysis showed that unstimulated and stimulated TNF-α production as well as unstimulated production of IL-6 were significant predictors of organ infection (Table 6).
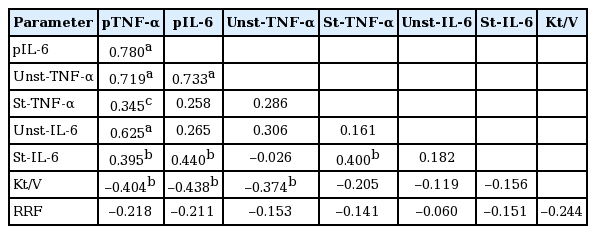
Correlation matrix of plasma and PBMC cytokines
Univariate analysis for organ infections
DISCUSSION
In the present study, we found that elevated plasma TNF-α is a significant risk factor for organ infections especially pneumonia in PD patients, and to our knowledge, this is the first study demonstrating such association. Previous data showed that TNF-α causes loss of appetite and may lead to malnutrition in ESRD patients [1] and if it is the case, then malnutrition may be the reason for TNF-α induced infections. However, our study did not show correlations of plasma TNF-α with nutritional markers including serum albumin, serum creatinine, and BMI [26], which is consistent with the previous reports showing the irrelevance of TNF-α to the status of nutrition [10,27]. Accordingly, our study showed that serum albumin, a robust indicator of nutritional status [26], was not a significant risk factor for infections.
Though TNF-α is known to be a critical cytokine in defending host from infections, it has been shown that heightened TNF-α expression by PBMC is associated with defect in immune response in HD patients [8]. Our study advanced those findings by demonstrating that TNF-α expression by PBMC is actually a risk factor for infections as well as it correlates with plasma TNF-α levels. In fact, ours is the first study demonstrating the correlation between TNF-α expression by PBMC and plasma TNF-a levels, which indicates that an increased production may contribute to the elevation of circulating TNF-α levels in uremia. Given the protective role of TNF-α against infection, it can be hypothesized that TNF-α production is increased to compensate for uremia-induced immune compromised status predisposing to infections.
As for the role of dialysis dose on plasma TNF-α, our data showed that plasma TNF-α inversely correlated with Kt/V, suggesting that circulating TNF-α may be removed by PD, or plasma TNF-α production may be increased with a decrease in dialysis dose. Given the previous data showing that circulating cytokines with high molecular weights higher than 15 kDa are unlikely to be removed by peritoneal clearance [28], it is more likely that the production of TNF-α (molecular weight 17 kDa) may be increased in proportion to uremic toxins in blood, resulting in the inverse relationship between plasma TNF-α levels and Kt/V.
Our data showing that Kt/V inversely correlated with constitutive (unstimulated) TNF-α production by PBMC further suggest TNF-α production may be dependent on dialysis dose to some extent. RRF, which constitutes a part of Kt/V, did not correlate with plasma TNF-α, which may be due to a small amount of RRF of our patients not enough to affect plasma TNF-α levels.
In the present study, IL-6 was significantly elevated in PD patients and showed significant correlations with TNF-α; however, it did not show strong associations with organ infections as seen in TNF-α, suggesting a limited role of IL-6 in host immune status. Accordingly, it is hard to find data showing the association of IL-6 with immune competence in contrast to TNF-α which has been implicated in disturbances of host immune competence in many studies [8,15-18].
As for the mechanistic explanations for the observed link between TNF-α and organ infections, previous studies showed that TNF-α blocks IL-2 dependent clonal expansion of T cells [29] and that TNF-α produced by mononuclear cells induces non-responsiveness to hepatitis B vaccination [8], which indicate that TNF-α may have a suppressive effect on mounting an immune response against infection, resulting in increased susceptibility to infection. On the other hand, our data showed a lack of influence of circulating TNF-α on the rate of peritonitis, which suggests that the development of peritonitis may depend on the function of immune cells residing in peritoneal cavity rather than the function of circulating immune cells.
A limitation of this study is a small number of study subjects, which requires larger studies in the future to confirm the current findings. Another limitation is this study examined only a single measurement of cytokines. We believe that the current data would be strengthened by using the average of two or more samples or correlating the trend of multiple circulating cytokine levels with clinical outcomes.
In conclusion, we showed that plasma TNF-α is a risk factor for organ infections in PD patients. We also showed plasma TNF-α levels are associated with Kt/V and synthesis by PBMC. Further studies are required to verify our findings and develop measures to prevent infections in ESRD patients.
KEY MESSAGE
1. Plasma tumor necrosis factor α (TNF-α) is a risk factor for organ infections in peritoneal dialysis patients.
2. Plasma TNF-α levels are associated with Kt/V and synthesis by peripheral blood mononuclear cell.
Notes
No potential conflict of interest relevant to this article was reported.