Which dialysis unit blood pressure is the most accurate for predicting home blood pressure in patients undergoing hemodialysis?
Article information
Abstract
Background/Aims
We investigated which dialysis unit blood pressure (BP) is the most useful for predicting home BP in patients undergoing hemodialysis (HD).
Methods
Patients undergoing HD who had been treated > 3 months were included in this study. Exclusion criteria were hospitalized patients with acute illness and changes in dry weight and anti-hypertensive drugs 2 weeks before the study. We used the dialysis unit BP recording data, such as pre-HD, intra-HD, post-HD, mean pre-HD, and post-HD (pre-post-HD), mean pre-HD, intra-HD, and post-HD (pre-intra-post-HD) BP. Home BP (the same period of dialysis unit BP) was monitored as a reference method during 2 weeks using the same automatic oscillometric device. Patients were asked to record their BP three times daily (wake up, between noon and 6:00 PM, and at bedtime).
Results
Significant differences were detected between home systolic blood pressure (SBP) and pre-HD, post-HD, and intra-HD SBP (p = 0.003, p = 0.001, p = 0.016, respectively). In contrast, no differences were observed between home SBP and pre-intra-post-HD and pre-post-HD SBP (p = 0.235, p = 0.307, respectively). Areas under the receiver operating characteristic curve for pre-intra-post-HD and prepost-HD SBP with 2-week home BP as the reference standard were 0.812 and 0.801, respectively.
Conclusions
These results suggest that pre-intra-post-HD and pre-post-HD SBP had similar accuracy for predicting mean 2-week home SBP in HD patients. Therefore, pre-intra-post-HD and pre-post-HD SBP should be useful for predicting home SBP in HD patients if ambulatory or home BP measurements are unavailable.
INTRODUCTION
Mortality rates of patients undergoing hemodialysis (HD) are 20% during the first year of treatment and 70% after 5 years [1]. Cardiovascular disease is responsible for > 50% of deaths [1,2]. Only 20% of patients undergoing HD are normotensive without the use of anti-hypertensive medication. Of those who are hypertension (HT), only 30% are controlled [3,4]. In addition, white-coat HT and masked HT were prevalent in Korean hypertensive population and there was a tendency of mean arterial pressure reduction in Korean dialysis populations [5,6]. Therefore, a unique challenge in patients undergoing HD is how and when blood pressure (BP) should be measured.
Ambulatory BP is best correlated with echocardiographic left ventricular hypertrophy and all-cause mortality compared to dialysis unit BP measurements [7,8]. However, ambulatory BP is not easily measured in a clinical setting. Emerging data suggest that home blood pressure (HBP) measurements are valid and useful to diagnose HT in patients undergoing HD [9]. In addition, HBP is as good as ambulatory BP for predicting target organ damage as assessed by echocardiographic left ventricular hypertrophy [7]. Finally, HBP is cheaper, easier, and more reproducible than those of ambulatory BP, as it eliminates the white-coat effect and masked HT [10]. Therefore, ambulatory BP can be replaced by HBP for managing HT in patients undergoing HD. HBP measurements require patient compliance and equipment education [10]. Thus, HBP cannot be easily or precisely obtained, particularly in patients undergoing HD with low compliance and low educational status.
Dialysis unit BP can be measured very easily and routinely, although variations in the measurements have raised questions about its clinical usefulness [11]. It is unreasonable for nephrologists to discard dialysis unit BP measurements when managing HT in patients undergoing HD. In addition, the relationship between HBP and dialysis unit BP measurements has not been established. Thus, we investigated which dialysis unit BP measurement is the most useful for predicting HBP in patients undergoing HD.
METHODS
Subjects
Patients were selected from a single dialysis unit located in Goyang, Korea. Inclusion criteria were men or women aged ≥ 20 years who had chronic kidney disease of any etiology, were undergoing HD three times/week for at least 3 months; hemoglobin ≥ 10 and ≤ 12 g/dL; single-poll Kt/V ≥ 1.2, and serum albumin ≥ 3.5 g/dL. Exclusion criteria were patients who had visual or cognitive insufficiency, cardiac arrhythmias, severe heart or liver failure, and pregnancy. Those who missed two or more HD treatments over 1 month, had chronic atrial fibrillation, body mass index ≥ 30 kg/m2, had a change in dry weight or anti-hypertensive medication 2 weeks before the study, or had a single episode of intradialytic hypotension (systolic blood pressure [SBP] < 90 mmHg) were also excluded. HT was defined as mean pre-DBP from six consecutive sessions ≥ 140 mmHg SBP and/or ≥ 90 mmHg diastolic blood pressure (DBP) and/or use of anti-hypertensive medication. Medications and dry weight (the post-HD weight without HT, intra-dialytic hypotension, pulmonary congestion and peripheral edema) were held constant during our study. Informed written consent was obtained from all patients. This study was approved by the local research Myongjin Hospital Institutional Review Board.
Dialysis technique
All patients underwent high-flux HD three times weekly with bicarbonate buffer for 4 hours via left forearm arteriovenous fistula, using 1.0 to 1.4 m2 hollow fiber polysulfone membranes, blood flow rates of 250 to 280 mL/min, and a dialysate flow rate of 500 mL/min, using the Fresenius 5008S machine (Fresenius Medical Care, Bad Homburg, Germany). UF volume was 1,500 to 3,000 mL, and treatment time was 4 hours. The dialysis fluid contained 138 mEq/L sodium, 2 mEq/L potassium, 2.5 mEq/L calcium, 1.0 mEq/L magnesium, 108.5 mEq/L chloride, 35 mEq/L bicarbonate, and 99.1 mg/dL glucose, and temperature was maintained at 36°C.
Home blood pressure monitoring
HBP monitoring was performed using the HBP measuring devices (Omron HEM model 705-CP automatic oscillometric device, Omron Healthcare, Kyoto, Japan). The patients were trained on use of the device and instructed to measure their BP three times daily (wake up, between noon and 6:00 PM, and at bedtime) three consecutive times on each occasion for 2 weeks (the same period of dialysis unit BP). The recordings were accepted for interpretation if the patient had at least 18 BP measurements during 1 week.
Dialysis unit blood pressure
BP at the dialysis unit before each dialysis session (pre-HD BP) was measured by nursing staff using the same HBP measuring devices (Omron HEM model 705-CP automatic oscillometric device). BP was recorded at 1-, 2-, 3-hour and immediately after HD. The mean of the 1-, 2-, and 3-hour BPs was considered the intra-HD BP. BP measured immediately after dialysis was post-HD BP. Three readings at each visit were averaged to provide one value. These BP measurements were averaged for 2 weeks (the same period of HBP monitoring). Thus, each patient had six pre-HD, six post-HD, and six intra-HD BP recordings for dialysis unit BP.
Index and reference blood pressure
The following methods were used to define summary measures for various BP recordings:
Pre-HD BP: SBP measurements obtained before six HD treatments were averaged. The DBP measurements obtained before HD were averaged separately over these six treatments.
Post-HD BP: SBP measurements obtained immediately after six HD treatments were averaged. DBP measurements obtained separately after HD were averaged over these six treatments.
Intra-HD BP: SBP measurements obtained during a single treatment were averaged. These averages from a single HD treatment were averaged over six treatments to yield a single intra-HD SBP. DBP averages were calculated analogously.
Intra-HD BP, including pre-HD and post-HD BP: These measurements were obtained as for intra-HD BP, except that the pre-HD and post-HD BP measurements were also included before averaging the measurements (expressed as mean pre-intra-post-HD BP).
Pre-HD and post-HD BP: SBP values obtained before and immediately after dialysis were averaged. These averages were averaged to yield mean pre-HD and post-HD BP over six treatments (expressed as mean pre-post-HD BP).
HBP average: 2-week HBP values were averaged to yield the overall HBP value as the reference BP.
Home systolic blood pressure (HSBP) ≥ 150 mmHg was used to classify patients with systolic home HT. The threshold of ≥ 150 mmHg from the HBP measurement was derived from Agarwal et al. [11] who compared HBP to ambulatory BP measurements in patients undergoing HD and demonstrated that HSBP ≥ 150 mmHg averaged over 1 week had the best combination of sensitivity (80%) and specificity (84.1%).
Measurement of agreement
The mean difference (MD) and the limits of agreement between HSBP and pre-HD, post-HD, intra-HD, pre-intra-post-HD SBP, and pre-post-HD SBP were calculated using Bland-Altman plots.
Measurement of diagnostic test performance
We calculated the area under the receiver operating characteristics (ROC) curve and their 95% confidence intervals (CIs) for pre-HD, intra-HD, post-HD, pre-intra-post-HD, and pre-post-HD SBP with 2-week HSBP.
Statistical analysis
Variables are expressed as mean ± standard deviation (SDs). We utilized the unpaired t test and repeated measures analysis of variance to compare HBP with dialysis unit BP. The MDs between HSBP and pre-HD, post-HD, intra-HD, pre-intra-post-HD SBP, and pre-post-HD SBP were assessed for significance using the one sample t test. A p < 0.05 was considered significant.
RESULTS
Sample characteristics and mean blood pressure
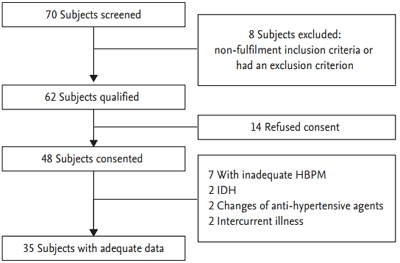
Seventy HD patients in our clinic were recruited. The study flow is outlined in Fig. 1. Thirty-five patients had adequate data, and their clinical characteristics are summarized in Table 1. Mean HBP (systolic and diastolic) were 144.3 ± 12.9 and 74.5 ± 14.0 mmHg, respectively. Mean pre-HD BP values were 152.9 ± 16.9 and 70.1 ± 13.6 mmHg, respectively. Mean post-HD BP values were 133.8 ± 19.6 and 68.6 ± 13.9 mmHg, respectively. Mean intra-HD (1- to 3-hour) BP values were 137.7 ± 17.0 and 68.1 ± 14.0 mmHg, respectively. Mean intra-HD (1-hour) BP, 139.7 ± 18.4, 68.3 ± 14.7 mmHg; mean intra-HD (2-hour) BP, 138.1 ± 19.8, 68.0 ± 14.5 mmHg; mean intra-HD (3-hour) BP, 135.6 ± 18.2, 68.5 ± 14.5 mmHg. Comparisons showed significant differences between HBP and mean pre-HD, post-HD, and intra-HD (1- to 3-hour) BP, intra-HD (1-hour) BP, intra-HD (2-hour) BP, intra-HD (3-hour) BP, regardless of SBP and DBP (p < 0.05) (Table 2). Mean pre-intra-post-HD BP values were 142.3 ± 16.4 and 68.3 ± 13.7 mmHg, respectively. Mean pre-post-HD SBP and DBP values were 143.4 ± 15.1 and 69.4 ± 12.4 mmHg, respectively. No significant differences were observed between HBP and mean pre-intra-post-HD and pre-post-HD BP, regardless of SBP and DBP (Table 2).
Study flow diagram. HBPM, home blood pressure monitoring; IDH, intra-dialytic hypotension.

Baseline characteristics of the study population (n = 35)

Comparison of home blood pressure and dialysis unit blood pressure measurements
Bland-Altman plot agreement analysis
The Bland-Altman analysis is shown in Fig. 2. Mean BP is plotted against the difference, and the MD and the CI for the agreement (MD ± 1.96 SD) were calculated.

(A–E) Bland-Altman plots for pre-hemodialysis (HD), post-HD, intra-HD, pre-intra-post-HD, pre-post-HD systolic blood pressure (SBP), and home systolic blood pressure (HSBP). MD, mean difference.
The MD between pre-HD SBP and HSBP was −8.6 mm Hg. The CI of agreement between pre-HD SBP and HSBP was 22.6 (upper) and −39.8 (lower) mmHg. The MD between post-HD SBP and HSBP was 10.5 mmHg. The CI of agreement between post-HD SBP and HSBP was 45.3 (upper) and −24.3 (lower) mmHg. The MD between intra-HD SBP and HSBP was 6.7 mmHg. The CI of agreement between intra-HD SBP and HSBP was 37.4 (upper) and −24.0 (lower) mmHg. Comparisons showed significant differences between HSBP and pre-HD SBP, post-HD SBP, and intra-HD SBP (p = 0.003, p = 0.001, p = 0.016, respectively) (Fig. 2A-2C).
The MD between pre-intra-post-HD SBP and HSBP was 1.3 mmHg. The CI of agreement between pre-post-HD SBP and HSBP was 14.4 (upper) and −11.8 (lower) mmHg. The MD between pre-post-HD SBP and HSBP was 1.2 mmHg. The CI of agreement between pre-post-HD SBP and HSBP was 15.1 (upper) and −12.7 (lower) mmHg. Comparisons showed no differences between HSBP and pre-intra-post-HD SBP or pre-post-HD SBP (p = 0.235, p = 0.307, respectively) (Fig. 2D and 2E).
Diagnostic performance of mean pre-HD, post-HD, intra-HD, pre-intra-post-HD, pre-post-HD SBP with 2-week HBP as the reference standard
The areas under the ROC curve (95% CI) for pre-HD, post-HD, intra-HD, pre-intra-post-HD, and pre-post-HD SBP were 0.745 (0.541 to 0.880), 0.701 (0.514 to 0.835), 0.738 (0.533 to 0.862), 0.812 (0.651 to 0.964), and 0.801 (0.643 to 0.960), respectively (Table 3). Fig. 3 shows the ROC curves for pre-intra-post-HD, pre-post-HD SBP with 2-week HBP as the reference standard.

Area under the ROC curve for pre-HD, post-HD, intra-HD, pre-intra-post-HD, and pre-post-HD SBP using 2-week home SBP measurements
Area under the receiver operating characteristic (ROC) curve for pre-post-hemodialysis (HD) and pre-intra-post-HD systolic blood pressure using 2-week home blood pressure as the reference standard. CI, confidence interval.
DISCUSSION
The major finding of our study was that mean pre-post-HD and mean pre-intra-post-HD SBP had similar accuracy for predicting mean 2-week HSBP in patients undergoing HD.
The BP decrease during HD countervails the inter-HD increase in BP. Thus, a reciprocal relationship exists between the inter-HD increase in BP and the intra-HD fall in BP. These BP excursions within a short time period make applying traditional HT definitions problematic [12]. Given this variability, it is not surprising that pre-HD and post-HD measurements correlate only roughly with inter-HD ambulatory BP monitoring. A meta-analysis reporting on these variations indicated that predicting individual ambulatory BP using pre-HD or post-HD BP measurements could be erroneous by 35 mmHg in either direction [13]. In fact, a survey of UK centers showed that better post-dialysis BP targets had more intra-HD hypotension [14].
Agarwal et al. [15] concluded that considering intra-HD BP measurements together with pre-HD and post-HD BP measurements improves reproducibility, bias, precision, and accuracy of BP measurements compared to those of pre-HD or post-HD measurements using ambulatory BP as a reference method. Because averaging many intra-HD BP measurements provides an accurate estimate of arterial pressure over a range of volume states, it is possible that averaging many intra-HD recordings provides a better relationship with inter-HD HBP recordings. Unexpectedly, we found that mean pre-post-HD SBP had similar diagnostic ability compared to that of mean pre-intra-post-HD SBP measurements for predicting HSBP. We took hourly dialysis unit measurements. The mean pre-intra-post-HD SBP measurements were not as strong as the pre-post-HD SBP measurements because of the infrequent BP measurements in our study. Thus, it was unlikely that significant difference would be found between mean pre-post-HD SBP and mean pre-intra-post-HD SBP for predicting HSBP using hourly intra-HD BP recordings. Hourly intra-HD BP recordings are performed in most Korean dialysis centers because of patient convenience and request.
Mitra et al. [16] reported that BP measured 20 minutes after dialysis (P20BP) agrees best with inter-HD ambulatory BP. They suggested that inter-HD ambulatory BP significantly underestimates BP if BP is recorded immediately after HD. However, Batlle et al. [17] observed a sustained decline in BP up to 1 hour after HD. This discrepancy could be related to differences in baseline hydration of the study population. Therefore, it is questionable whether P20BP is the best reliable post-HD BP for predicting inter-HD ambulatory BP. Waiting > 20 minutes after HD to obtain post-HD BP is inconvenient and bothersome to almost all patients undergoing HD. Thus, we used BP immediately after HD as post-HD BP and HBP as the reference BP, rather than ambulatory BP.
HBP is as good as ambulatory BP for predicting target organ damage as assessed by echocardiographic left ventricular hypertrophy [7]. Ambulatory BP can be replaced by HBP to manage HT in patients undergoing HD. However, HBP measurements require standardizing the device as well as patient compliance and education about the equipment [10]. In addition, HBP cannot be easily or precisely obtained in some clinical settings. Finally, Although Agarwal et al. [13] indicated that pre and post dialysis BP are imprecise estimates of interdialytic ambulatory BP, our results showed that mean dialysis unit BP can be a useful predictor of HBP. Therefore, mean pre-intra-post-HD and mean pre-post-HD SBP might be more useful for predicting HSBP in patients undergoing HD with poor socioeconomic status.
This study had some limitations. First, the number of patients was relatively small and they were all from a single-center. Second, ambulatory BP monitoring should have been performed and compared to our data to strengthen our results. We did not assess reproducibility of ambulatory BP. However, this was not the purpose of the study. Third, we did not present the DBP data because it is controversial for defining home diastolic HT.
In conclusion, mean pre-post-HD and mean pre-intra-post-HD SBP should be very useful for predicting HSBP in patients undergoing HD if ambulatory or HBP measurements are unavailable. However, these readings should be used with caution with the understanding that they are inferior to ambulatory or HBP measurements.
KEY MESSAGE
1. Home blood pressure (HBP) is as good as ambulatory blood pressure (BP) for predicting target organ damage as assessed by echocardiographic left ventricular hypertrophy. Ambulatory BP can be replaced by HBP to manage hypertension (HT) in patients undergoing hemodialysis (HD).
2. Mean pre-post-HD and mean pre-intra-post-HD systolic BP should be very useful for managing HT predicting home systolic BP in patients undergoing HD if ambulatory or HBP measurements are unavailable.
3. However, these readings (mean pre-post-HD and mean pre-intra-post-HD systolic BP) should be used with caution with the understanding that they are inferior to ambulatory or HBP measurements.
Notes
No potential conflict of interest relevant to this article was reported.