Long-term prognosis of end-stage renal disease patients with normal myocardial perfusion as determined by single photon emission computed tomography
Article information
Abstract
Background/Aims
Normal myocardial perfusion is closely associated with very low rates of cardiac events and better long-term outcomes; however, little is known about its prognostic value in patients with end-stage renal disease (ESRD).
Methods
A total of 286 incident patients underwent baseline cardiac evaluations using echocardiography and stress-rest single-photon emission computed tomography. Perfusion scans for 177 patients (61.9%) who had a summed stress score (SSS) < 4 were normal.
Results
During the 4-year follow-up period, 79 cardiac events occurred. Patients with a SSS < 4 had significantly lower annual rates of cardiac events than did those with a SSS ≥ 4 (6.4% vs. 13.2%; hazard ratio, 0.54; 95% confidence interval, 0.31 to 0.94). Among patients with a SSS < 4, however, cardiac event rates significantly differed according to the presence of comorbid conditions such as old age, diabetes, history of coronary artery disease, and elevated C-reactive protein levels. In addition, the presence of left ventricular (LV) systolic dysfunction and LV hypertrophy at the start of hemodialysis strongly influenced future cardiac events.
Conclusions
In patients with ESRD, normal perfusion scans usually indicate a significantly low risk of adverse cardiac events. However, even in patients with normal perfusion scans, the cardiovascular prognosis is largely dependent on baseline inflammation levels and comorbidities.
INTRODUCTION
The increasing prevalence of end-stage renal disease (ESRD) and the associated high, annual economic costs are issues worldwide. The mortality rates of patients with ESRD are 6.7- to 8.5-fold greater than those of the general population [1]. However, the increasing heterogeneity of patients on renal replacement treatment necessitates more precise survival data individualized according to the severity and rate of progression of comorbid conditions. Simple risk stratification cannot be used to evaluate overall survival data in relatively healthy patients with ESRD without comorbid risk factors. Approximately 15 years ago, Mazzuchi et al. [2] reported that patients with ESRD without comorbid risk factors at the start of dialysis had significantly better survival rates than those of the overall ESRD population. Similarly, we demonstrated in a previous study that approximately 25% of patients, who had started a dialysis incidentally without symptoms, had a low risk of developing coronary artery disease (CAD); low-risk was defined as young age (< 50 years), a normal left ventricular ejection fraction (LVEF), less than two cardiovascular risk factors, and no history of long-term diabetes. These patients had favorable, long-term cardiovascular outcomes with a very low rate of cardiac events (1.2% per person-year of follow-up) [3]. Therefore, identification and characterization of patients with ESRD at low risk of cardiac events are important to avoid unnecessary diagnostic and therapeutic procedures. Currently, there are no consensual data on the characteristics of such patients.
Among the various noninvasive surveillance tests used for CAD, stress-rest myocardial perfusion imaging with single photon emission computed tomography (SPECT) is a useful technique for cardiac risk assessment and prognostic stratification [4]. As a previous meta-analysis demonstrated, normal myocardial perfusion SPECT has a high negative predictive value for CAD [5]; therefore, the presence of normal myocardial perfusion is considered a good indicator of favorable long-term outcomes [6]. In fact, most studies examining cardiac risk after a normal myocardial perfusion scan have reported annual mortality and cardiac event rates of less than 1% [7,8]. When incorporated with clinical baseline characteristics, SPECT was able to identify patients with a sufficiently low risk of cardiac events and provide evidence that these patients can be managed safely with medical treatment [7,9,10]. Currently, the prognostic value of normal SPECT for patients with ESRD is unknown.
The purpose of this study was to evaluate the longterm outcomes of patients with ESRD with normal perfusion scans at the start of dialysis, and to identify the clinical and echocardiographic predictors of adverse cardiac events.
METHODS
All patients with asymptomatic incident dialysis who participated in our CAD surveillance program were followed from January 2007. Each patient underwent a baseline cardiac evaluation using electrocardiography, Doppler echocardiography (Vivid 7, GE Vingmed, Horton, Norway), and stress-rest myocardial perfusion imaging with SPECT (Myoview, Siemens Medical System Inc., Hoffman Estates, IL, USA). Patients with typical angina pain or angina equivalents within 1 month before or after the start of dialysis were excluded from our cohort.
Of the 431 patients with asymptomatic incident dialysis, 145 were excluded for the following reasons: refusal to participate in our surveillance program (n = 29), the presence of pulmonary edema at the time of echocardiography (n = 16), previously diagnosed non-ischemic cardiomyopathy (n = 4), previous valve surgery (n = 8), and loss to follow-up (n = 88). The remaining 286 patients were analyzed, and informed consent was obtained from each patient. All patients underwent routine clinical hemodialysis (HD) for 3.5 to 4 hours, thrice-weekly, using standard bicarbonate dialysis (sodium 138 mmol/L, HCO3 35 to 40 mmol/L, potassium 1.5 mmol/L, calcium 1.25 to 1.5 mmol/L, magnesium 0.75 mmol/L) and semisynthetic membranes (dialysis filters with a surface area of 1.5 to 1.8 m2). Solute clearance and dialysis adequacy were calculated as monthly Kt/V (K, dialyzer clearance of urea; t, dialysis time; V, total body water). Interdialytic weight gain was also recorded. This study was approved by the Institutional Ethics Committee and conducted according to the Declaration of Helsinki.
Cardiac surveillance
Comprehensive echocardiographic measurements were performed within the first 30 days of starting HD, when the patients were considered to have a euvolemic status. LVEF was measured using the biplane Simpson’s method in the apical four- and two-chamber views and was indexed to body surface area. Gated SPECT analyses were performed using Technetium-99m (99mTc)-tetrofosmin and a pharmacological vasodilator (adenosine, 0.14 mg/kg/min) on a 1-day protocol. For stress and rest images, 30 and 10 mCi 99mTc-tetrofosmin were administered, respectively. Quantitative analyses of SPECT data were performed using the SPECT software packages Quantitative Gated SPECT and 4DM-SPECT via a standard processing method. The summed stress score (SSS), summed rest score (SRS), and summed difference score (SDS) were obtained using 17-segment defect scores graded on a 5-point scale. After summing each segment score, a SSS < 4 was considered a normal perfusion scan [7,9,10]. One experienced nuclear cardiologist in our institution, who was blinded to the clinical data, reviewed the SPECT images. Only the sex of the patient was revealed.
Study endpoints
The end of follow-up for a patient was determined as either the occurrence of a cardiac event or the last date of contact in the hospital. A cardiac event was defined as cardiac death or non-fatal acute coronary syndrome (ACS). Cardiac death was defined as death due to documented significant arrhythmia or cardiac arrest (or both) or death due to congestive heart failure or myocardial infarction in the absence of any other precipitating factors. ACS was defined as unstable angina or acute myocardial infarction using the standard criteria for history, electrocardiography, and cardiac enzyme levels. In cases with multiple cardiac events, only the first event was used to determine the follow-up endpoint.
Statistical analysis
Variables with a normal distribution were expressed as mean ± standard deviation, and Kolmogorov-Smirnov tests were used to analyze normality of distribution of the variables. Categorical variables were expressed as percentages and compared using the chi-square test. Annual event rates were calculated by dividing the actual number of events by the total exposure years. Cumulative survival curves were derived using the Kaplan-Meier method, and differences between survival curves were compared using the log-rank test. A Cox proportional hazards model was used to identify independent factors for the determination of endpoints. The predictive value was expressed as the hazard ratio (HR) with the corresponding 95% confidence interval (CI). A p < 0.05 was accepted as significant, and all statistical analyses were performed using SPSS version 18.0 (SPSS Inc., Chicago, IL, USA).
RESULTS
Outcomes of all patients
Of the 286 patients, 177 (61.9%) had a SSS < 4, with a median score of 1. Table 1 shows the differences in baseline characteristics of the patients with a SSS < 4 versus ≥ 4. Patients with a SSS ≥ 4 had higher rates of smoking, diabetes, CAD, peripheral artery disease (PAD), a cerebrovascular accident (CVA) history, and elevated high-sensitivity C-reactive protein (hs-CRP) levels, compared with those with a SSS ≥ 4. In addition, the LVEF was significantly reduced in these patients. However, other echocardiographic parameters, including the left ventricular mass index (LVMI), ratio of mitral velocity to early diastolic velocity of the mitral annulus, and prevalence of left ventricular hypertrophy (LVH) were comparable between the two groups.
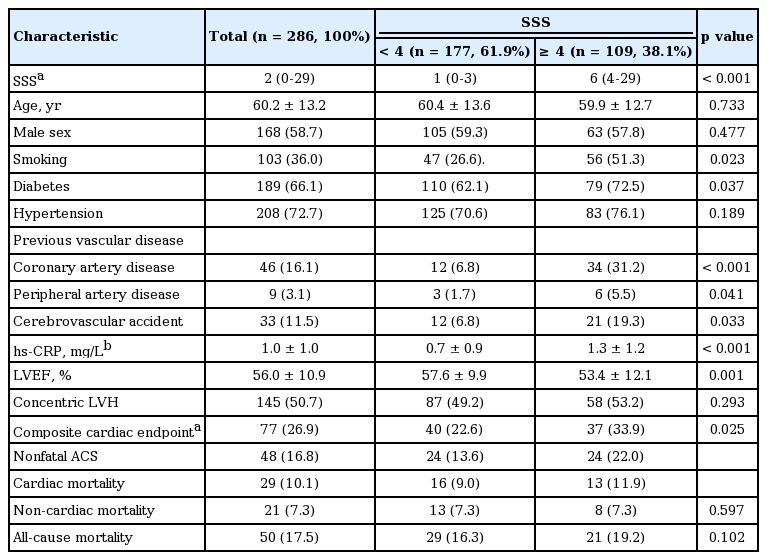
Baseline characteristics of total patients
During the mean follow-up of 4 years (48.2 months), a total of 77 composite cardiac events (48 non-fatal ACS cases and 29 cardiac deaths) and 21 non-cardiac deaths occurred. Patients with a SSS < 4 had significantly lower rates of cardiac events than did those with a SSS ≥ 4, representing 6.4% and 13.2% of the annual cardiac event rate per person-year of follow-up, respectively (HR, 0.54; 95% CI, 0.31 to 0.94). However, there was no difference in the incidence of either non-cardiac mortality or allcause mortality between the two groups (Fig. 1).
Kaplan-Meier analysis of event-free survival in patients with end-stage renal disease stratified by the summed stress score (SSS) (≥ 4 vs. < 4). There were significant dfferences in (A) composite cardiac endpoint, (B) fatal event, and (C) nonfatal event between the two groups. (D) However, no difference was observed in all-cause mortality. ACS, acute coronary syndrome; NS, not significant.
Outcomes of patients with normal perfusion scans
Among the 177 patients with a SSS < 4, composite cardiac events occurred in 40 patients (24 non-fatal ACS cases and 16 cardiac deaths). The clinical differences between the cardiac event and non-event groups are displayed in Table 2. Patients with cardiac events were significantly older and more likely to have diabetes and previous CAD, PAD, and CVA histories compared with patients without cardiac events. Additionally, they had lower serum albumin and hemoglobin levels but higher white blood cell counts and total cholesterol, ferritin, and hsCRP levels than those of patients without cardiac events. As shown in Fig. 2, even in patients with a SSS < 4, cardiac event rates were affected by comorbid conditions. According to multivariate Cox analysis, increased age, diabetes, a previous history of CAD, and a 1-point increase in serum hs-CRP levels were independent clinical predictors of composite cardiac events in patients with a SSS < 4. In addition, LVEF < 50% and concentric LVH were significant predictors of cardiac events (Table 3).
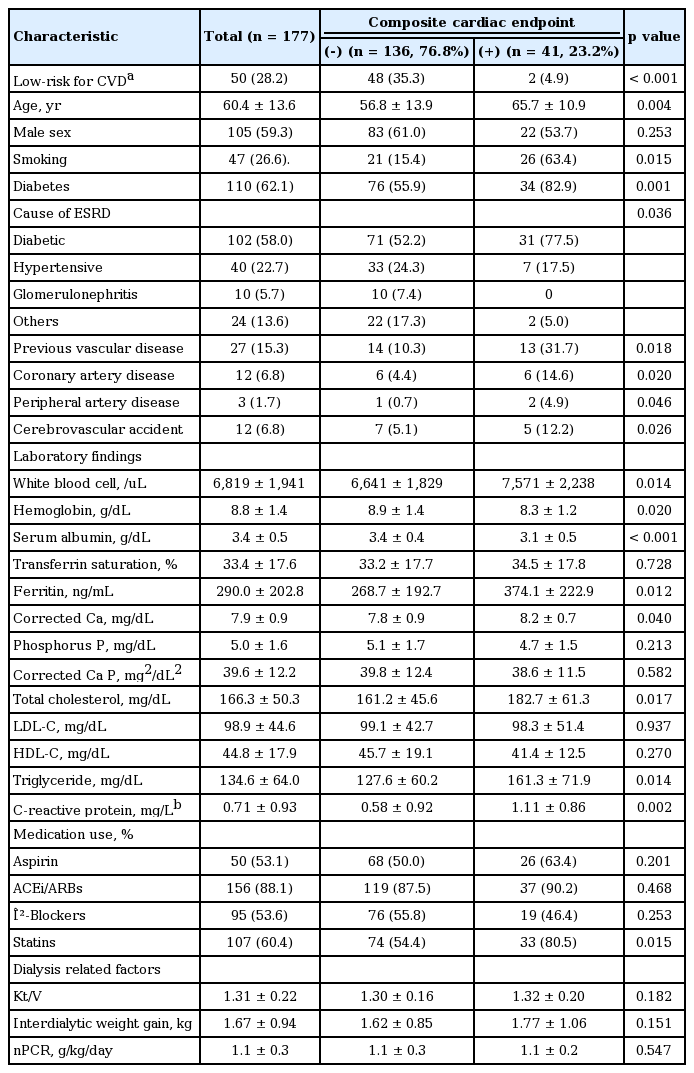
Baseline characteristics of patients with summed stress score < 4 according to cardiac events

Differences in annual cardiac event rates among patients with a summed stress score < 4. Baseline clinical and echocardiographic characteristics strongly inf luenced the occurrence of cardiac events. DM, diabetes mellitus; Hx CAD, history of coronary artery disease; LVEF, left ventricular ejection fraction; LVH, left ventricular hypertrophy.
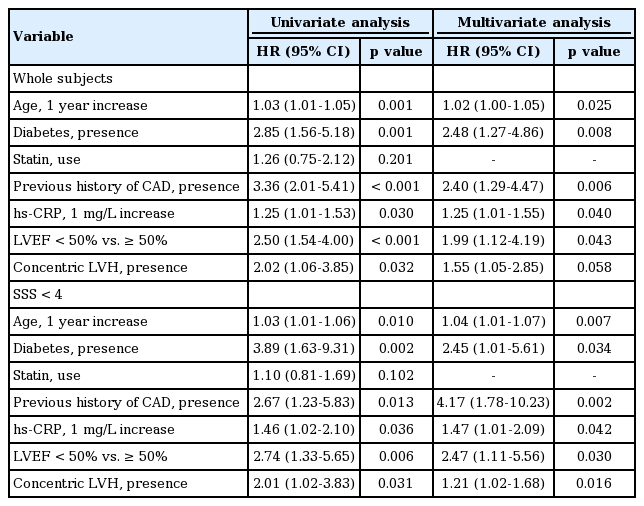
Significant predictors for composite cardiac endpoint: results of multivariate Cox-regression analysis
DISCUSSION
In a cohort of patients with asymptomatic incident ESRD, we found that long-term cardiovascular outcomes were significantly better in patients with normal perfusion scans than in those with abnormal scans (annual risk per person-year of follow-up, 6.4% vs. 13.2%). However, even in patients with normal perfusion scans, the cardiac event rate significantly differed according to baseline characteristics such as age, diabetes, previous history of CAD, inflammatory status, and baseline left ventricular (LV) function.
Recently, cardiac surveillance and adequate risk stratification have become main issues in ESRD management. As patients with ESRD comprise a high-risk cohort with various uremia-specific risk factors, the screening and treatment of CAD are becoming increasingly recognized as global health burdens. However, due to the heterogeneity among patients with ESRD, more complex risk stratification methods are needed. Particularly, efforts to identify patients at low risk of cardiac events are required to avoid unnecessary testing and treatment. In this regard, stress-rest gated SPECT could play an important role in categorizing patients as high versus low risk. The presence of reversible perfusion defects or an increased SSS, SDS, or SRS usually indicates a high risk of future cardiac events [11,12]. Conversely, a normal perfusion scan may be able to identify patients at sufficiently low risk of cardiac events, as normal perfusion has a high negative predictive value for CAD [7,8,13]. However, there are little data available regarding the prognostic value of normal perfusion scans in patients with ESRD.
According to our data, normal perfusion was clearly associated with favorable long-term outcomes in patients with ESRD. The annual rate of cardiac events for patients with ESRD with normal perfusion scans was only half that for those with abnormal perfusion scans (6.4% vs. 13.2%). Nevertheless, considering that cardiac event rates are less than 1% per year following a normal perfusion scan in the general population [7], it is obvious that patients with ESRD are likely at significantly higher risk of cardiovascular events. Another important finding in our study was that even in patients with normal perfusion scans, the long-term prognosis was dependent on comorbid conditions at the start of HD. Baseline clinical factors such as advanced age, diabetes, smoking, a previous history of CAD, and higher hs-CRP levels dramatically altered the risk of adverse cardiac events, suggesting that clinical characteristics influence patient outcomes and yield an incremental prognostic value over SPECT data.
The significance of the effects of baseline characteristics on cardiac outcomes was also demonstrated by the finding that young, asymptomatic patients with few risk factors had a much lower cardiac event rate (1.2%) than that of other patients, and this low rate was comparable with data from the general population with normal perfusion scans. Together with previous data demonstrating that clinical risk factors and a previous history of CAD may influence cardiac event rates even after a normal perfusion scan [7,10], our findings emphasize the importance of baseline comorbid conditions for predicting cardiac events in patients with ESRD. In addition, a close relationship between chronic inflammation and cardiovascular disease was observed in our patients with normal SPECT data. The serum hs-CRP level was a strong, independent predictor of cardiac events. Unsurprisingly, the role of elevated hs-CRP levels in predicting cardiovascular disease has been well established in patients with ESRD [14]. In a study performed by Menon et al. [15] and Wanner et al. [16] involving 280 stable HD patients, those in the highest hs-CRP quartile had a 2.4-fold higher risk of all-cause mortality and a 1.7-fold higher risk of cardiovascular mortality compared with those in the lowest quartile.
With respect to baseline cardiac measures, LVH, LV systolic dysfunction, and increased LV mass were important predictors of adverse cardiac events. In our study, every 10-unit increase in the LVMI and concentric LVH increased the adjusted HR for cardiac events by 12% and 20%, respectively. In particular, the prognostic values of these echocardiographic parameters were independent of traditional and novel risk factors such as age, diabetes, a previous history of CAD, and elevated hs-CRP levels. Indeed, increases in the LVMI or LVH are well-established risk factors for adverse cardiac outcomes in both patients with or without chronic kidney disease [17]. In line with our findings, Zoccali et al. [18] reported a 50% risk of mortality and > 85% risk of cardiovascular events after 3 years of conventional HD treatment in patients in the highest tertiles of LV mass change. The investigators also reported the prognostic value of LV systolic dysfunction with LVEF and fractional shortening at the endocardial and midwall levels in a cohort of 254 patients with asymptomatic dialysis [19]. As a result, increased LV mass (LVH) and preexisting LV systolic dysfunction may be useful parameters for risk stratification in patients with ESRD with normal perfusion scans [20].
Our study had several shortcomings. First, 81 patients (28.3%) were referred from other private clinics for evaluation and treatment of renal dysfunction, potentially limiting generalizability. Second, a normal perfusion scan cannot exclude the presence of significant coronary stenosis. Although a normal perfusion scan was associated with a low risk of cardiac events in our study, these findings could not confirm whether normal or insignificant coronary stenosis contributed to the favorable prognosis, because further testing such as coronary computed tomography or coronary angiography was not performed. Therefore, further evaluation of the relationship between coronary angiographic results and perfusion scores is needed. Third, as follow-up SPECT data were not available for most cases, we could not evaluate how long the risk remains low after a normal perfusion scan. According to previous studies, repeating SPECT every 2 years is considered reasonable for patients with ESRD with normal results on initial evaluation [21].
In conclusion, patients with ESRD with normal perfusion scans had a significantly lower risk of cardiovascular disease than did those with abnormal perfusion scans. However, even in patients with normal perfusion scans, the cardiovascular prognosis is largely dependent on baseline inflammation and comorbid conditions. Further large-scale studies with more precise risk stratification are needed in this population.
KEY MESSAGE
1. Normal perfusion was clearly associated with favorable long-term outcomes in patients with end-stage renal disease (ESRD).
2. In patients with ESRD with normal perfusion scans, the cardiovascular prognosis is largely dependent on baseline inf lammation and comorbid conditions.
Notes
No potential conflict of interest relevant to this article was reported.