Comparison of liquid-based cytology (CellPrepPlus) and conventional smears in pancreaticobiliary disease
Article information
Abstract
Background/Aims
Endoscopic ultrasound-guided fine needle aspiration (EUS-FNA) and brushing cytology are used worldwide to diagnose pancreatic and biliary malignant tumors. Liquid-based cytology (LBC) has been developed and it is currently used to overcome the limitations of conventional smears (CS). In this study, the authors aimed to compare the diagnostic value of the CellPrepPlus (CP; Biodyne) LBC method with CS in samples obtained using EUS-FNA and brushing cytology.
Methods
This study prospectively enrolled 75 patients with pancreatic or biliary lesions from June 2012 to October 2013. For cytological analyses, including inadequate specimens, benign and atypical were further classified into benign, and suspicious and malignant were subcategorized as malignant. Sensitivity, specificity, accuracy, and positive predictive values (PPV) and negative predictive values (NPV) were evaluated.
Results
In the EUS-FNA based cytological analysis of pancreatic specimens, CP had a sensitivity of 60.7%; specificity, 100%; accuracy, 77.1%; PPV, 100%; and NPV, 64.5%. CS had a sensitivity of 85.7%; specificity, 100%; accuracy, 91.7%; PPV, 100%; and NPV, 83.3%. In the brushing cytology based analysis of biliary specimens, CP had sensitivity of 53.1%; specificity, 100%; accuracy, 54.5%; PPV, 100%; and NPV, 6.3%. CS had a sensitivity of 78.1%; specificity, 100%; accuracy, 78.8%; PPV, 100%; and NPV, 12.5%.
Conclusions
Our study found that CP had a lower sensitivity because of low cellularity compared with CS. Therefore, CP (LBC) has a lower diagnostic accuracy for pancreatic EUS-FNA based and biliary brush cytology based analyses compared with CS.
INTRODUCTION
Pancreatic and biliary malignant tumors are asymptomatic and are often detected as advanced forms at small sizes, and owing to the difficulty of their diagnosis and treatment, they are cancers with a poor prognosis [1,2]. In recent years, percutaneous fine needle aspiration (FNA), using endoscopic ultrasound (EUS), has been a common approach when a pancreatic mass is suspected, while brush cytology through endoscopic retrograde cholangiopancreatography (ERCP) is commonly used when malignancy differentiation is required for lesions in bile ducts.
The obtained cells are subjected to Papanicolaou (or Diff-Quik) staining after being wet-fixed or air-dried, followed by observation under a microscope [3]. Recently, EUS-FNA for diagnosis of pancreatic solid masses has been reported to have a sensitivity of 78% to 95%, specificity of 75% to 100%, and accuracy of 78% to 95%, a great improvement compared to previous methods, but its negative predictive values (NPV) are still low [4,5]. Similarly, biliary brush cytology makes malignancy differentiation challenging because of its low sensitivity of 33% to 68% [6-8], and continuous efforts have been made to improve its sensitivity.
Liquid-based cytology (LBC) was developed in 1991, because of the efforts to improve the quality of samples and effectiveness of cytological tests, and since then, it has been widely utilized in various organs and specimens as well as for cervical cytology. With its effectiveness proven for some diseases, it has tended to replace conventional smears (CS) [9-11]. However, rarely have studies applied LBC to cytologically analyze the pancreatobiliary tumors and no studies have ever been carried out using CellPrepPlus (CP; Biodyne, Seongnam, Korea), one of the commercially available LBCs.
In this comparison study, CS, CP, and cell block (CB) tests were carried out on cell specimens obtained via EUS-FNA and brushing cytology from patients with pancreatobiliary tumors to investigate the diagnostic accuracy of these tests and to evaluate the diagnostic usefulness of CP versus CS, which is the main objective of this study.
METHODS
Patients
This study was performed on patients suspected of having malignant pancreatobiliary tumors who were hospitalized in the Gastroenterology Department after June 1, 2012. After a computed tomography scan of the abdomen, subjects were assigned to the EUS-FNA group if a malignant tumor was suspected in their pancreas while they were allocated to the ERCP group when biliary tract cancer was a possible diagnosis. One of the two researchers carried out the study regarding the pancreas and the other did the study on the bile ducts so that a comprehensive conclusion could be drawn after analysis of the two studies. Patients were deemed ineligible and excluded from the study if they had severe cardiopulmonary disease, were 90 years old or older, had a body mass index of 30 or more, or if they were not suitable for endoscopic examinations. Final diagnoses were made via biopsy, surgery, or clinical progress, and follow-up was for a minimum of 6 months. This study was approved by the Institutional Review Board of the Chungbuk National University Hospital (CBNU-IRB-2012-11-105). Informed consent was waived due to the nature of this study and the study was conducted in accordance with the guidelines in the Declaration of Helsinki.
Study methods
EUS-FNA cytology
A linear echoendoscope (Olympus, Tokyo, Japan) and a 22-gauge FNA Echo-tip needle (Wilson-Cook Medical Inc., Winston-Salem, NC, USA) were used for the EUS-FNA. All endoscopic procedures were performed by two experienced endoscopists. Specimens were collected more than five times after around 10 times of going back and forth through the puncture using EUS-FNA until an adequate number of cells were visually confirmed because an onsite pathologist was not available. Specimens were pushed out using a stylet, and a 10 mL syringe was used to push through to confirm there was no remainder. Initially obtained specimens were subjected to CS and latter specimens were used for sample preparation for CP and CB. A minimum of five slides were obtained and the specimens were immediately fixed using 95% alcohol. All of the specimens were transferred to the pathology laboratory after the slides were prepared.
Then, according to the protocol, Papanicolaou staining was performed to prepare the slides for smears, and a CellPrepPlus kit, reagents, and devices were used for slide preparation for LBC. For CBs, the remaining precipitates were fixed in 95% alcohol and placed in a test tube. They were then subjected to centrifugation at 4,000 rpm for 6 minutes to obtained precipitates to be fabricated into paraffin blocks. The blocks were cut into 5 μm slices and subjected to hematoxylin & eosin staining.
Brush cytology
ERCP also was carried out by the same two experts. During ERCP, brush cytology was performed more than five times on the strictures observed on the radiograph, using an 8 Fr. brush (Wilson-Cook Medical Inc.) through biopsy channels. Primary specimens were used for sample preparation for CS, secondary specimens for CP, tertiary specimens for CB, and then the fourth and five specimens were used for additional CS and CP. Slide preparation was carried out as described above for EUS-FNA cytology.
For objective analyses, the CP, CS, and CB were analyzed by a pathologist who was not aware of the clinical diagnosis, using an Olympus BX51. The quality of the samples was assessed based on cellularity, bloody background, and dryness based on the nuclear details of the cells, single atypical cells, size variations, and coarse chromatin.
Definitions
Cytological results were classified into inadequate and adequate; inadequate specimens were categorized into scant, dry, and squeeze; and adequate specimens were divided into benign, atypical, suspicious, and malignant. The cellularity of all specimens was graded into four levels (0, none; 1, scanty or a few clusters; 2, intermediate; 3, plenty of cells). Bloody background of all specimens was divided into two groups (0, not bloody; 1, bloody).
The final diagnosis was determined based on biopsies, postoperative pathologic findings, and clinical follow-up observations. A final diagnosis as benign was made according to the progress of radiological studies performed for at least 6 months.
For cytological analyses, including inadequate specimens, negative and atypical were classified as benign, and suspicious and malignant were classified as malignant.
Statistical analysis
We adopted the noninferiority principle to calculate of the sample size for the EUS-FNA group. Based on a previous study by Lee et al. [12], the accuracy of smear was estimated to be approximately 95% and that of LBC would be noninferior if the difference was less than 10%. With a power of 90%, the calculated sample size to detect statistically significant inferiority (p < 0.05) was 41 cases. We used the same method for calculation of the sample size of the ERCP group. Based on a previous study by Volmar et al. [7], the accuracy of smear was estimated to be approximately 74% and that of CP would be noninferior if the difference was less than 10%. With a power of 90%, the calculated sample size to detect statistically significant inferiority (p < 0.05) was 165 cases. Statistical analyses were performed using SPSS software version 18.0 (SPSS Inc., Chicago, IL, USA).
RESULTS
This study was commenced when 82 patients were recruited as subjects of the study during the period of June 1, 2012 and October 30, 2013 (EUS-FNA, n = 50; ERCP, n = 32) after seven patients from the EUS-FNA group were further excluded when they were found to have cystic lesions (Tables 1 and 2, Fig. 1).
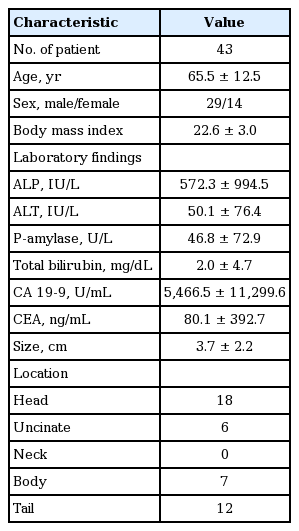
Baseline characteristics of EUS-FNA group
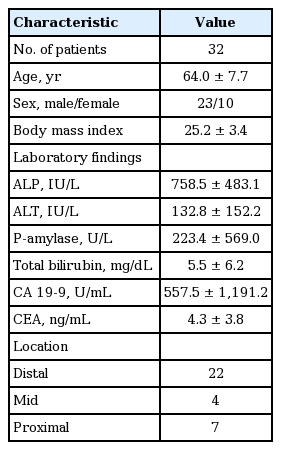
Baseline characteristics of ERCP group
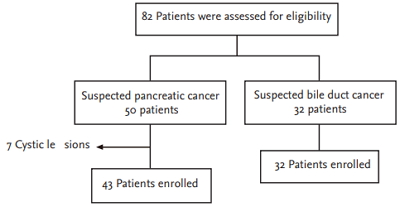
Flow chart.
Despite collecting 165 samples, after analyzing 34 cases, we found that there were too many inadequate specimens because of the low cellularity obtained using CP. The study had to be conducted using fewer cases because it would have posed too much risk for patients if the ERCP operation time had been extended in an attempt to obtain enough cells. EUS-FNA was performed twice for five patients, and 48 specimens were obtained in all. In addition, ERCP and brush cytology were performed on 32 patients and 33 specimens were thus obtained after duplicate tests performed on one patient.
Pancreas
Of the total slides, 20 inadequate samples (41.7%) were found for CP, six for CS (12.5%), and 16 for CB (33.3%). All inadequate slides for CP were scant. Five scant and one dryness slides were included for CS and 15 scant and one squeezing slides were used for CB.
Comparing the cytological diagnosis of CP and CS, of the 21 malignant specimens on CS, on CP, six were inadequate, one atypical, eight suspicious, and six malignant. Of the six inadequate specimens on CS, five were inadequate and one was benign on CP. Among the 20 inadequate specimens on CP, five were found to be inadequate, six benign, two atypical, one suspicious, and six malignant on CP, whereas six malignant specimens on CP were all found malignant using CS (Table 3).
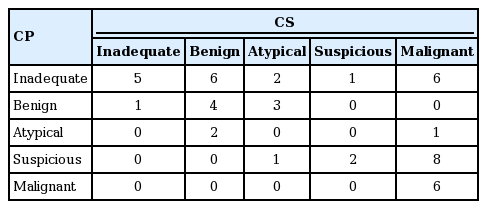
Comparison of the cytologic diagnosis between CP and CS in EUS-FNA cytology
On CP, CS, and CB, suspicious and malignant were classified as malignant, and negative and atypical, including inadequate, were categorized as benign in order to obtain the cytological sensitivity, specificity, accuracy, positive predictive values (PPV), and NPV. As a result, CP had 60.7% sensitivity, 100% specificity, 77.1% accuracy, 100% PPV, and 64.5% NPV; CS had 85.7% sensitivity, 100% specificity, 91.7% accuracy, 100% PPV, and 83.3% NPV; and CB had 58.3% sensitivity, 100% specificity, 76.2% accuracy, 100% PPV, and 64.3% NPV (Table 4).
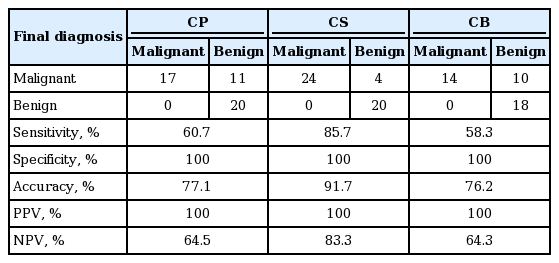
Diagnostic efficacy of CP, CS, and CB methods in EUS-FNA cytology
The sensitivity of CS was significantly higher than that of CP. The addition of CP did not grant any diagnostic improvements to CS alone (Table 5).
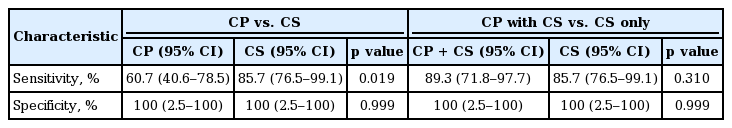
Comparisons of operative characteristics in EUS-FNA group
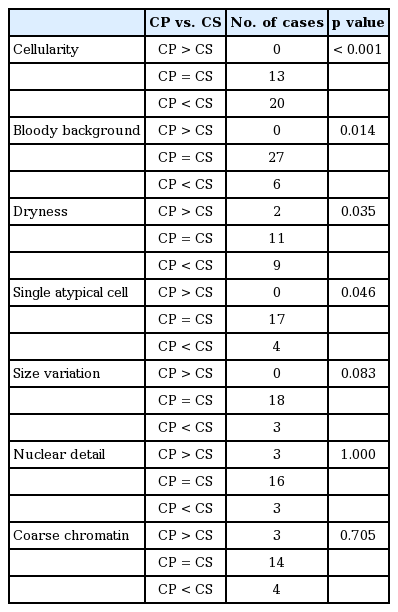
Sample quality was investigated based on the cellularity, bloody background, dryness, single atypical cell, size variation, nuclear detail, and coarse chromatin. The characteristic cytological features observed in samples prepared using the CP and CS methods are summarized in Table 6. Cellularity of CS was more abundant than CP (p < 0.001). No CP samples showed higher cellular density than CS. However, CP showed a cleaner background with only a small amount of blood. Nuclear details were clearly visible in most cases, but four samples on CP were clearly visible although not as clear as on CS. Excluding the inadequate slides, the CP samples showed better quality than CS, but with no influence on the diagnoses.

Comparisons of general cytological features between CP and CS in EUS-FNA cytology
Bile duct
Among 32 subjects, 31 were diagnosed as malignant; 18 were confirmed via surgery, seven via biopsy, and six via radiological examinations and clinical progress. One of the subjects tested benign on CP, CS, and CB at the first test whereas the second test resulted in a diagnosis of adenocarcinoma on CP, CS, and CB.
Of all slides, nine inadequate samples (27.3%) were found on CP, two (6.1%) on CS, and 12 (45.5%) on CB. All of these samples were inadequate as scants on CP. One scant and one squeeze sample on CS and 14 scants and one squeeze sample in the cellblock were determined inadequate.
In the cytological diagnostic comparison of CP and CS, nine inadequate samples on CP included three malignant, two suspicious, one atypical, one benign, and one suspicious on CS. In contrast, two inadequate specimens on CS were all found inadequate by using CP (Table 7).

Comparison of the cytologic diagnosis between CP and CS in brush cytology
Similar to that of the pancreas, suspicious and malignant were classified as malignant, and negative and atypical, including inadequate, were categorized as benign, followed by investigating the cytological sensitivity, specificity, accuracy, PPVs, and NPVs for CP, CS, and CB. Sensitivity, specificity, and accuracy were 53.1%, 100%, and 54.5% for CP; 78.1%, 100%, and 78.8% for CS; and 40.6%, 100%, and 42.4% for CB. PPVs and NPVs were 100% and 6.3% on CP; 100% and 12.5% on CS; and 100% and 5.0% on CB (Table 8).
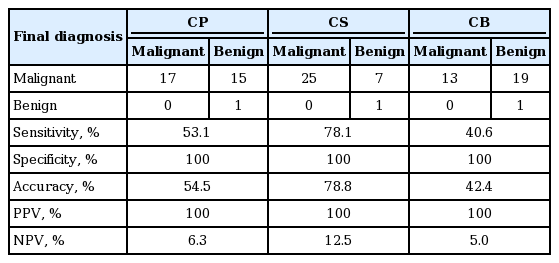
Diagnostic efficacy of CP, CS, and CB methods in brush cytology
The sensitivity of CS was significantly higher than that of CP. The addition of CP did not grant any diagnostic improvements to CS alone (Table 9).

Comparisons of operative characteristics in ERCP group
The characteristic cytological features observed in samples prepared using the CP and CS methods are summarized in Table 10. Cellularity in CS was more abundant than CP. A bloody background was not found on CP. The number of dryness specimens for CS was more than for CP. Nuclear details were clearly visible in most cases.
Comparisons of general cytological features between CP and CS in ERCP group
DISCUSSION
Patients diagnosed with advanced pancreatic cancer have a less than 5% 5-year survival rate, and surgical resection is possible in only around 15% of pancreatic cancer cases. On the contrary, patients with early pancreatic cancer less than 2 cm and 1 cm have a 30% to 60% surgical resection rate and a greater than 75% survival rate, respectively; indicating that early detection of pancreatic cancer greatly influences its treatment and prognosis [1]. Recently, the early detection rate has increased because of an increased frequency of health examinations. With diagnostic accuracy and usefulness, remaining paramount, cytological diagnoses mostly rely on CS.
Similarly, cytological and histological diagnoses are essential for diagnostic confirmation and treatment of cholangiocarcinoma, and early diagnoses have a significant effect on treatment and prognosis. The only radical treatment for cholangiocarcinoma is complete surgical resection. The 5-year survival rate after radical resection of hilar cholangiocarcinoma is 30% to 50%, while it is only 0.4% in patients who do not undergo resection, showing it is difficult to expect long-term survival without surgical resection [2,3].
In general, specimens are obtained via a percutaneous or endoscopic approach to the lesions. Pancreatic specimens are obtained using an endoscopic approach, such as EUS-FNA, while biliary specimens are obtained using brush cytology or endobiliary forceps biopsy while performing ERCP. Previous studies suggest that EUS-FNA for diagnosis of a pancreatic solid mass has been improved to a sensitivity of 78% to 95%, specificity of 75% to 100%, and accuracy of 78% to 95%, but its NPV are still low [4,5]. Similarly, biliary brush cytology has a high specificity of 95% to 100%, but a low sensitivity of 35% to 68% [6-8,13,14], which causes difficulties in malignancy differentiations; hence, researchers are continuously striving for its improvement. Because EUS-FNA for diagnosing pancreatic malignant lesions or ERCP for biliary cytology is limited in repetitive testing because of its invasive nature, obtaining adequate specimens through effective tests within a short time period is important [12].
Making a diagnosis from pancreatobiliary lesion specimens is affected by diverse variables, mainly the experience of the endoscopy operators, nature of the lesions, patient condition, size and shape of the fine needle or brush, tissue treatment procedures, quality of sample slides, and experience of the pathologists. Causes of decreased sensitivity are largely divided into sample collection errors and analysis errors [13].
Since its first development in 1939, CS have been usefully employed in many fields as a screening test for malignant lesions. However, several limitations were pointed out, including cell overlaps due to the non-uniform smear, insufficient number of cells, interference by inflammatory cells and blood cells, and inadequate specimens from dryness.
To improve sample quality and test efficiency, LBC was developed in 1991 and has been commonly used since then. LBC is largely divided into filtration methods (ThinPrep, CP, E-Prep) and precipitation methods (SurePath, Liqui-PREP). CP, used in this study, is an automated LBC using a filtration method developed in Korea, which utilizes a vacuum filtration system for cell filtration [11]. Collected samples are suspended in a liquid fixing solution and placed on the test device, followed by attaching the cells suspended in the fixing solution to a filter of adequate pressure. By contacting this to a slide, a thin cell layer slide 20 mm in diameter is fabricated [15]. Such automated LBC substitutes for the CS, and its usefulness has been reported particularly for obtaining exfoliative cells during cervicovaginal cytology, and it has been applied to various cytological specimens including body fluid, urine, and sputum, showing favorable outcomes.
Compared to the CS, LBC has sound sample quality, ease of use owing to automation, shortened analysis time, fewer cellular overlaps and dryness, and fewer effects from blood and inflammation. Moreover, immunohistochemical and molecular studies are possible on the remaining specimens after LBC, if needed [11,16,17]. However, some studies show LBC has a lower sensitivity due to low cellularity compared to CS, and there is controversy as to its feasibility for some specimens [4,18].
Few studies applying LBC for pancreatobiliary lesions have been published and no studies have ever been carried out using CP. This study compared the diagnostic outcomes of three cytological methods including CP, CS, and CB, and evaluated the diagnostic usefulness of CP relative to CS.
An interim analysis was carried out on 50 subjects in the EUS-FNA group and 32 in the ERCP group because a number of inadequate specimens were identified throughout the study. In both the EUS-FNA and ERCP groups, our results showed a significantly lower sensitivity of CP compared to CS, as expected. Therefore, we decided to stop recruiting subjects considering the costs and possibility of complications associated with prolonged operation times.
In the EUS-FNA cytology based analysis of pancreatic specimens, specificity and PPV were the same for all three cytological methods at 100%. LBC had a sensitivity of 60.7%, accuracy of 77.1%, and NPV of 64.5%; CS had a sensitivity of 85.7%, accuracy of 91.7%, and NPV of 83.3%; CB had a sensitivity of 58.3%, accuracy of 76.2%, and NPV of 64.3%.
For the biliary brush cytology, specificity and PPV were also the same for all three cytological methods at 100%. However, sensitivity, accuracy, and NPV were 53.1%, 54.5%, and 6.3% for LBC, respectively; 78.1%, 78.8%, and 12.5% for CS; and 40.6%, 42.4%, and 5.0% for CB.
For EUS-FNA cytology, the sensitivity and specificity of CS were found to be similar to that of previous studies whereas the sensitivity and NPV of CP were remarkably decreased. This is primarily because of the substantial number of inadequate specimens on CP, and the inadequate specimens are all attributable to an insufficient number of cells. In a recent study by Lee et al. [12], eight inadequate specimens were found on CS whereas 20 were found on LBC (ThinPrep), and LBC had a sensitivity of 75%, accuracy of 81%, and NPV of 56%.
For the biliary brush cytology, the sensitivity of CS was 78.1%, which was higher than or similar to previous studies, but CP’s sensitivity was markedly low at 53.1%. The proportion of inadequate specimens was 6.1% on CS but was much higher for CP at 27.3%, which is attributed to the lack of cells, similar to that of pancreatic FNA.
Among the pancreatobiliary samples, using CP, the monolayer preparation technique, cells can be stained better because of the absence of obscuring blood elements and air-drying artifacts that are commonly encountered in CS (Fig. 2). However, this did not appreciably influence the cytologic diagnosis. Although CP can provide qualified slides and reduce the analysis time compared to CS, with its many inadequate specimens because of the insufficient number of cells, CP is unlikely to substitute for CS as a diagnostic tool for pancreatobiliary diseases.

Microscopic images of various specimens of bile fluid are shown. (A) Conventional smear shows larger tumor clusters with dirty background (Papanicolaou stain, ×200). (B) CellprepPlus (Biodyne) liquid-based cytology specimen shows smaller tumor clusters with clear background (Papanicolaou stain, ×400). (C) Cell block specimen, which is treated with albumin, embedded with paraffin, and sliced into 4-μm section, shows cell clusters in the protein background (×400).
A significant limitation of our study was that it was not a randomized trial. The study design might have a lack of standardization when it comes to the number of passes for each method and it is also biased in favor of smear methods. Therefore, caution is needed in analyzing the results. Another limitation of the study includes its small sample size as well as the fact that there was no on-site cytopathologist available who could evaluate the sample’s adequacy at the time of collection.
In addition, cellularity issues on CP can be caused by technical issues during sample preparation. A few studies showed that CP is not inferior compared to other LBCs and is even superior in some aspects [19]. However, there are no studies that compared CP to CS for FNA from solid organs with a relatively small amount of cells or biliary brush cytology and other LBCs. The CP used in this study utilizes a vacuum filter system for cell filtration. This filtration method using a vacuum filters the cell mass unlike the precipitation methods, and may be unfavorable in terms of cell count.
FNAs of solid organs do not have abundant aspirated cells, and cells are diluted when placed in a liquid medium for LBC. Then, once the cells are attached to slides via filtration, the cell count is further reduced. Such phenomenon would be unfavorable for CP, which uses a greater amount of diluents compared to other filtration liquid-based cytological methods [11].
Therefore, if techniques that reduce the number of inadequate specimens owing to a lack of cell count are developed, LBC utilization for pancreatobiliary cytology could become feasible.
In this study, LBC (CP), CS, and cellblock were performed prospectively to investigate the usefulness of LBC for 48 pancreatic EUS-FNA specimens and 33 biliary brush cytology specimens obtained from 75 pancreatobiliary patients. Most of the slides using LBC had a lower cellularity and a clear background. Consequently, LBC had a lower diagnostic yield and accuracy when using pancreatic EUS-FNA cytology and biliary brush cytology compared with CS.
KEY MESSAGE
1. Liquid-based cytology is widely used for preparing gynecological and nongynecological cytology specimens.
2. Compared to the conventional smear, liquid-based cytology possesses sound sample quality, easiness owing to automation, shortened analysis time, fewer cellular overlaps and dryness, and fewer impacts from blood and inflammation.
3. Liquid-based cytology showed a lower diagnostic rate in pancreatic endoscopic ultrasound-guided fine needle aspiration cytology and biliary brush cytology compared to conventional smears.
Notes
No potential conflict of interest relevant to this article was reported.