An overview of meta-analysis for clinicians
Article information
Abstract
The number of medical studies being published is increasing exponentially, and clinicians must routinely process large amounts of new information. Moreover, the results of individual studies are often insufficient to provide confident answers, as their results are not consistently reproducible. A meta-analysis is a statistical method for combining the results of different studies on the same topic and it may resolve conflicts among studies. Meta-analysis is being used increasingly and plays an important role in medical research. This review introduces the basic concepts, steps, advantages, and caveats of meta-analysis, to help clinicians understand it in clinical practice and research. A major advantage of a meta-analysis is that it produces a precise estimate of the effect size, with considerably increased statistical power, which is important when the power of the primary study is limited because of a small sample size. A meta-analysis may yield conclusive results when individual studies are inconclusive. Furthermore, meta-analyses investigate the source of variation and different effects among subgroups. In summary, a meta-analysis is an objective, quantitative method that provides less biased estimates on a specific topic. Understanding how to conduct a meta-analysis aids clinicians in the process of making clinical decisions.
INTRODUCTION
New medical studies are being published continuously and clinicians are faced with increasingly large amounts of new information, to the point where it has become nearly impossible for clinicians to read and evaluate all available data in a medical field. In addition, the study results are not consistently reproducible and the results of individual studies are often insufficient to provide confident answers [1]. Many studies have false-positive results (type I errors) or are unable to detect small effects (false-negative, type II errors) [2]. Consequently, clinical decision making is particularly difficult when the published data are conflicting or the sample size is too small to be reliable [3].
Evidence-based medicine is the best available evidence in the medical literature [4]. Moreover, the best evidence in evidence-based medicine is from meta-analyses, which provide a less biased, more precise estimate on a clinical issue [5]. “Meta” comes from the Greek for “after” or “beyond”; a meta-analysis is an “analysis of analyses” [6]. In other words, it is a statistical technique for combining the results from different studies on the same topic [7], and is becoming popular for resolving discrepancies in clinical research. As such, a meta-analysis is an objective, quantitative synthesis of research findings [7] that increases the statistical strength and precision for estimating effects by combining the results of previous studies and, thus, overcoming the problem of small sample sizes and inadequate statistical strength [8]. A meta-analysis can explore the sources of heterogeneity, and identify subgroups associated with the factor of interest, potentially providing new insights for future studies [9]. When conducted properly, a meta-analysis of medical studies is considered decisive evidence, as it occupies a top level in the hierarchy of evidence [5]. Therefore, meta-analysis is a more efficient and effective standard method for summarizing the results of many studies than is subjective judgment; therefore, it has become an important research strategy, and is progressively expanding. For example, a PubMed search of the title word “meta-analysis” produced 120,537 possible articles.
It is necessary to understand the statistical principles of meta-analysis in evidence-based medical practice, and it is important that clinicians understand its methods, advantages, and limitations. Therefore, this review introduces the basic concepts, steps, advantages, and caveats of meta-analysis, to help clinicians understand meta-analysis in clinical practice and research.
HOW TO PERFORM A META-ANALYSIS
Table 1 summarizes the general process of meta-analysis in medical studies. General or specialized statistical programs, such as STATA, SAS, R, Review Manager, or Comprehensive Meta-Analysis, are used to perform the statistical analysis of a meta-analysis.
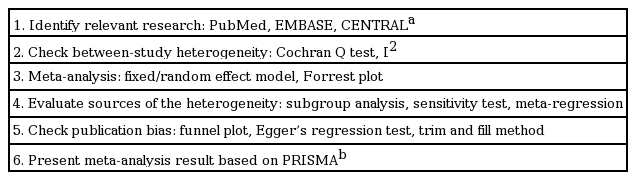
General method of medical studies meta-analysis
Identification of relevant studies
The identification of all relevant papers is a critical component in a meta-analysis because its outcome depends on the studies included [10]. The search strategy has to be comprehensive, and more than one database should be searched. The three electronic databases that are considered to be the most important sources of medical studies are commonly searched, i.e., PubMed, EMBASE, and The Cochrane Central Register of Controlled Trials (CENTRAL) [11].
Heterogeneity
A meta-analysis examines the existence of heterogeneity among primary studies and analyzes the variance in the results of different studies; meta-analysis heterogeneity is the degree of dissimilarity in the individual study results [7]. The heterogeneity test examines the null hypothesis, i.e., there are no differences in the findings of the primary studies. Statistical tests, such as Cochran’s Q test and the I2 value, have been developed to detect and quantify heterogeneity in meta-analysis. Specifically, Cochran’s Q test is used to determine whether there are differences between primary studies or if the variation seen is due to chance [12]. Cochran’s Q-value is calculated by summing the squared deviations of the estimate of each study from the overall estimate and subsequently comparing it with the chi-square distribution with κ–1 degrees of freedom (df), where κ is the number of studies [12]. However, the Q test may be unreliable when the meta-analysis involves a small number of studies. Therefore, a heterogeneity p < 0.10 (not 0.05) indicates the presence of heterogeneity, since Cochran’s Q test has low statistical strength and is insensitive [13]. Another commonly used method for testing heterogeneity is the I2 value, which quantifies the effect of heterogeneity, and does not depend on the number of studies or the type of outcome data. I2 values range between 0% and 100%, and represent the proportion of inter-study variability that can be attributed to heterogeneity rather than chance [I2 = 100% × (Q – df)/Q] [14]. I2 values of 25%, 50%, and 75% are considered low, moderate, and high estimates, respectively [14,15].
Fixed versus random effects models
A meta-analysis combines the effect sizes of the included studies by weighting the data according to the different amounts of information in each study. The weights are calculated using the sample size or the variance of each study [8]. There are two statistical models for a meta-analysis: the fixed effect and random effect models. The fixed effect model assumes that all of the studies in the meta-analysis have one true effect size, and the observed variation among studies is caused by sampling errors or chance [16]. The random effect model assumes that different studies exhibit substantial diversity, and the true effect size may vary from study to study [17]. Consequently, the fixed effect model assesses only intra-study sampling errors (intra-study variation), while the random effect model assesses both intra-study sampling errors and inter-study variance (between-study variation) [18]. As such, the choice of meta-analysis model depends on the presence or absence of heterogeneity. In the absence of heterogeneity (heterogeneity p ≥ 0.10), a fixed effect model is used. However, when the Q-value is significant (p < 0.10), indicating the existence of heterogeneity in the studies, a random effect model should be used for the meta-analysis [19]. When the study groups are homogeneous, both models offer similar results; nonetheless, in the case of heterogeneity, the random effect model typically provides wider confidence intervals (CIs) than the fixed effect one [20].
Evaluation of the causes of heterogeneity
It is important to assess the presence of heterogeneity among the studies included in a meta-analysis, and determine the possible causes of heterogeneity, since it can lead to bias, referred to as “mixing apples and oranges,” in the meta-analysis results [21]. As a result, subgroup analysis is used to assess the impact of heterogeneity, using factors such as ethnicity, number of studies, or clinical features to assess the impact of a potential source of heterogeneity. Sensitivity testing may also be performed to assess the influence of each individual study on the pooled effect size by omitting each individual study [22]. Meta-regression is used to explore the reasons for the heterogeneity and adjust for confounding effects, and is feasible if sufficient data are reported in the individual studies [23].
Publication bias
Studies showing positive effects tend to be published more frequently than those that do not, and studies showing no significant results tend to remain unpublished [24]. As a meta-analysis includes only published studies, it might overestimate the actual effect degree [24]. This outcome is called “publication bias.” In other words, a meta-analysis may be subject to publication bias. The funnel plot is a commonly used graphic test to assess publication bias in a meta-analysis [25]. This test is a scatterplot of the effect estimate from each study in the meta-analysis against the measure of its precision (1/standard error) or sample size [26]. The effect estimates of small studies will scatter at the bottom of the graph, while the spread of larger studies will be narrower. In the absence of publication bias, the funnel plot produces a symmetrical inverted funnel, asymmetry being suggestive of a publication bias [27]. The funnel plot is a simple method, but it is difficult to interpret when the number of studies is small and can be misleading. Due to the limitations of funnel plots, which require a range of studies of varying sizes, involving subjective judgments, publication bias can be evaluated using other methods, such as Egger’s linear regression test [25], which measures funnel plot asymmetry using a natural logarithm scale of odds ratios. Egger’s regression test examines whether the intercept deviates significantly from zero in a regression of the standardized effect estimates against their precision. When asymmetry is present, the “trim and fill” method adjusts the summary estimates for observed bias [28]. This method removes or adds small studies until funnel plot symmetry is achieved by recalculating the center of the funnel before removing studies and replacing them with their missing mirrorimage counterparts. A revised summary estimate is subsequently calculated using all of the original studies and the hypothetical “filled” studies [28].
Meta-analysis publication
Preferred Reporting Items for Systematic Reviews and Meta-analyses (PRISMA) is an evidence-based set of items developed for reporting systematic reviews and meta-analyses [29]. Following the PRISMA recommendations helps authors to improve meta-analysis reporting.
STRENGTHS AND WEAKNESSES OF META-ANALYSIS
A major advantage of a meta-analysis is that it produces a precise estimate of the effect size with considerably increased statistical power, which is especially important when the power of the primary study is limited because of the small sample size. A meta-analysis also analyzes the variation in the results of different studies and quantifies result inconsistency (heterogeneity) across studies. It is also an objective, quantitative method that provides a less biased estimate on a specific topic. The main criticism of meta-analysis is that it combines different types of studies (“mixing apples and oranges”) [7]. Nonetheless, this problem can be overcome by assessing the heterogeneity in the studies and performing subgroup analysis [30]. However, if studies are too heterogeneous to be comparable, a meta-analysis should be avoided, as the meta-analysis result may be meaningless and any true effect may be obscured. The other limitation of meta-analysis is “garbage in, garbage out,” which means that if a meta-analysis includes low-quality studies with bias, the results of the meta-analysis will be biased and incorrect [31]. As such, the results of the meta-analysis depend on the quality of the primary research. Therefore, any meta-analysis should include studies selected based on strict inclusion criteria.
EXAMPLE OF A META-ANALYTIC STUDY
Tofacitinib is a novel oral Janus kinase inhibitor [32]. Several clinical trials have attempted to evaluate the efficacy and safety of tofacitinib in active rheumatoid arthritis (RA). Therefore, a meta-analysis approach to randomized clinical trial (RCT) data was used in an attempt to increase the precision and accuracy of estimates of the efficacy and safety of tofacitinib 5 and 10 mg twice daily in active RA. We performed a systematic review and meta-analysis of RCTs, examining the efficacy and safety of tofacitinib in active RA patients using PubMed, EMBASE, CENTRAL, and manual searches [33]. Five RCTs, including three phase 2 and two phase 3 trials and 1,590 patients, met the inclusion criteria [33]. The three phase 2 RCTs included 452 RA patients in the meta-analysis. The American College of Rheumatology 20% response rate (ACR20) response rate was significantly higher in the tofacitinib 5 mg group than in the controls (relative risk [RR], 2.445; 95% CI, 1.229 to 4.861; p = 0.011) (Table 2, Fig. 1). Similarly, the ACR20 response rate was significantly higher in the tofacitinib 10 mg group than in the controls (RR, 2.597; 95% CI, 1.514 to 4.455; p = 0.001) (Table 2, Fig. 1). Significant improvements were observed in the tofacitinib 5 and 10 mg groups compared with the controls for all efficacy outcomes, such as the number of tender and swollen joints, pain, patient and physician global assessments of disease activity, the Health Assessment Questionnaire, and C-reactive protein levels (Table 2). The safety outcomes did not differ between the tofacitinib 5 and 10 mg groups and placebo groups, except for infection in the tofacitinib 10 mg group (RR, 2.133; 95% CI, 1.268 to 3.590; p = 0.004) (Table 2, Fig. 2). The two phase 3 trials confirmed the findings of the meta-analysis of the phase 2 studies. The meta-analysis found that tofacitinib, at dosages 5 or 10 mg twice daily, was effective in active RA and had a manageable safety profile.
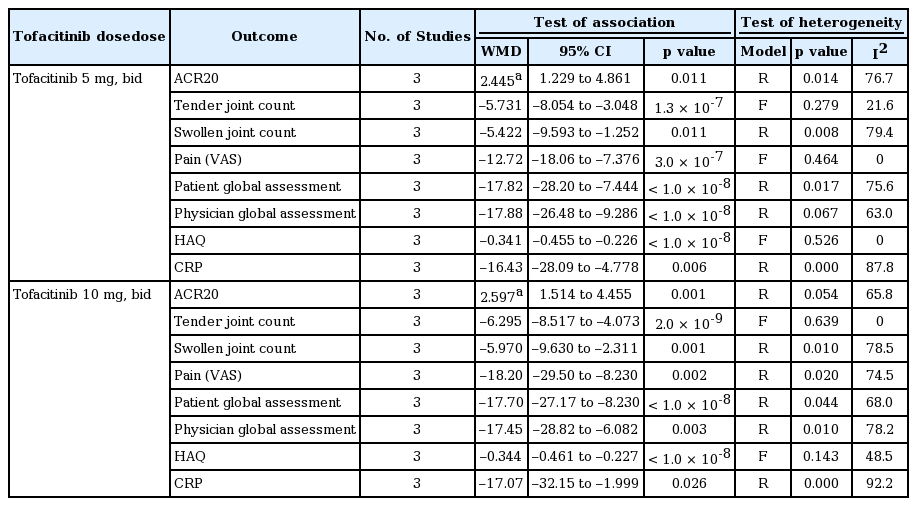
Meta-analysis of randomized controlled trials on the efficacy of tofacitinib in active RA
Meta-analysis of the efficacy of tofacitinib (A) 5 mg and (B) 10 mg twice a day on American College of Rheumatology 20% response rate in rheumatoid arthritis. CI, confidence interval.
Meta-analysis of the efficacy of tofacitinib (A) 5 mg and (B) 10 mg twice a day on number of patients withdrawn due to adverse events in rheumatoid arthritis. CI, confidence interval.
CONCLUSIONS
Meta-analyses in medical research cover a wide range of topics, from risk factors to prognosis [34,35]. Therefore, meta-analysis is applicable to a broad spectrum of topics, including biomarkers, genetic factors, diagnosis, and treatment [33,36-38]. It is also a powerful method for combining the results of different studies, and for summarizing current evidence on a specific issue objectively. Consequently, a meta-analysis provides a more precise estimate of effect sizes and investigates sources of variation and difference effects among subgroups. It can also resolve conflicts between studies, and yield conclusive results when individual studies are inconclusive. Meta-analysis is an invaluable bridge between past and future studies. Therefore, understanding meta-analysis is valuable for clinicians in the process of making clinical decisions.
Notes
No potential conflict of interest relevant to this article was reported.