Validation of the Friedewald formula for estimating low density lipoprotein cholesterol: the Korea National Health and Nutrition Examination Survey, 2009 to 2011
Article information
Abstract
Background/Aims
The aim of this study is to compare Friedewald-estimated and directly measured low density lipoprotein cholesterol (LDL-C) values and assess the concordance in guideline risk classification between the two methods.
Methods
The data were derived from the 2009 to 2011 Korea National Health and Nutrition Examination Survey. We included subjects with triglyceride (TG) levels < 400 mg/dL. Analysis was done for 6,454 subjects who had all lipid panels— total cholesterol, directly measured LDL-C, high density lipoprotein cholesterol (HDL-C), and TG.
Results
The subjects ranged in age from 10 to 87 years old. The mean age was 41.5 ± 17.3 years. For subjects with TG < 400 mg/dL, overall concordance in guideline risk classification was 79.1%. The Friedewald formula tended to underestimate LDL-C more at higher TG or lower HDL-C levels. Especially, the percent of subjects who were misclassified into a lower risk category was 31% when TG were 200 to 299 mg/dL; and 45.6% when TG were 300 to 399 mg/dL. A greater underestimation of LDL-C occurred at higher TG and lower Friedewald-estimated LDL-C levels. Of subjects with a Friedewald-estimated LDL-C < 70 mg/dL, 55.4% had a directly measured LDL-C ≥ 70 mg/dL when TG were 200 to 399 mg/dL.
Conclusions
The Friedewald equation tends to underestimate LDL-C in high-risk subjects such as hypertriglyceridemia and hypo-HDL-cholesterolemia. For these individuals accurate assessment of LDL-C is crucial, and therefore additional evaluation is warranted.
INTRODUCTION
Low density lipoprotein cholesterol (LDL-C) is an important risk factor for cardiovascular diseases (CVD), such as myocardial infarction and stroke. Additionally, LDL-C levels have been used as treatment guidelines to determine whether an individual needs therapeutic lifestyle changes or interventions such as drug treatment [1,2]. Although it is important to accurately assess LDL-C through direct measurements in routine clinical practice, LDL-C levels have generally been estimated using the Friedewald formula [3]. In the Korea National Health Screening Program (KNHSP), Friedewald-derived LDL-C estimates are calculated when triglyceride (TG) levels are lower than 400 mg/dL [4]. In 2013, of 11,380,246 participants whose lipid profile was tested in the KNHSP, there were 236,436 persons (2%) with TG levels above 400 mg/dL [5]. This means that the LDL-C levels of 98% of participants in the 2013 KNHSP were not directly measured, but indirectly measured using the Friedewald formula.
The Friedewald formula calculates LDL-C as LDL-C = total cholesterol – high density lipoprotein cholesterol (HDL-C) – (TG/5), using directly measured values of total cholesterol, HDL-C, and TG [6]. The last term, (TG/5), is an estimate of very low density lipoprotein cholesterol (VLDL-C). The inaccuracy of the Friedewald formula when TG levels are above 400 mg/dL was first demonstrated by Friedewald et al. [6]. A number of later studies have cautioned against relying on the Friedewald formula even when TG levels are under 400 mg/dL, suggesting that the Friedewald formula may still underestimate LDL-C and; thereby, CVD risk when TG levels are less than 400 mg/dL. Several studies have shown that CVD risk is especially underestimated when TG levels are high [7,8] and when the Friedewald-estimated LDL-C is low [9,10]. Recently, Martin et al. [11] analyzed the concordance in guideline risk classification by the Friedewald estimates and by LDL-C direct estimates in 1,340,614 adults. They found that LDL-C levels were underestimated in 19,677 of 33,106 persons (59.4%) with TG levels of 200 to 399 mg/dL and a Friedewald estimate of less than 70 mg/dL of LDL-C.
Notwithstanding the cost-effectiveness of the Friedewald formula for LDL-C estimation, underestimating LDL-C levels may lead to misclassified CVD risk assessments and to major societal costs in the future from the poor prevention and management of CVD. Nonetheless, the Friedewald formula is commonly used to estimate LDL-C in routine practice worldwide. To this end, we validated the accuracy of the Friedewald formula using nationwide data from the Korea National Health and Nutrition Examination Survey (KNHANES). We also analyzed the agreement between the Friedewald estimates of LDL-C (LDL-CF) and directly measured LDL-C levels (LDL-CD), and the concordance between these measurements in determining the LDL-C risk classification used in clinical practice. In this study, we adopted the LDL-C risk classification outlined in the revised 2015 Korean Guidelines for the Management of Dyslipidemia [12]. The revised guidelines reflect those presented in the National Cholesterol Education Program Adult Treatment Panel III (NCEP-ATP III) revised in 2002 [13], where LDL-C values were newly classified into six groups. To our knowledge, no studies have investigated the degree of concordance in the revised LDL-C risk classification between LDL-CF and LDL-CD in the Korean population.
METHODS
Subjects of the study
This study used openly accessible data from the 2009 to 2011 KNHANES [14-16]. The KNHANES is an annual, nationwide, cross-sectional survey conducted by the Korea Centers for Disease Control and Prevention. The KNHANES includes three components: a health interview, a health examination, and a nutrition survey. Questions about patients’ clinical history of CVD (cerebral infarction, myocardial infarction, or angina), comorbid diseases (hypertension, diabetes mellitus, and dyslipidemia), and medication use for comorbid diseases were included in the survey questionnaire. From 2009 onwards, the KNHANES also began to directly measure LDL-C. In this study, we used a stratified sampling method to select a representative sample of the general Korean population. To expand our sample size, KNHANES data from 2009 through 2011 were combined. We included subjects with TG levels of 400 mg/dL and lower and whose total cholesterol, LDL-C, HDL-C, and TG levels were directly measured in a lipid panel, resulting in a total of 6,454 subjects. The resulting number of KNHANES study participants by year was 1,888 in 2009 (919 men and 969 women); 2,264 in 2010 (1,099 men and 1,165 women), and 2,302 in 2011 (1,119 men and 1,183 women). The subjects ranged in age from 10 to 87 years old. This study received Institutional Review Board approval (2009-01CON-03-2C; 2010-02CON-21-C; and 2011-02CON-06-C). All participants provided written informed consent.
Serum lipid panel and LDL-C risk classification
Blood samples of participants were collected in the morning after a minimum of an 8-hour fast. Specimen-treated blood samples were cryostored and analyzed within 24 hours. Serum lipid concentrations were directly measured enzymatically using an automated chemical analyzer (Hitachi Automatic Analyzer 7600, Hitachi, Tokyo, Japan). Measurements of total cholesterol, HDL-C, LDL-C, and TG were performed using the Pureauto S CHO-N, Cholestest N HDL, Cholestest-LDL, and Pureauto S TG-N reagents, respectively (Sekisui Medical, Tokyo, Japan). During the period of this study (KNHANES 2009 to 2011), no changes were made in the measurement methods for lipid panel. The LDL-CF was calculated using these directly measured values and the following equation: LDL-CF = total cholesterol – HDL-C – (TG/5).
To assess the concordance in LDL-C risk classification between LDL-CF and LDL-CD, we classified LDL-C values into six categories (< 70, 70 to 99, 100 to 129, 130 to 159, 160 to 189, and ≥ 190 mg/dL) according to guidelines established in the 2015 Korean Guidelines for the Management of Dyslipidemia [12]. The updated clinical practice guidelines contain an evaluation of the risk factors and risk levels for CVD, and graded LDL-C treatment goals for each risk category. The previous guidelines categorized risk as high risk, intermediate risk, and low risk, and the LDL-C treatment goal for the high-risk group was 100 mg/dL or lower. The revised 2015 guidelines added a new risk category—a very high risk group—that includes patients with preexisting CVD, in whom a LDL-C treatment goal of less than 70 mg/dL is advised. Further, to assess the influence of TG and HDL-C levels on the concordance of the LDL-C risk classifications, we evaluated concordance using six strata of TG (< 50, 50 to 99, 100 to 149, 150 to 199, 200 to 299, and 300 to 399 mg/dL) and four strata of HDL-C (< 40, 40 to 49, 50 to 59, and ≥ 60 mg/dL). Hypertriglyceridemia was defined as a TG level of 200 mg/dL or higher and hypo-HDL-cholesterolemia as a HDL-C level of less than 40 mg/dL.
Statistical analysis
The SPSS version 21.0 (IBM Co., Armonk, NY, USA) was used for all statistical analyses, and p values of less than 0.05 were considered to indicate statistical significance. The independent-samples t test was used to compare TG groups (< 200 mg/dL vs. 200 to 399 mg/dL) in terms of variables such as age and lipid profile. The paired-sample t test was performed to compare the mean differences between LDL-CF and LDL-CD among various TG and HDL-C strata. The chi-square test was conducted to assess the concordance between LDL-CF and LDL-CD in LDL-C risk classification. LDL-C values were classified into different risk categories according to the 2015 Korean Guidelines for the Management of Dyslipidemia. The effect of variables such as TG and HDL-C on the concordance of the classification was evaluated using the chi-square exact test.
RESULTS
Overall and TG-stratified characteristics of the study population
Table 1 summarizes, as mean and standard deviation, the characteristics of the study population overall and by TG strata. The sample population comprised 6,454 subjects who were mostly middle-aged (mean age, 41.5 years), the mean ratio of TG to VLDL-C was 5.23. The two TG strata were TG levels of less than 200 mg/dL and between 200 and 399 mg/dL. Age, body mass index, waist circumference, blood pressure, and fasting glucose were significantly higher in the higher TG group (200 to 399 mg/dL) than in the lower TG group (< 200 mg/dL). All variables except LDL-CF significantly differed between the TG groups. Intriguingly, the mean LDL-CD was significantly higher in subjects with TG levels of 200 to 399 mg/dL than in those with TG levels less than 200 mg/dL (120.11 mg/dL vs. 109.80 mg/dL, p < 0.001). However, the mean LDL-CF did not significantly differ between the TG groups. The difference between non-HDL-C and LDL-CF was greater than 50 in the subjects with TG levels of 200 to 399 mg/dL. The difference was less than 20 in the subjects with TG levels less than 200 mg/dL
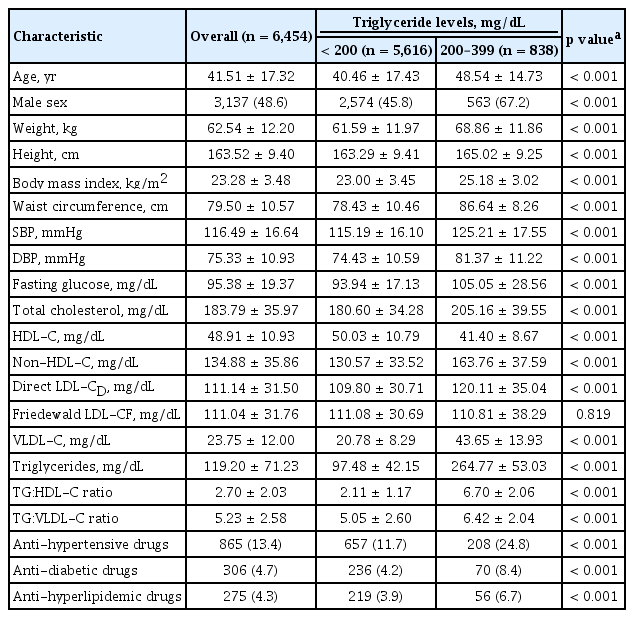
Characteristics of the subjects, overall and by triglyceride groups
Comparative analysis of directly measured and Friedewald-estimated LDL-C levels
Fig. 1 illustrates the TG strata- and HDL-C strata-dependent trend in the difference in LDL-CF and LDL-CD. A positive difference (+) (LDL-CF > LDL-CD) denotes an overestimation of LDL-CF, whereas a negative difference (−) (LDL-CF < LDL-CD) denotes an underestimation of LDL-CF. As TG levels increased, the Friedewald formula showed a tendency to underestimate LDL-C (Fig. 1A); conversely, as HDL-C levels increased, it showed a tendency to overestimate LDL-C (Fig. 1B).
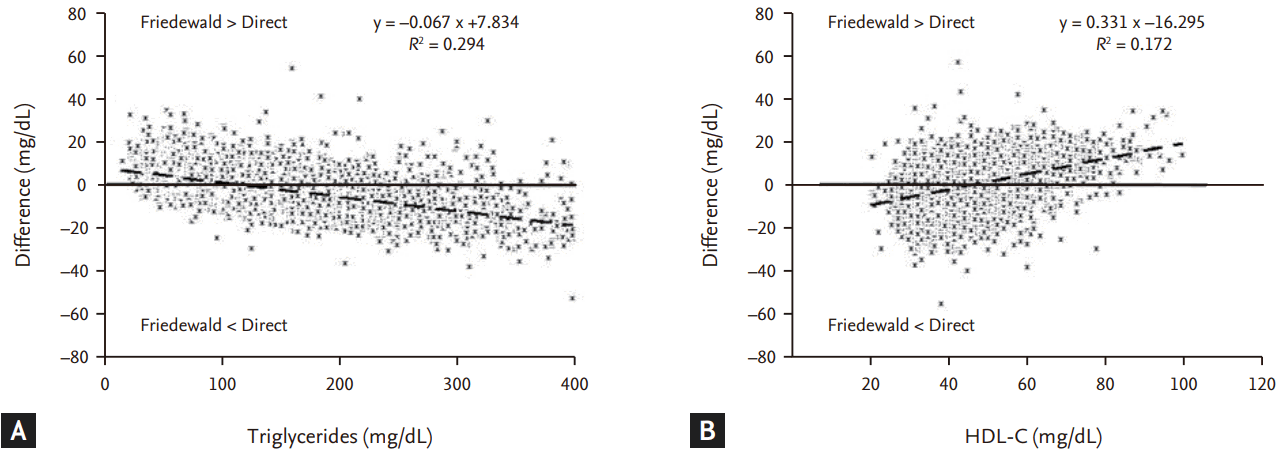
Difference in Friedewald-estimated and directly measured low density lipoprotein cholesterol when triglyceride levels are lower than 400 mg/dL. (A) Difference by triglycerides. (B) Difference by high density lipoprotein cholesterol (HDL-C).
The outcomes of the paired t test used to assess the statistical significance of the mean differences in LDL-CF and LDL-CD among the TG and HDL-C strata are shown in Table 2. When data were stratified by TG levels, we found that the mean difference in LDL-CF and LDL-CD was significantly greater than 0 among subjects with TG levels less than 100 mg/dL. Conversely, TG levels of 100 mg/dL and higher were associated with a mean difference in LDL-CF and LDL-CD that was significantly less than 0. Thus, the mean difference became more negative as TG levels increased. We also found that in individuals with low TG levels (< 100 mg/dL) the Friedewald formula tended to overestimate LDL-C, whereas in individuals with high TG levels (100 to 399 mg/dL) the Friedewald formula tended to underestimate LDL-C. When data were stratified by HDL-C levels, we found that the cutoff for overestimating and underestimating LDL-C was a HDL-C level of 50 mg/dL. HDL-C levels of less than 50 mg/dL were significantly associated with a mean difference in LDL-CF and LDL-CD that was less than 0, indicating an underestimated value of LDL-C. In contrast, the remaining HDL-C strata, with HDL-C levels of 50 mg/dL and higher, were significantly associated with a mean difference that was greater than 0, indicating an overestimated value of LDL-C.
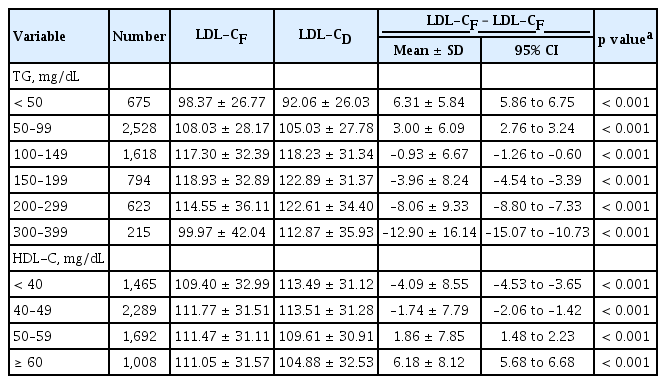
Mean comparison of Friedewald-estimated and directly measured LDL-C when triglyceride levels are lower than 400 mg/dL
Concordance in LDL-C risk classification
To assess the concordance in the risk classification by LDL-CF in relation to LDL-CD when TG levels are less than 400 mg/dL, we categorized LDL-C levels into six risk categories (< 70, 70 to 99, 100 to 129, 130 to 159, 160 to 189, and ≥ 190 mg/dL). Table 3 summarizes the outcomes of the chi-square test across the risk categories. The total number of concordances is indicated in bold. To the right of the bold numbers is the number of discordances in LDL-C risk classification resulting from an underestimated LDL-CF with respect to LDL-CD. For instance, among the 486 subjects with a LDL-CF level less than 70 mg/dL, concordance in the LDL-C risk classification was observed in 349 subjects who were correctly categorized into the LDL-C category of < 70 mg/dL. However, discordance in the risk classification was observed in the other 137 subjects, whose LDL-C levels should have been categorized into the 70 to 99 mg/dL category; thus, in these subjects the Friedewald formula led to an underestimated LDL risk. The values on the left side of the bold numbers denote the other misclassified group, corresponding to the number of discordances in LDL-C risk classification resulting from an overestimated LDL-CF with respect to LDL-CD. We found that LDL-C underestimation was more common when LDL-CF values were lower. In particular, among subjects with TG levels between 200 and 399 mg/dL, the proportion of subjects misclassified into a lower category was 55.4% (62 subjects) when the LDL-CF value was < 70 mg/dL and 41.8% (94 individuals) when the LDL-CF value was 70 to 99 mg/dL.

Concordance in guideline classification between Friedewald LDL-CF and direct LDL-CD values when triglyceride levels are lower than 400 mg/dL
Table 4 shows the overall concordance in LDL risk classification between LDL-CF and LDL-CD when TG levels are lower than 400 mg/dL, and the relative proportions of underestimated and overestimated values. The overall concordance in the study population (6,454 participants) was 79.1%, of whom 1,351 were misclassified. Of the subjects, 11.2% were misclassified into a lower risk category and 9.8% into a higher risk category in comparison to their respective LDL-CD categories. To evaluate the effect of TG levels on concordance, we stratified the data according to six TG groups (< 50, 50 to 99, 100 to 149, 150 to 199, 200 to 299, and 300 to 399 mg/dL). The analysis showed a low concordance in risk categorization in subjects with high TG levels. In subjects with TG levels of 200 to 299 mg/dL, the proportion of concordance was 65.3%, whereas in subjects with TG levels of 300 to 399 mg/dL, the proportion of concordance was 50.2%. Furthermore, subjects with higher TG levels were more likely to be misclassified into lower risk categories; for instance, compared to subjects with TG levels of 200 to 299 mg/dL, subjects with TG levels of 300 to 399 mg/dL showed a higher frequency of underestimation in their LDL-C categories (45.6% vs. 31.0%). To evaluate the effect of HDL-C levels on concordance in the LDL-C classification, we stratified data according to four HDL-C groups (< 40, 40 to 49, 50 to 59, and ≥ 60 mg/dL). Subjects with lower HDL-C levels showed higher proportions of underestimation in their LDL-C categories. In particular, the proportion of underestimation was highest (19.4%) in the group with HDL-C levels < 40 mg/dL. When the concordance in LDL-C risk classification was analyzed by gender, it was lower in males than in females (77.5% vs 80.6%). However, the trend for a low concordance and high underestimation in the risk categorization of subjects with higher TG levels or lower HDL-C levels was similar in both genders (data not shown).
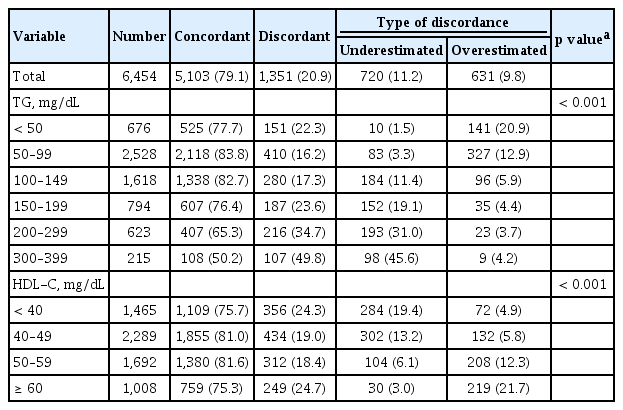
Concordance in guideline classification by Friedewald LDL-CF for strata of triglycerides and HDL-C among participants with TG levels < 400 mg/dL
DISCUSSION
We performed a comparative analysis between the Friedewald estimates and directly-measured LDL-C values in 6,454 subjects with TG levels lower than 400 mg/dL. Additionally, the concordance in the LDL-C risk classification between LDL-CF estimates and LDL-CD values was evaluated. We found that higher TG levels and lower HDL-C levels were each associated with a greater underestimation of LDL-C when the Friedewald formula was used. We also observed two groups of subjects who were more likely to be misclassified into lower LDL risk categories: (1) high-risk subjects with either high TG or low HDL-C and (2) subjects with a low Friedewald estimate and a high TG level.
Several studies have shown that even when TG levels are less than 400 mg/dL, higher TG levels increase the degree to which the Friedewald formula underestimates LDL-C [7,8,11,17,18]. In their study that measured LDL-C levels in 38,243 Korean subjects, Jun et al. [7] found that the Friedewald formula significantly underestimated LDL-C levels in individuals with high TG levels. Likewise, our findings show that the Friedewald formula underestimated LDL-C, particularly in subjects with higher TG levels, and overestimated LDL-C in subjects with lower TG levels (Table 2). Taking into account the underestimation and overestimation errors, Hwang et al. [17] suggested that the Friedewald formula could be used without introducing estimation errors in subjects with TG levels of 36 to 298 mg/dL. Since underestimating LDL-C risk may lead to false-negative diagnoses in subjects with undiagnosed conditions, it might cause serious consequences in terms of health outcomes.
The underestimation of the Friedewald formula was more pronounced in high-risk subjects, such as those with hypertriglyceridemia or hypo-HDL-cholesterolemia. We found that the proportion of LDL-C underestimation increased as TG levels in subjects increased. Compared with subjects with TG levels of 200 to 299 mg/dL, subjects with TG levels of 300 to 399 mg/dL had a greater proportion of underestimation (31% vs. 45.6%) (Table 4). Thus, among the 838 patients (623 + 215) with hypertriglyceridemia, 291 (193 + 98, 34.7%) with TG levels greater than 200 mg/dL had an underestimated LDL-C level. These findings support those of previous studies, such as the results reported by Hur et al. [18], who suggested that the cutoff for directly measuring LDL-C levels should be lowered to > 200 mg/dL from the current cutoff TG level of > 400 mg/dL. Of the total of 1,465 subjects with hypo-HDL-cholesterolemia, corresponding to a HDL-C level of less than 40 mg/dL, 284 subjects (19.4%) had an underestimated LDL-C value (Table 4). Although HDL-C levels have been shown to negatively correlate with TG levels [19], a low HDL-C level itself is also a risk factor for CVD.
A major revision in the 2015 Korean Guidelines for the Management of Dyslipidemia was the addition of a new risk category—very-high-risk subjects—including those with preexisting CVD. The guidelines go further to advise a LDL-C goal of less than 70 mg/dL in subjects categorized into this group [12]. In our study, 62 of 112 subjects (55.4%) with TG levels 200 to 399 mg/dL and a LDL-CF level lower than 70 mg/dL were misclassified into lower risk categories. This suggests that when LDL-C is measured using the Friedewald formula in very-high-risk subjects, such as those with hypertriglyceridemia, more than half will have an underestimated LDL-C risk.
Recently, the direct measurement of LDL-C has become widespread, but in large-scale health screenings, the Friedewald formula is still widely used worldwide. The KNHSP also conducts screenings using the Friedewald formula in individuals with TG levels less than 400 mg/dL. More than 98% of participants were examined using the Friedewald formula during the 2013 KNHSP, in which only 2% of participants had TG levels greater than 400 mg/dL. If we assume that an average of 70% of the total of 22,022,447 participants (20,815,338 for the general check-up and 1,207,109 for the transitional age check-up) of the 2016 KNHSP received a primary examination, and 98% of them had TG levels lower than 400 mg/dL, the total number of participants whose LDL-C would then be directly measured at the primary examination can be deduced to be 15,107,399 [4]. As the cost of directly measuring LDL-C is around 6,790 Korean won per person, this would lead to an additional net expense of around 100 billion won. Since the total budget of the 2014 KNHSP, which includes screenings for cancer, was 1 trillion won, it would be unrealistic for the LDL-C of all participants of the KNHSP to be measured directly.
Importantly, we found that in very-high-risk subjects in whom LDL-C should be accurately measured, the Friedewald formula often led to an underestimation of LDL-C. Either an alternative to the Friedewald formula adapted to the Korean population should be developed to produce better estimates of LDL-C levels in this subset of individuals, or LDL-C should be measured directly in high-risk groups. Recently, Martin et al. [20] developed a novel alternative method to improve the accuracy of LDL-C estimations. In their validation study of this method in Korean subjects, Lee et al. [21] reported that the Martin method was associated with a significantly higher concordance in LDL-C risk classification. Of note, subjects with TG levels of 200 to 399 mg/dL were found to exhibit significantly improved concordance in their risk categorization when the Martin method was used instead of the Friedewald formula (77.2% vs. 62.0%, p < 0.001). However, further studies investigating the accuracy of the Martin method in estimating LDL-C are needed using large-scale data, such as those from national databases. In general, the target for non-HDL-C can be calculated by adding 30 to the graded LDL-C treatment goals for each risk category. This comes from the assumption that the difference between non-HDL-C and LDL-CF is about 30. In this study, the difference between non-HDL-C and LDL-CF varied according to the TG levels of the subjects. The difference was greater than 30 for those with higher TG levels and less than 30 for those with lower TG levels.
One of the limitations of this study is that the risk factors for CVD were not analyzed in our sample population. Taking the LDL-C treatment goal by risk category into account, assessing LDL-C risk classification mismatches by category will help validate the Friedewald formula more stringently. Another limitation is that we included the subjects who took medications (statins, fenofibrate, omega-3 fatty acids, steroid, or others), that may potentially contribute to changes in lipid profile and discordances.
In addition to TG and HDL-C, studies have suggested that other lipid-related factors such as total cholesterol and non-HDL-C levels, comorbidities, age, and gender influence the discordance between Friedewald-estimated and directly measured values [7,21]. Finally, the long-term implications of underestimating or overestimating LDL-C using the Friedewald formula were not evaluated. A cost-benefit analysis investigating the cost incurred from directly measuring LDL-C and the societal cost or burden arising from erroneous Friedewald estimations and the relative benefits of direct measurements should be conducted.
CVD, such as myocardial infarction and stroke, are a major cause of death in Korea. In 2013, the leading cause of death was cancer (28.3%), followed by cerebrovascular disease (9.6%) and heart disease (9.5%) [22]. Since LDL-C is a major modifiable risk factor for CVD, it is vital for its levels to be accurately measured in clinical practice. Yet, in the KNHSP, the LDL-C levels of subjects with TG levels lower than 400 mg/dL are not directly measured, but are indirectly measured using the Friedewald formula. In this study, we found that subjects at high risk for CVD, in whom an accurate estimation of LDL-C is especially important, exhibited a high frequency of underestimated LDL-C risk. Around 34.7% of subjects with hypertriglyceridemia (TG levels above 200 mg/dL) had an underestimated LDL-C level; the proportion of subjects with an underestimated LDL-C level was as high as 55.4% when the Friedewald estimate was lower than 70 mg/dL. To summarize, we conclude that LDL-C should be directly measured in these high-risk subjects. Further studies are also required to develop a more accurate alternative to the Friedewald formula.
KEY MESSAGE
1. We f irstly investigated the degree of concordance in the low density lipoprotein cholesterol (LDL-C) risk classification using the 2015 Korean Guidelines for the Management of Dyslipidemia between the Friedewald estimates of LDL-C and directly measured LDL-C levels in the Korean population with triglyceride (TG) levels lower than 400 mg/dL.
2. We found that subjects at high risk for cardiovascular disease exhibited a high frequency of underestimated LDL-C risk. The 34.7% of subjects with hypertriglyceridemia (TG levels above 200 mg/dL) had an underestimated LDL-C level.
3. Either an alternative to the Friedewald formula adapted to the Korean population should be developed to produce better estimates of LDL-C levels or LDL-C should be measured directly in high-risk groups.
Notes
No potential conflict of interest relevant to this article was reported.
Acknowledgements
This research was supported by the 2016 Hallym Research Fund (HRF-201612-008).