Ten-year trends in antibiotic usage at a tertiary care hospital in Korea, 2004 to 2013
Article information
Abstract
Background/Aims
This study was performed to evaluate trends in antibiotic usage at a tertiary care hospital in Korea.
Methods
This study collated antibiotic prescription data and total patient days for inpatients at a tertiary care hospital in Korea between 2004 and 2013. The consumption of each class of antibiotic was converted to defined daily dose (DDD)/1,000 patient-days. We defined 3rd generation cephalosporins, 4th generation cephalosporins, β-lactam/β-lactamase inhibitors, and fluoroquinolones as broad-spectrum antibiotics; carbapenems, tigecycline, glycopeptides, oxazolidinone, and polymyxin were defined as antibiotics against multidrug-resistant (MDR) pathogens. Other antibiotic classes were defined as nonbroad-spectrum antibiotics.
Results
Mean antibiotic consumption was 920.69 DDD/1,000 patient-days. The proportions of broad-spectrum antibiotics, antibiotics against MDR pathogens, and nonbroad-spectrum antibiotics were 41.8% (384.48/920.69), 3.5% (32.24/920.69), and 54.7% (503.97/920.69), respectively. Consumption of broad-spectrum antibiotics (coefficient for time 0.141; p = 0.049) and antibiotics against MDR pathogens (coefficient for time 0.185; p < 0.001) showed a significant increasing trend over the study period. Nonbroad-spectrum antibiotic consumption showed a significant decreasing trend over the study period (coefficient for time –2.601; p < 0.001).
Conclusions
Over the 10-year period, a stepwise increase in the consumption of broad-spectrum antibiotics and antibiotics against MDR pathogens was observed at a tertiary care hospital in Korea. Conversely, during the same period, non-broad-spectrum antibiotic consumption showed a significant decreasing trend.
INTRODUCTION
Antimicrobial resistance is currently one of the greatest public health threats and an emerging crisis for humans [1]. Once a pathogen acquires resistance, it erodes the effectiveness of antibiotics, leading to increased mortality, length of hospital stay, and medical costs [2]. Unfortunately, the introduction of new licensed antibiotics has dwindled since the 1990s due to technical difficulties, regulatory hurdles, and the fact that antibiotics are less-lucrative than other pharmaceuticals [3].
The emergence of antimicrobial-resistant organisms is mainly caused by excessive and inappropriate antibiotic usage [4]. The proportion of inappropriate antibiotic prescription, which induces selective pressure, is approximately 20% to 50% worldwide [5]. Therefore, the importance of the antimicrobial stewardship programs (ASPs) has been emphasized [5]. Accordingly, the Korean Ministry of Health and Welfare established the Korean National Action Plan on Antimicrobial Resistance in 2016 [6].
The first step to implement proper antimicrobial stewardship policy is identifying the current situation. According to the ‘seven core elements’ of successful ASPs proposed by the Centers for Disease Control and Prevention, monitoring antibiotic use and resistance patterns is indispensable [7]. In Korea, available data on antibiotic consumption at hospital level are still limited.
This study was performed to evaluate the amount of antibiotic consumption and trends in antibiotic usage at hospital level in Korea. To this end, we obtained and analyzed antibiotic prescription data for inpatients at a tertiary care hospital between 2004 and 2013.
METHODS
Study design and setting
Hanyang University Seoul Hospital is a 758-bed, university-affiliated tertiary care hospital located in Seoul, South Korea. It has two intensive care units (ICUs), including a medical ICU (14 beds) and a surgical ICU (15 beds). Some changes in ASPs were observed in this hospital during the study period. In 2007, the Health Insurance Review & Assessment Service initiated an evaluation of surgical prophylactic antibiotics and implemented controls on prophylactic antibiotics used in surgery. Furthermore, the preauthorization-of-antibiotic-use program was newly implemented in 2008, applicable to the following antibiotics: carbapenems, glycopeptides, oxazolidinone, and polymyxin. Preauthorization for tigecycline was introduced in 2009. Other ASPs, including education for proper antibiotic use and feedback to the prescriber after drug use evaluation were largely unchanged during the study period although these practices were reinforced in 2008. The major events in infection control measures against multidrug-resistant (MDR) organisms during the study period were: (1) during 2011, the isolation ward was operated but closed in the following year; (2) the medical ICU participated in a multicenter study for MDR Acinetobacter baumannii control between 2011 and 2012 and, as part of this, active surveillance culture for MDR A. baumannii was performed and terminal environmental cleaning was reinforced; and (3) alcohol gel for hand hygiene was introduced at every patient’s bedside in 2010.
Data on total antibiotic prescriptions, patient-days, and antimicrobial sensitivity tests among inpatients between 2004 and 2012 from Hanyang University Seoul Hospital were collected for this study.
Definitions
Antibiotics
In this paper, we defined antibiotics as medication classified as class J01 according to the Anatomical Therapeutic Chemical (ATC) classification system, which does not include antifungal agents or anti-tuberculosis agents. Systemic agents used via oral or parenteral administration routes are included while topical agents are excluded. We converted each class antibiotics amount to defined daily dose (DDD) by using the ATC classification system by the World Health Organization [8], and then standardized for 1,000 patient-days.
We classified antibiotic agents into 19 classes: 1st generation cephalosporins (1st CEPs), 2nd generation cephalosporins (2nd CEPs), 3rd generation cephalosporins (3rd CEPs), 4th generation cephalosporins (4th CEPs), aminoglycosides (AGs), β-lactam/β-lactamase inhibitors (BL/BLIs), carbapenems, fluoroquinolones (FQs), glycopeptides, lincosamides, macrolides, metronidazole, monobactam, oxazolidinone, penicillins, polymyxin, tetracyclines, tigecycline, and trimethoprim/sulfamethoxazole (SXT). Other antibiotics, such as amphenicol, fosfomycin, and streptogramin were excluded because they are rarely used.
We defined 3rd CEPs, 4th CEPs, BL/BLIs, and FQs as broad-spectrum antibiotics. Carbapenems, tigecycline, glycopeptides, oxazolidinone, and polymyxin were defined as antibiotics against MDR pathogens. The remaining antibiotic classes were defined as nonbroad-spectrum antibiotics.
Bacterial pathogens and antimicrobial resistance
We analyzed antimicrobial sensitivity tests for bacterial pathogens isolated from blood. Escherichia coli, Klebsiella pneumoniae, and Staphylococcus aureus were selected for analysis because they are commonly associated with antimicrobial resistance and a relatively high isolation rate. The first isolate for each pathogen obtained from a single patient during a hospitalization period was included and duplicated isolates were excluded. All isolates were identified with MicroScan Walkaway (Beckman Coulter, Brea, CA, USA) and Vitek automated bacterial identification system 2 (bioMèrieux, Marcy-I’Etoile, France). The breakpoints of each compound were defined in reference to the Clinical and Laboratory Standards Institute (CLSI) [9], and R (resistance) or I (intermediate) were defined as resistance.
Statistical analysis
A linear regression model was used to assess the trend of antibiotic consumption and antimicrobial resistance rate over time. The coefficient for time and p value for the trend of antibiotic consumption were extracted using measures on a monthly basis while those for the trend of antimicrobial resistance rate were extracted using measures on a yearly basis because isolates were not sufficient for statistical power. Statistical significance was defined as p < 0.05. All analyses were performed using SPSS version 24.0 for Windows (IBM Co., Armonk, NY, USA).
Ethical statement
The study protocol was approved by the Institutional Review Boards of Eulji University Hospital (IRB number: 2017-06-021), and the requirement for written informed consent from patients was waived.
RESULTS
Ten-year trend of antibiotic consumption
Over the 10-year study period, the mean antibiotic consumption was 920.69 DDD/1,000 patient-days. The proportion of broad-spectrum antibiotics, antibiotics against MDR pathogens and nonbroad-spectrum antibiotics were 41.8% (384.48/920.69), 3.5% (32.24/920.69), and 54.7% (503.97/920.69), respectively. The most commonly prescribed antibiotic class was 3rd CEPs (18.8%, 173.26/920.69), followed by 1st CEPs (15.5%, 143.10/920.69), FQs (13.4%, 123.15/920.69), 2nd CEPs (12.7%, 116.94/920.69), AGs (9.8%, 90.57/920.69), and BL/BLIs (8.0%, 74.11/920.69) (Fig. 1).
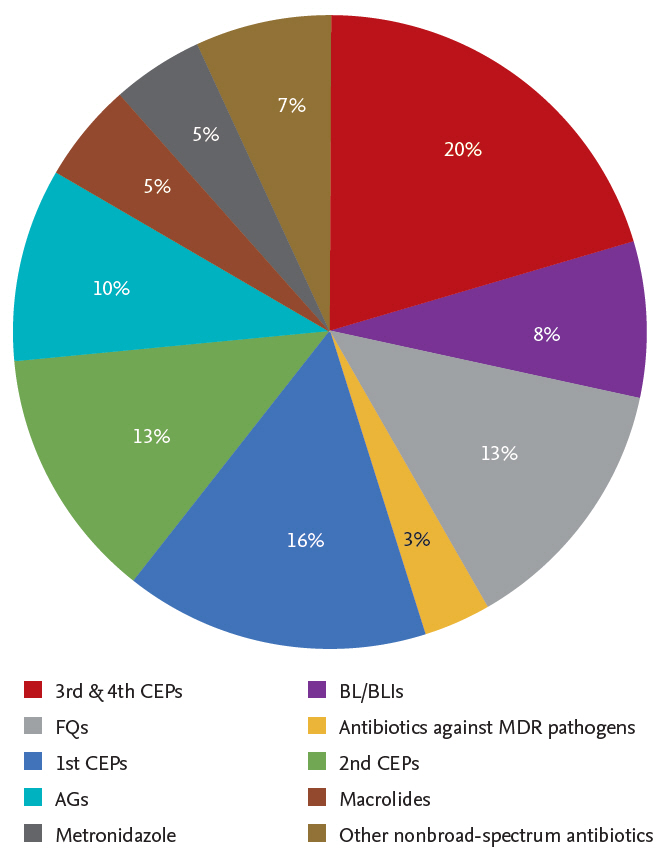
The proportion of consumption of antimicrobial agents for systemic use by class at a tertiary care hospital in Korea, 2004 to 2013. CEP, cephalosporin; BL, β-lactam; BLI, β-lactamase inhibitor; FQ, fluoroquinolone; MDR, multidrug-resistant; AG, aminoglycoside.
Table 1 shows the overall annual consumption of antimicrobial agents for systemic use. The overall annual antibiotic consumption ranged from 815.10 (in 2010) to 1,047.96 (in 2006) and showed a significant decreasing trend (coefficient for time –2.274; p < 0.001). A significant increasing trend in the use of broad-spectrum antibiotics (coefficient for time 0.141; p = 0.049) and antibiotics against MDR pathogens (coefficient for time 0.185; p < 0.001) was observed over the study period. Conversely, nonbroad-spectrum antibiotics showed a significant decreasing trend between 2004 and 2013 (coefficient for time –2.601; p < 0.001) (Fig. 2A).
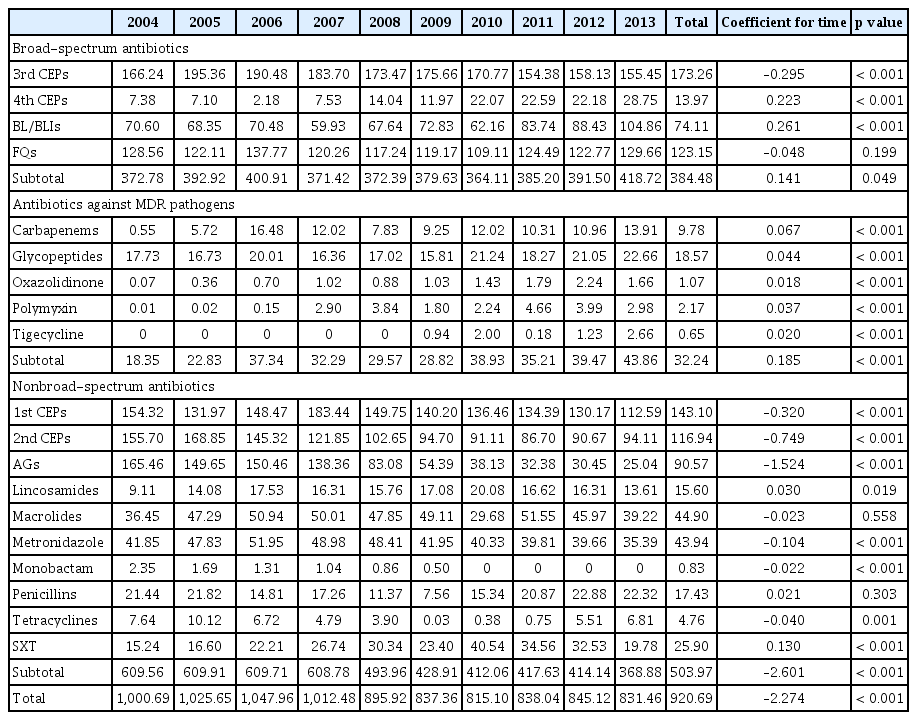
Annual consumption of antimicrobial agents for systemic use (unit: DDD/1,000 patient-days)

Ten-year trends of consumption of antimicrobial agents for systemic use at a tertiary care hospital in Korea, 2004 to 2013 (unit: defined daily dose [DDD]/1,000 patient-days). (A) Overall. (B) Broad-spectrum antibiotics. (C) Antibiotics against multidrug-resistant pathogens. (D) Nonbroad-spectrum antibiotics. MDR, multidrug-resistant; CEP, cephalosporin; BL, β-lactam; BLI, β-lactamase inhibitor; FQ, fluoroquinolone; AG, aminoglycoside.
Looking at the trends by classes, a significant increasing trend was observed for 4th CEPs (coefficient for time 0.223; p < 0.001) and BL/BLIs (coefficient for time 0.261; p < 0.001) while a significant decreasing trend was observed for 3rd CEPs (coefficient for time –0.295; p < 0.001). The consumption of FQs remained stable throughout the study period (coefficient for time –0.048; p = 0.199) (Fig. 2B).
Significant increasing trends were observed throughout the study period for consumption of all classes of antibiotics against MDR pathogens: carbapenems (coefficient for time 0.067; p < 0.001), glycopeptides (coefficient for time 0.044; p < 0.001), oxazolidinone (coefficient for time 0.018; p < 0.001), polymyxin (coefficient for time 0.037; p < 0.001), and tigecycline (coefficient for time 0.020; p < 0.001) (Fig. 2C).
For most of the nonbroad-spectrum antibiotics, consumption showed significant decreasing trends: 1st CEPs (coefficient for time –0.320; p < 0.001), 2nd CEPs (coefficient for time –0.749; p < 0.001), AGs (coefficient for time –1.524; p < 0.001), metronidazole (coefficient for time –0.104; p < 0.001), monobactam (coefficient for time –0.022; p < 0.001), and tetracycline (coefficient for time –0.040; p = 0.001). However, lincosamide (coefficient for time 0.030; p = 0.019) and SXT (coefficient for time 0.130; p < 0.001) consumption showed a significant increasing trend. The consumption of macrolides and penicillins remained stable throughout the study period (Fig. 2D).
Consumption of antibiotics stratified by ward and department
Table 2 shows consumption of antimicrobial agents for systemic use by ward and department. Mean antibiotic consumption was 1.7 times higher among patients in the ICUs than among patients in the general wards (GWs) (1,568.16 DDD vs. 897.39 DDD). Furthermore, in the ICUs, mean consumption of broad-spectrum antibiotics was 2.1 times higher (769.84 DDD vs. 370.61 DDD) and mean consumption of antibiotics against MDR pathogens was 9.2 times higher (231.00 DDD vs. 25.08 DDD) than in the GWs. The mean nonbroad-spectrum antibiotic consumption was comparable between patients in ICUs and GWs (567.32 DDD vs. 501.70 DDD). In the ICUs, a significant increasing trend (coefficient for time 0.655; p = 0.011) was found for consumption of antibiotics against MDR pathogens while nonbroad-spectrum antibiotics showed a significant decreasing trend (coefficient for time –2.629; p < 0.001) throughout the study period. The consumption of broad-spectrum antibiotics remained stable (coefficient for time –0.024; p = 0.941). Similarly, in the GWs, a significant increasing trend was observed for the consumption of antibiotics against MDR pathogens (coefficient for time 0.156; p < 0.001) while a significant decreasing trend was observed for nonbroad-spectrum antibiotics (coefficient for time –2.580; p < 0.001). The consumption of broad-spectrum antibiotics remained stable between 2004 and 2013 (coefficient for time 0.121; p = 0.087) (Supplementary Tables 1 and 2).
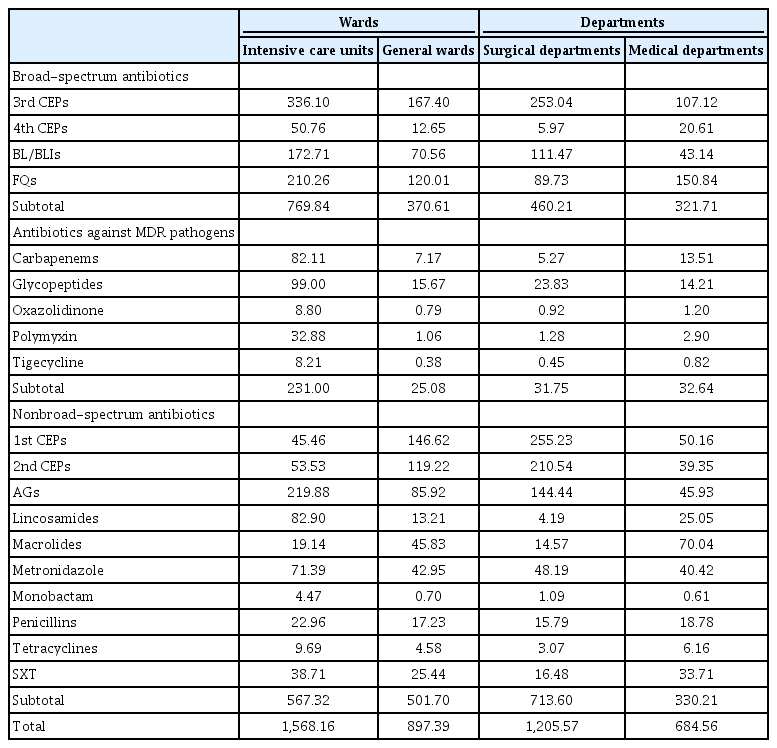
Consumption of antimicrobial agents for systemic use by wards and departments (unit: DDD/1,000 patient-days)
Mean antibiotic consumption among patients in surgical departments was 1.8 times higher than among patients in medical departments (1,205.57 DDD vs. 684.56 DDD). Compared to patients in medical departments, mean consumption of broad-spectrum antibiotics among patients in surgical departments was approximately 1.4 times higher (460.21 DDD vs. 321.71 DDD) and mean consumption of nonbroad-spectrum antibiotics (731.60 DDD vs. 330.21 DDD) was 2.2 times higher. There was a slightly higher consumption of antibiotics against MDR among patients in medical departments compared to patients in surgical departments (31.75 DDD vs. 32.64 DDD). In surgical departments, antibiotics against MDR pathogens had a significant increasing trend (coefficient for time 0.149; p < 0.001) while broad-spectrum antibiotics (coefficient for time –0.939; p < 0.001) and nonbroad-spectrum antibiotics (coefficient for time –4.163; p < 0.001) showed a significant decreasing trends over the study period. Consumption of broad-spectrum antibiotics (coefficient for time 1.096; p < 0.001) and antibiotics against MDR pathogens (coefficient for time 0.216; p < 0.001) showed a significant increasing trend while nonbroad-spectrum antibiotic consumption (coefficient for time –1.180; p < 0.001) showed a significant decreasing trend over the study period (Supplementary Tables 3 and 4).
Trends in antimicrobial resistance of bacterial pathogens
Table 3 shows the 10-year trend in antimicrobial resistance for E. coli, K. pneumoniae, and S. aureus. Looking at the gram-negative pathogens, the E. coli and K. pneumoniae resistance rates to ciprofloxacin were 31.8% and 37.5%, respectively, in 2013. The K. pneumoniae resistance rate to ciprofloxacin increased significantly over the study period (coefficient for time 3.693; p = 0.002). The E. coli and K. pneumoniae resistance rates to SXT were 34.1% and 29.2%, respectively, in 2013. The resistance rate of K. pneumoniae to SXT showed a significant increasing trend over the study period (coefficient for time 2.562; p = 0.022). The production rates of extended-spectrum β-lactamase (ESBL) in E. coli and K. pneumoniae were 22.7% and 33.3%, respectively, in 2013, and had significantly increased (coefficient for time 2.427, p = 0.005, E. coli; coefficient for time 3.727, p = 0.003, K. pneumoniae).
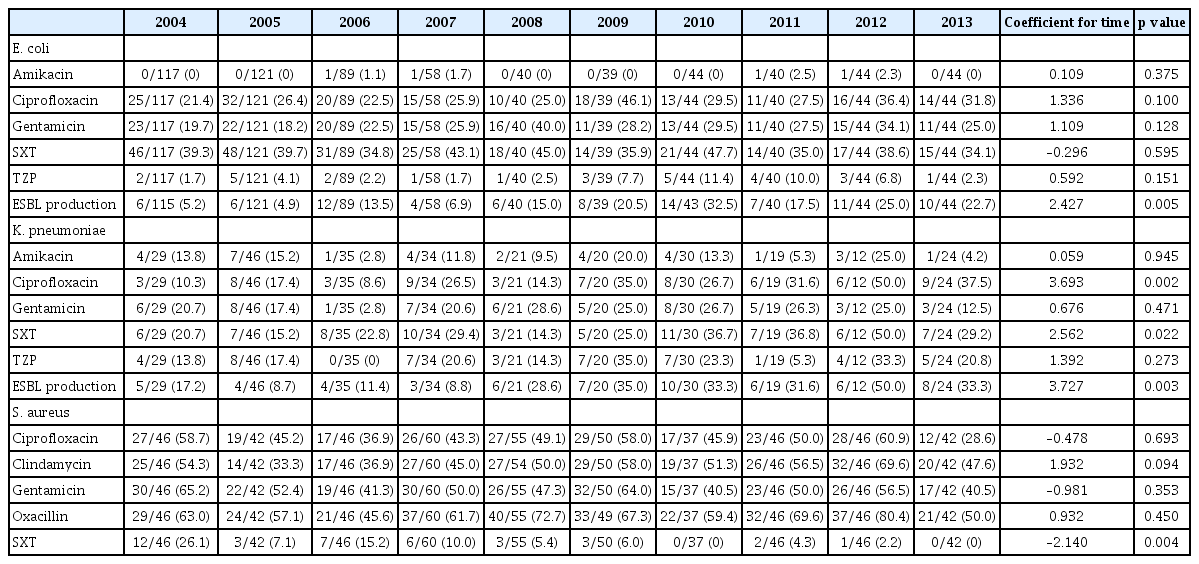
Antimicrobial resistance for Escherichia coli, Klebsiella pneumoniae, and Staphylococcus aureus
The resistance rate of S. aureus, the representative gram-positive pathogen, to clindamycin, oxacillin, and SXT was 47.6%, 50.0%, and 0%, respectively, in 2013. The resistance rate to SXT significantly decreased from 2004 to 2013 (coefficient for time –2.140; p = 0.004).
DISCUSSION
The results from the present study reflect the recent status of antibiotic usage at hospital level in Korea and can be used for implementation of antimicrobial stewardship policies. Few studies analyzing antibiotic usage trend at hospital level have been performed in Korea. Jun et al. [10] reported that average antibiotic consumption among patients at a tertiary care hospital over 18 years of age was 644.6 DDD/1,000 patient-days between 2001 and 2012. Song et al. [11] reported that annual antibiotic consumption among all patients ranged from approximately 750 to 850 DDD/1,000 patient-days at a tertiary hospital between 2000 and 2006.
There was a significant decreasing trend in consumption of nonbroad-spectrum antibiotic throughout the study period. Conversely, the consumption of broad-spectrum antibiotics and antibiotics against MDR pathogens increased. This trend was observed both at hospital-level [9,10] and national-level [12,13] analysis in Korea. A comparable trend of antibiotic usage has been observed in other countries. A study conducted in an Italian tertiary care hospital, with a comparable number of beds (840 beds), found significant increasing trends in consumption of BL/BLIs, carbapenems and vancomycin [14]. In acute care hospitals in the UK, use of carbapenems and piperacillin/tazobactam increased by 60.4% and 94.8%, respectively [15]. Similarly, data from European Surveillance of Antibiotic Consumption (ESAC) projects, which represents European countries, show that consumption of broad-spectrum penicillins, BL/BLI, carbapenems, and polymyxin usage increased significantly in 2013 compared with usage in 2009 [16].
We suggest that these trends reflect the current problem of increasing antimicrobial-resistant pathogens. While we did not analyze pathogens isolated from other sites, we identified a significant increase in the antimicrobial resistance rate to broad-spectrum antibiotics of bloodstream pathogens isolated at the study hospital. Consistent with our findings, the Korean Antimicrobial Resistance Monitoring System (KARMS), comprising a total of 35 secondary and tertiary care participating hospitals, reported that the antimicrobial resistance rate of E. coli and K. pneumoniae to broad-spectrum antibiotics has been increasing [17]. According to the KARMS, the E. coli and K. pneumoniae resistance rates to FQs were 30% in 2004, increasing to 42% and 34%, respectively, in 2013 [17]. Similarly, the E. coli and K. pneumoniae resistance rate to cefotaxime were 10% and 30%, respectively, in 2004, increasing to 29% and 40%, respectively, in 2013 [17]. The issue of increasing antimicrobial resistance of gram-negative Enterobacteriaceae is not limited to Korea. A multi-national study in Asian-Pacific countries found that the rate of community-acquired ESBL-producing E. coli and K. pneumonia increased from 6.3% and 9.4%, respectively, in 2002 to 14.6% and 26.2%, respectively, in 2013 [18]. This trend resulted in increasing consumption of antibiotics against MDR pathogens, including carbapenems. KARMS reported that the carbapenem susceptibility rates of E. coli and K. pneumoniae decreased from 100% and 99.3% in 2011 to 99% and 97% in 2015, respectively [17]. Considering that carbapenems are one of the most reliable last-resort treatment for gram-negative pathogens, this finding is troubling. The high prevalence of resistant gram-positive pathogen is also noticeable. In 2013, we found that half of S. aureus isolates from blood were methicillin-resistant S. aureus (MRSA). This finding was consistent with results of the KARMS study: the proportion of MRSA between 2013 and 2015 was 66% to 72% [17]. Regarding MRSA, the proportion of community-acquired isolates increased from 5.9% in 2005 to 13.3% in 2014 [19].
Guidelines for community-based infection may have affected the antibiotic prescription trends of the present study. The Infectious Disease Society of America and the American Thoracic Society introduced the concept of healthcare-associated pneumonia in 2005 and empirical coverage of MDR pathogens, such as MRSA and Pseudomonas aeruginosa, has been promoted since then [20]. Accordingly, the 2007 updated guidelines for community-acquired pneumonia recommended double anti-pseudomonal antibiotic coverage for cases in which Pseudomonas is a consideration; an example is piperacillin/tazobactam plus respiratory FQ combination therapy [21]. The Korean guidelines for community-acquired pneumonia treatment released in 2009 recommend that Pseudomonas infection should be suspected in patients with structural lung diseases such as bronchiectasis, exacerbation of recurrent chronic obstructive lung disease, systemic antibiotic use within the preceding 3 months, and alcoholism [22]. Consequently, there has been increased concern among physicians regarding MDR pathogens, driving excessive broad-spectrum antibiotic consumption [23].
We found that patients in ICUs consumed substantially more antibiotics, particularly antibiotics against MDR pathogens, compared with patients in GWs. For patients in ICUs, higher rates of MDR pathogens justify the use of regimens combining different broad-spectrum antibiotics, even when the presumed infection probability is low, because inappropriate empirical therapy may lead to poor prognosis [24]. Furthermore, there has been a significant increase in antimicrobial resistance for major pathogens isolated from ICUs in Korean hospitals [25]. However, study results indicate that 30% to 60% of antibiotics used in ICUs are inappropriate and therefore appropriate intervention measures are necessary to prevent further emergence of MDR pathogens, which are highly correlated with selective pressure [24].
ASPs are one of the most demanding strategies to reduce unnecessary and improper antibiotic usage [26]. In the current study, the antibiotic consumption trend may have been affected by ASPs as well. The preauthorization-of-antibiotic-use program was newly implemented in the study hospital in 2008, and other ASPs, such as education for proper antibiotic use and feedback to prescribers after drug use evaluation, were reinforced at the same time. As a result, overall antibiotic consumption began to decrease from this point. However, a rebound in the total antibiotic consumption occurred from 2011. The phenomenon can be explained by lack of manpower. At the beginning of 2011, one infectious diseases specialist resigned from the study hospital and ASPs were operated by one person. As indicated above, the most important requirements for appropriate operation of ASPs in Korea are reinforcement of manpower capable of performing ASPs.
There are potential limitations to the present study. First, the data of our study were derived from records at a tertiary care hospital and many of the patients potentially had underlying illnesses. Furthermore, we did not analyze outpatient data, which account for approximately 80.9% of total antibiotic consumption [13]. Therefore, the results of the present study may not be applicable to the general population. Secondly, antibiotic consumption was measured by DDD instead of days of therapy (DOT). According to a recent guideline for antibiotic stewardship programs, DOT is preferred to DDD as a measure of antibiotic consumption [27]. However, we could not use DOT because only the total amount of antibiotic consumption per patient was available. As one of the known shortcomings of DDD, antibiotic consumption may be underestimated among pediatric patients or patients with decreased renal function. Thirdly, analysis of the antimicrobial resistance rate was limited to three major pathogens isolated from blood. There are other pathogens that reflect the overall status of antimicrobial resistance in a hospital, such as P. aeruginosa, A. baumannii, and Enterococcus faecium. As there were insufficient isolates to analyze trends of antimicrobial resistance rate over time, we were only able to include E. coli, K. pneumoniae, and S. aureus.
Despite these limitations, the data derived from this study are likely to be a reasonable indicator of trends of systemic antibiotic usage at hospital-level. In conclusion, over the 10-year study period, a stepwise increase in the consumption of broad-spectrum antibiotics and antibiotics against MDR pathogens was observed at a tertiary care hospital in Korea. Conversely, over the same period, a significant decreasing trend in the consumption of nonbroad-spectrum antibiotics was observed.
KEY MESSAGE
1. The proportion of broad-spectrum antibiotics, antibiotics against multidrug-resistant pathogens, and nonbroad-spectrum antibiotics were 41.8%, 3.5%, and 54.7%, respectively.
2. Broad-spectrum antibiotics and antibiotics against multidrug-resistant pathogens showed an increasing trend while nonbroad-spectrum antibiotics showed a decreasing trend over the 10-year period.
3. Mean antibiotic consumption was 1.7 times higher among patients in the intensive care units than among patients in the general wards. Notably, patients in intensive care units consumed 9.2 times more antibiotics against multidrug-resistant pathogens compared with patients in general wards.
Notes
No potential conflict of interest relevant to this article was reported.
Acknowledgements
This research was supported by EMBRI Grants 2017 (2017EMBRIDJ0003) from the Eulji University.
Supplementary Materials
Annual consumption of antimicrobial agents for systemic use at intensive care units (unit: DDD/1,000 patient-days)
Annual consumption of antimicrobial agents for systemic use at general wards (unit: DDD/1,000 patient-days)