Correlation of the grade of hepatic steatosis between controlled attenuation parameter and ultrasound in patients with fatty liver: a multi-center retrospective cohort study
Article information
Abstract
Background/Aims
The controlled attenuation parameter (CAP), based on transient elastography, is widely used for noninvasive assessment of the degree of hepatic steatosis (HS). We investigated the correlation of the degree HS between CAP and ultrasound (US) in patients with HS.
Methods
In total, 986 patients with US-based HS who underwent transient elastography within 1 month were evaluated. The US-based grade of HS was categorized as mild (grade 1), moderate (grade 2), or severe (grade 3).
Results
The CAP was significantly correlated with the US-based grade of HS (r = 0.458, p < 0.001). The median CAP value of each US-based HS grade showed a positive correlation with grade (271.1, 303.7, and 326.7 dB/m for grades 1, 2, and 3). In a multivariate analysis, the US-based HS grade, body mass index, serum albumin, alanine aminotransferase, and total cholesterol, and liver stiffness were all significantly correlated with the CAP value (all p < 0.05). The areas under the receiver operating characteristic curves for grade 2 to 3 and grade 3 HS were 0.749 (95% confidence interval [CI], 0.714 to 0.784) and 0.738 (95% CI, 0.704 to 0.772). The optimal cut-off CAP values to maximize the sum of the sensitivity and specificity for grade 2 to 3 and grade 3 HS were 284.5 dB/m (sensitivity 78.6%, specificity 61.7%) and 298.5 dB/m (sensitivity 84.6%, specificity 55.6%).
Conclusions
The correlation of the degree of HS between CAP and US was significantly high in patients with HS, and the optimal cut-off CAP values for grade 2 to 3 and grade 3 HS were 284.5 and 298.5 dB/m.
INTRODUCTION
Hepatic steatosis (HS) is the accumulation of triglycerides in the cytoplasm of hepatocytes [1-3]. HS is a major lesion of nonalcoholic fatty liver disease (NAFLD), which is the most common cause of chronic liver disease in Western countries [4]. In the past, the prevalence of NAFLD in Eastern countries was low. Recently, however, the prevalence of NAFLD has increased significantly in these regions with minimal differences compared with Western countries [5]. Moreover, NAFLD is predicted to be the most frequent indication for liver transplantation by 2030 [6]. HS can progress to steatohepatitis, fibrosis, cirrhosis, and hepatocellular carcinoma [7-9]. Therefore, the diagnosis of HS is important for both treatment and prognosis of the disease.
To date, the gold standard for diagnosing and assessing the severity of HS has been liver biopsy. However, biopsy has several limitations, such as invasiveness, intra-observer and inter-observer variability, severe procedure-related complications, and sampling error [10,11]. Ultrasound (US) is the liver-imaging technique used most frequently to detect steatosis. Despite its many advantages, the use of US has several drawbacks [3,12]. In a previous study, US had an overall sensitivity to steatosis of 84.8% but showed poor predictive power in certain groups [13]. For example, in morbidly obese patients, the sensitivity and specificity of US were only 49% and 75%, and the prevalence of HS is underestimated in patients with less than 20% body fat [14,15]. Recently, the controlled attenuated parameter (CAP), a non-invasive quantitative method of measuring HS, has been developed to overcome these limitations [16,17]. It is easy to perform, does not require trained technicians as with US, and is less expensive compared with other tests. In addition, CAP is not affected by liver fibrosis or cirrhosis and is useful for quantifying and detecting HS in livers with greater than 10% fatty infiltration [18-21]. Compared with liver biopsy, the areas under receiver operating characteristic curves (AUROCs) for using the CAP to measure ≥ 5%, > 33%, and > 66% steatosis were 0.79, 0.76, and 0.70 [22].
Currently, most research has focused on comparing the relative performances of liver biopsy and CAP, while studies examining the correlation between US and CAP are relatively rare. In this study, we investigated the correlation of the degree of HS between CAP and US in patients with HS.
METHODS
Study population
From April 2013 to August 2016, 986 patients who were diagnosed with US-based HS and subsequently underwent transient elastography (TE) within 1 month in four Korean tertiary medical centers were enrolled. A total of 75 patients were excluded based on the following exclusion criteria: (1) presence of hepatic malignancy; (2) unreliable TE results or TE assessment failure; (3) insufficient clinical data; and (4) other chronic liver diseases including viral hepatitis. Ultimately, 911 patients were evaluated retrospectively.
This study was performed in accordance with the ethical guidelines of the Declaration of Helsinki. Informed consent was not obtained, because de-identified data were analyzed. This study was approved by the Institutional Review Board of each participating hospital (Soonchunhyang University Seoul Hospital, Number. 2016-08-033; Yonsei University Severance Hospital, Soonchunhyang University Bucheon Hospital, and Korea University Guro Hospital).
Ultrasound
Abdominal US were performed to assess HS, which was categorized as mild (grade 1), moderate (grade 2), or severe (grade 3) based on the following US features: (1) mild (grade 1), a slight increase in liver echogenicity; (2) moderate (grade 2), visualization of intrahepatic vessels, slightly impaired diaphragm, and increased liver echogenicity; and (3) severe (grade 3), a marked increase in hepatic echogenicity, poor penetration of the posterior segment of the right lobe of the liver, and poor or no visualization of the hepatic vessels and diaphragm [14,23].
Transient elastography
TE was performed by an experienced technician in each hospital. The evaluation was performed on the right lobe of the liver through the intercostal spaces on patients lying in the decubitus position with the right arm in abduction. The results are expressed as kilopascals (kPa) for liver stiffness (LS) and as dB/m for CAP. As an indicator of variability, the ratio of the interquartile range (IQR) of the LS to the median was calculated. Only cases with at least 10 valid acquisitions, a success rate of at least 60%, and an IQR-to-median value ratio < 0.3 were considered reliable and included in the statistical analysis. CAP was considered a valid value only when the LS for the same signal was reliable, using the same volume of liver parenchyma as in the LS.
Statistical analysis
Continuous variables are expressed as mean ± standard deviation or median (IQR), whereas categorical variables are expressed as numbers (%). Univariate linear regression analyses were performed to identify the factors influencing CAP (age, body mass index, LS, US-based HS grade, and levels of aspartate aminotransferase, alanine aminotransferase [ALT], gamma glutamyl transferase, serum albumin, total bilirubin, and total cholesterol), followed by multivariate analysis of the factors with a p < 0.2 by univariate linear regression analysis. Spearman’s correlation coefficient was used to investigate the correlation between CAP and US-based HS grade. The performance of CAP for detecting the US-based HS grade was assessed using the AUROC. We calculated the cut-off values using the Youden index and calculated the sensitivity, specificity, positive predictive value (PPV), and negative predictive value (NPV). A p < 0.05 was considered indicative of statistical significance. All analyses were performed using SPSS for Windows software version 21.0 (IBM Co., Armonk, NY, USA).
RESULTS
Baseline characteristics
The baseline characteristics of the 911 enrolled patients are shown in Table 1. The mean age of the patients was 49.8 ± 13.9 years, and 64.5% were male. The mean body mass index (BMI) was 27.1 ± 4.2 kg/m2, and the mean ALT level was slightly elevated to 56.5 ± 43.2 U/L. The median LS value was 5.7 kPa (IQR, 4.4 to 7.6), and the median CAP value was 305 dB/m (IQR, 268 to 334). Regarding the US-based HS grade, 303 (33.1%), 362 (40.9%), and 246 (26.9%) patients were grades 1, 2, and 3, respectively.
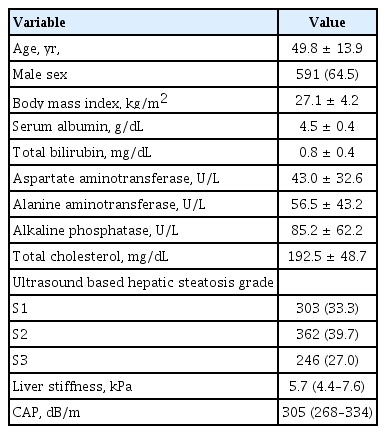
Baseline characteristics of the patients (n = 911)
Factors associated with CAP
Next, we performed a cross-sectional analysis to determine the baseline characteristics associated with the CAP score. In univariate linear regression analyses, the US-based HS grade (β = 23.4, p < 0.001), serum albumin level (β = 11.1, p = 0.010), BMI (β = 2.9, p < 0.001), LS (β = 0.8, p = 0.014), ALT level (β = 0.1, p = 0.019), and total cholesterol level (β = 0.1, p = 0.005) were associated with the CAP value (Table 2). In multivariate analysis, the USbase HS grade (β = 23.7, p < 0.001) was a significant independent factor associated with the CAP score, after adjusting for the serum albumin level (β = 12.0, p = 0.004), BMI (β = 3.1, p < 0.001), LS (β = 0.7, p = 0.022), ALT level (β = 0.1, p = 0.004), and total cholesterol level (β = 0.1, p = 0.004) (Table 2). CAP scores increased by 23.4 dB/m for each increase in the HS grade determined by US.

Correlation between controlled attenuation parameter values and other variables in univariate and multivariate linear regression analyses
Correlation between CAP and US-based HS grade
Next, we evaluated how well the CAP score was correlated with the US-based HS grade. As shown in Fig. 1, the CAP was significantly correlated with the US-based HS grade (ρ = 0.458, p < 0.001), and the median CAP value for each US-based HS grade showed a positive dose-response relationship. The median CAP values were 271.1, 303.7, and 326.7 dB/m, for HS grades 1, 2, and 3, respectively.

Distribution of the controlled attenuation parameter value according to ultrasound (US)-based hepatic steatosis grade. As the grade of steatosis increased, the controlled attenuation parameter (CAP) score increased significantly (p < 0.001).
Diagnostic performances of the CAP for fatty liver
Finally, we analyzed how well CAP values predict fatty liver. The AUROC values for the CAP and grade 2 to 3 and grade 3 HS are shown in Fig. 2. Table 3 shows the diagnostic performance of CAP for assessing HS. The AUROC values for grade 2 to 3 and grade 3 HS were 0.749 (95% confidence interval [CI], 0.714 to 0.784) and 0.738 (95% CI, 0.704 to 0.772), respectively. The optimal cut-off CAP values for grade 2 to 3 and grade 3 HS were 284.5 and 298.5 dB/m. The sensitivity, specificity, PPV, and NPV of CAP values of ≥ 284.5 and ≥ 298.5 dB/m for diagnosing grade 2 to 3 and grade 3 HS were 78.6%, 61.7%, 80.5%, and 59.0% and 84.6%, 55.6%, 41.4%, and 90.7%, respectively.

Receiver operating characteristic curves and areas under the receiver operating characteristic curves (AUROC) of the controlled attenuation parameter (CAP) value to detect grade 2 to 3 and grade 3 ultrasound-based hepatic steatosis grade. The AUROCs for grade 2 to 3 (A) and grade 3 (B) ultrasound-based hepatic steatosis were 0.749 (95% confidence interval, 0.714 to 0.784) and (B) 0.738 (95% confidence interval, 0.704 to 0.772), respectively.
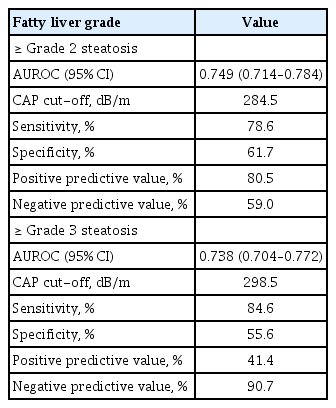
Diagnostic performance of the controlled attenuation parameter for detection of grade 2 to 3 and grade 3 hepatic steatosis determined by ultrasound
DISCUSSION
Among the many clinical tools available for diagnosing fatty liver, US is the most commonly used [24,25]. In real-world practice, the frequency of using US for diagnosis or monitoring of NAFLD is approximately 96% [10,11]. Previous studies have reported a correlation between liver biopsy and the CAP score, but liver biopsy is performed in less than 25% of NAFLD patients in clinical settings [10,11,24]. US is not only the most widely used clinical tool but also highly accurate in fatty liver grading. As such, we investigated the correlation between US-assessed HS and the CAP value in a relatively large number of patients from multiple academic centers [26]. Because US and the CAP score are increasingly being utilized as non-invasive methods, the results of our study can be applied directly to clinical practice.
We identified several factors associated with the CAP value. In a multivariate linear regression analysis, the US-based HS grade, serum albumin level, BMI, LS value, ALT level, and total cholesterol level were independently associated with the CAP score. Reported factors that are commonly associated with CAP scores include insulin resistance indicators, e.g., levels of fasting C-peptide, fasting insulin, fasting glucose, glycated hemoglobin, and homeostasis model assessment of insulin resistance [27,28]. Furthermore, BMI and the total cholesterol level, which were found to be related in our study, are considered metabolic components that have been associated with the CAP score in many previous studies [9,21,29,30]. Although the serum albumin level has not been reported previously in association with the CAP score, it can be interpreted as a reflection of nutritional parameters of the metabolic component. In fact, the serum albumin level was reported to be elevated in patients with NAFLD compared with normal populations [31].
In particular, the US-based HS grade was the most important parameter with a prominent β-coefficient. Ahn et al. [9] also reported that the correlation coefficient between US-assessed HS and the CAP value was ρ = 0.580 (p < 0.001), which was consistent with our finding (ρ = 0.458, p < 0.001). In our study, the median CAP value for each HS grade also showed a positive dose-response relationship (grades 1 to 3: 271.1, 303.7, and 326.7 dB/m, respectively). CAP has been used to detect the degree of US beam attenuation by intracellular fat vacuoles at the center frequency of the probe [17]. Considering the principles of CAP, there appears to be a high correlation between the HS grade and CAP score.
To date, two studies have been published on the association between the CAP and HS grade. With respect to the diagnostic accuracy of the CAP, Ahn et al. [9] reported AUROC values of 0.789 and 0.843 for grades 2 and 3 steatosis, respectively. Yen et al. [32] also reported AUROC values of 0.716 and 0.701 for moderate and severe steatosis, respectively, in NAFLD patients. Our study showed high accuracy for grade 2 to 3 (AUROC, 0.749) and grade 3 (AUROC, 0.738) steatosis. This supports other studies that showed a high accuracy of CAP in the evaluation of HS regardless of origin, including chronic viral hepatitis B and C, NAFLD, and alcoholic fatty liver disease [9,21].
In this study, the optimal cutoff values for grade 2 to 3 and grade 3 HS were 284.5 and 298.5 dB/m, respectively. Ferraioli et al. [33] reported that the mean CAP value for grade 2 was 265 dB/m. The optimal cut-off values for detection of grades 1, 2, and 3 HS were 238, 259, and 292 dB/m, respectively, according to Sasso et al. [17] and 215, 252, and 296 dB/m, respectively, according to de Ledinghen et al. [34] Previous studies reported a difference of approximately 30 dB/m between grades 2 and 3 steatosis. Our study showed a difference between cut-off values of only 14 dB/m. We believe this difference in cut-off values can be attributed to the different characteristics of our study group compared with those of other studies. In our study, only NAFLD patients were analyzed. Moreover, the proportion of grade 3 patients was 26.9%, which is relatively high compared with previous studies. The populations of previous studies that reported the association between US and CAP consisted of less than 20% grade 3 patients. Despite these differences in cut-off values, the sensitivities for grade 2 to 3 and grade 3 HS in our study were 78.6% and 84.6%, respectively. Therefore, more than 78% of patients with US-based moderate or severe HS were diagnosed using the CAP at these cut-off values. However, the specificity, PPV, and NPV of CAP values ≥ 284.5 and ≥ 298.5 dB/m in diagnosing grade 2 to 3 and grade 3 HS were not high.
Our study has several limitations. First, unlike previous studies, the steatosis grade was calculated based on US and the CAP score rather than the liver biopsy-based steatosis grade. As such, our accuracy may have been compromised given that we were not using the current gold standard. However, as mentioned earlier, the use of US and CAP scores in the diagnosis of NAFLD is expected to exceed liver biopsy in the future, so there is a greater potential for future clinical applications. Second, the limitations inherent to a cross-sectional design could not be avoided in this study, especially given the long-term prognosis of disease.
In conclusion, our data showed that the CAP is relatively well correlated with the degree of HS determined by US. The optimal cut-off CAP values for grade 2 to 3 and grade 3 HS were 284.5 dB/m and 298.5 dB/m, with sensitivities of 78.6% and 84.6%, respectively. We believe that the CAP is useful for the diagnosis and grading of fatty liver, and this parameter can expect wider use in clinical practice.
KEY MESSAGE
1. We investigated the correlation between ultrasound (US) and the controlled attenuation parameter (CAP), two of the most popular non-invasive tools for the diagnosis of fatty liver. Our results show that the US-based grade of hepatic steatosis was significantly correlated with the CAP score after adjusting for other clinical factors.
2. The areas under the receiver operating characteristic curves for grade 2 to 3 and grade 3 hepatic steatosis were 0.749 and 0.738, respectively. The optimal cut-off CAP value to maximize the sum of the sensitivity and specificity for grade 2 to 3 and grade 3 hepatic steatosis were 284.5 dB/m (sensitivity 78.6%, specificity 61.7%) and 298.5 dB/m (sensitivity 84.6%, specificity 55.6%), respectively.
Notes
No potential conflict of interest relevant to this article was reported.
Acknowledgements
This study was supported by the Soonchunhyang University Research Fund and by the Basic Science Research Program through the National Research Foundation of Korea funded by the Ministry of Science, ICT & Future Planning (2019R1A2C4070136). The funders had no role in the study design, data collection and analysis, decision to publish, or preparation of the manuscript.
We are grateful for the dedication of our collaborators and research coordinators.