Role of Mononuclear Cells of IgA Nephropathy on ICAM-1 Expression in Mesangial Cells
Article information
Abstract
Objectives
To investigate the possible role of mononuclear cells and their products in the pathogenesis of IgA nephropathy, in vitro expression of ICAM-1 on cultured mouse mesangial cell(MC) was examined after stimulation with mononuclear cell culture supernatant from patients with IgA nephropathy.
Methods
Peripheral blood mononuclear cells (PBMC) were isolated and cultured from 18 patients with primary IgA nephropathy, 8 normal controls and 5 patients with non-IgA nephropathy (FSGS 1, MGN 3, MPGN 1). ICAM-1 expression on cultured mouse MC by TNF-α, IL-1β and culture supernants of PBMC were analyzed using a cell ELISA method. The concentration of IL-1β and TNF-α in culture supernatants was measured by using a commercially available radioimmunoassay kit.
Results
Addition of human recombinant TNF-α induced an increased ICAM-1 expression in a dose-dependent manner. The expression of ICAM-1 was further increased after co-stimulation with TNF-α and IL-1β. Addition of PBMC culture supernatants into mouse MC induced significantly higher expression of ICAM-1 by supernatants from the patients with IgA nephropathy compared with that from normal controls.
The concentration of TNF-α and IL-1β in supernatants from the patients with IgA nephropathy was significantly higher than that from those with non-IgA nephropathy.
Conclusion
TNF-α and IL-1 released from mononuclear cells induced the up-regulation of ICAM-1 expression and this may be related to the immune pathogenesis of IgA nephropathy.
INTRODUCTION
Cell surface adhesion molecules, including intercellular adhesion molecule-1 (ICAM-1), are thought to be involved in the intercellular contacts that are essential for the development of immunologic responses1) and its expression is revealed to be enhanced by stimulation with some cytokines, such as IL-1, TNF-α, and IFN-γ2–5).
ICAM-1 and MHC class II molecules which may be induced on antigen presenting cells (APC), including mesangial cells (MC), by certain cytokines enables the MC to present antigen to T cells, and the interaction between MC and T helper cells may be increased by adhesion molecules such as ICAM-16–8). In IgA nephropathy, MC may be stimulated by cytokines to express ICAM-1 and the interaction between MC and T cell may develop the immunologic response. So it can be speculated that up-regulated expression of ICAM-1 on MC may be involved in the immunologic injury in IgA nephropathy.
We examined in vitro expression of ICAM-1 on cultured mouse MC after stimulation with mononuclear cell culture supernatant from patients with IgA nephropathy, using a cell ELISA method to investigate the possible role of mononuclear cells and their products in the pathogenesis of IgA nephropathy.
MATERIALS AND METHODS
Materials
Peripheral blood mononuclear cells (PBMC) were isolated and cultured from 18 patients with primary IgA nephropathy, 8 normal controls and 5 patients with non-IgA nephropathy (FSGS 1, MGN 3, MPGN 1). The diagnosis of IgA nephropathy was based on the presence of predominant mesangial immunofluorescent IgA deposits and mesangial and paramesangial electron-dense deposits in renal biopsy specimens. Patients with the clinical and laboratory evidence of hepatic disease, systemic lupus erythematosus, Henoch-Schoenlein nephritis and other systemic diseases were excluded. No patient had infection nor was on corticosteroid or immunosuppressive treatment within at least 1 month of entry into the study. Medical doctors and nurses, matched for age and sex with the patients with IgA nephropathy, were selected as normal controls.
Preparation of PBMC culture supernatant
Mononuclear cells were isolated by Ficoll-Hypaque density gradient method from heparinized venous blood. The cell suspension recovered at the interface was resuspended in RPMI 1640 at a concentration of 5×10⁶ cells/ml. The cells were stimulated with phytohemagglutinin (PHA) (10μg/ml) and concanavalin A(Con-A) (10μg/ml). The PBMC were cultured at 37°C in 5% CO2 for 24 h. At the end of incubation, the supernatant was harvested and stored at −70°C until tested.
Preparation of mesangial cell culture
Kidneys from 5 normal ICR mice were removed. The cortex was minced Into small pieces and passed through a series of steel sieves. The glomeruli collected through the 75μm sieve were rinsed with HBSS and were digested with 1ml type IV collagenase (GIBCO, Grand Island, N.Y., USA) at 37°C for 30 min with shaking. After centrifugation, the pellet was suspended in DMEM and plated into a tissue culture flask containing DMEM supplemented with 20% fetal calf serum, 100U/ml penicillin, 100μg/ml streptomycin, 10μg/ml insulin and L-glutamine. After three or four passages, no endothelial or epithelial cells were seen and the cultures consisted exclusively of mesangial cells. The MC were characterized by using phase contrast microscopy and the cells had prominent intracellular myosin fibrils and were negative with antibodies (Becton Dickinson, Mountain View, Calif., USA) to common leukocyte antigen and factor VIII by immunofluorescent staining9). The cells were capable of growth in D-valine-substituted medium and were not sensitive to puromycin.
Expression of ICAM-1 on cultured mouse mesangial cells
ICAM-I expression by cultured mouse MC was analyzed using a cell ELISA.
MC (5×10⁴) were seeded into 96 well flat-bottom microtiter plates (Costar, Cambridge, Mass., USA) in 200μℓ of DMEM culture medium and cultured to reach confluency for 48h. When MC were confluent, 100μℓ of culture medium was removed from each well and 100μℓ of the following additives were then added to each well to yield a final volume of 200μℓ/well. Human recombinant TNF-α and IL-1β (R & D system, Minneapolis, Minn., USA) were used at the concentration of 1, 10, 100 pg/ml and 1, 10, 100, 500 ng/ml, respectively, and the combination of the same concentration of TNF-α and IL-1β. PBMC culture supernatants from the patients with IgA nephropathy, non-lgA nephropathy, and normal controls were also added to other wells. The cultures were incubated for 24h at 37°C in 5% CO2-air. The cell monolayers were washed twice with DMEM and then fixed with 1% paraformaldehyde for 15 min at room temperature. After washing the fixed monolayer with DMEM 3 times, unbound sites were blocked with 2% solution BSA diluted in DMEM and incubated at 37°C for 1h in 5% CO2. After the blocking solution was removed, a 100μℓ of a 1/200 dilution of the rat mAb to mouse ICAM-1 (Serotec, Kidlington, Oxford, UK) was added to each well and the plates were incubated at 37°C for 1h. After the culture wells were washed three times with DMEM, 100μℓ of a 1/200 dilution of the developing antibody (goat anti-rat IgG, phosphatase labeled; Gibco, Grand Island, NY, USA) in 1% BSA-DMEM was added. The plates were then incubated for 1h at 37°C in 5% CO2. The enzyme conjugate was removed and the culture cells were washed 4 times with DMEM. Then 100μℓ of p-nitrophenyl phosphate substrate were added to each well and the plate was incubated at 37°C in 5% CO2. Appropriate controls were included in each assay. These include medium only, or medium + primary antibody + developing antibody + substrate. The plates were read on a Behring ELISA Processor II (405 nM) (Behring, Germany) usually at 30-min intervals from 30 to 180 min or until maximum (OD) readings were obtained. The data are reported as the mean±SEM OD units from triplicate, wells at one time point on the linear portion of the development (time) curve.
Cytokine assay
The concentration of IL-1β and TNF-α were measured by using a commercially available radioimmunoassay kit (Amersham, Bucks., UK).
Statistical analysis
The results are expressed as mean±SEM. A one-way analysis of variance (ANOVA), with adjustment of P values for multiple comparisons, was performed to compare overall mean levels between groups. If the ANOVA indicated a significant trend among groups, student’s t-test and regression analysis were used to test for differences between two groups. A p-value < 0.05 is interpreted to be significant.
RESULTS
Response of ICAM-1 expression on cultured mouse MC in response to recombinant human TNF-α and IL-1β.
The control culture of mouse MC in pure medium demonstrated a weak staining (OD405: 0.2897±0.00430), which was not changed after the addition of mouse ICAM-1 mAb, developing antibody and p-nitrophenyl-phosphate substrate.
Addition of human recombinant TNF-α induced an increased ICAM-1 expression. It was apparent at the concentration of 1 pg/ml (0.2957±0.0070) and reached a plateau at 100 ng/ml (0.9640±0.0193). Dose response curves for TNF-α showed that ICAM-1 expression is dose-dependent between 1 pg and 100 ng/ml (Fig. 1). Induction of the ICAM-1 expression after stimulation with IL-1β was also dose-dependent and was apparent at the concentration of 1 pg/ml (0.3017±0.0113) and it reached a plateau at 1 ng/ml (0.7153±0.0520) (Fig. 2).
Dose-response of ICAM-1 expression on mouse mesangial cells in response to recombinant human TNF-α assayed in a cell ELISA

Dose-response of ICAM-1 expression on mouse mesangial cells in response to recombinant human IL-β assayed in a cell ELISA
The expression of ICAM-1 was further increased after co-stimulation with TNF-α and IL-1β and it became more evident when the dosage of TNF-α and IL-1β was increased from 100 pg/ml to 500 ng/ml (Table 1). There was no change of ICAM-1 expression after the addition of human recombinant IFN-γ to TNF-α and IL-β (data not shown).
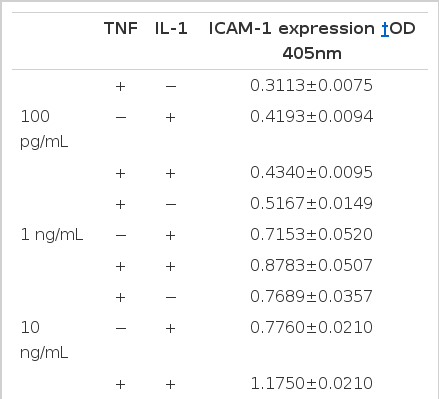
Effects of Human TNF-α and IL-1β on ICAM-1 Expression in mouse Mesangial cells
ICAM-I expression on mouse MC by PBMC culture supernatants and the concentration of TNF-α and IL-β in supernatants.
Addition of PBMC culture supernatants into mouse MC induced significantly higher expression of ICAM-1 by supernatants from the patients with IgA nephropathy compared with that from normal controls (0.4117±0.0202 vs 0.3094±0.0113, P<0.005) (Table 2, Fig. 3). ICAM-1 expression induced by supernatant from IgA nephropathy was higher than that from non-IgA nephropathy (0.3502±0.0249), which was, however, not statistically (P<0.1) significant (Table 2, Fig. 3).

ICAM-1 Expression on mouse Mesangial cells by PBMC culture Supernatant and Concentration of TNF-α and IL-1β in Supernatant

ICAM-1 expression on mouse mesangial cells by PBMC culture supernatant
* P<0.005 vs Media and Normal controls
The concentration of TNF-α and IL-1β in the PBMC culture supernatants, measured to explain the difference of ICAM-1 expression among the patient groups, was as follows, The concentration of TNF-α in supernatants from the patient with IgA nephropathy (271.5±43.0 pg/100μℓ) was significantly higher than that from those with non-IgA nephropathy (128.6±17.3 pg/100μℓ, P<0.05) and normal controls (96.4 ±13.9 pg/100μℓ, P<0.005) (Table 2, Fig. 4), and that of IL-1β in supernatant from the patients with IgA nephropathy (536±128 pg/100μℓ) was also significantly higher than that from those with non-IgA nephropathy (51.5+18.5 pg/100μℓ, P<0.005) and normal controls (43.7±6.6 pg/100μℓ, P<0.005) (Table 2, Fig. 5).
The ICAM-1 expression induced by PBMC culture supernatant from the patients with IgA nephropathy was significantly correlated with the concentration of TNF-α and IL-1β in the supernatants (Table 3).
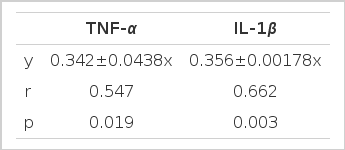
Correlation between the Cytokine Concentrations and the ICAM-1 Expression in IgA Nephropathy
DISCUSSION
IgA nephropathy is known to be the immune mediated nephritis10). The main histologic feature of IgA nephropathy is the MC proliferation which may be stimulated by cytokines and growth factors derived from intrinsic glomerular cells and/or infiltrating inflammatory cells, principally the monocytes11,12) Besides stimulating MC proliferation, the cytokines, such as TNF-α, IL-1, and IFN-γ, are known to up-regulate the expression of ICAM-1 in most cells2,4) and to induce the MHC class II molecules on APC13, 14). ICAM-1/LFA-1 interaction is known to play a major role in a variety of inflammatory and immune mediated diseases, including allograft rejection and autoimmune disorders, such as systemic lupus erythematosus and multiple sclerosis5,7,15). However, only a few studies on the role of the ICAM-1 in IgA nephropathy exist.
In IgA nephropathy, MC that function as APC may be stimulated by cytokines to express adhesion molecule such as ICAM-1 and to induce MHC class II molecules6). The interaction between MC and T helper cells may develop the immunologic response7).
Our results on the expression of ICAM-1 on mouse mesangial cells stimulated by human recombinant TNF-α, IL-1β and PBMC culture supernatant are in accordance with other studies2–4). In brief, ICAM-1 expression is dose-dependently up-regulated in MC by TNF-α and IL-1β, suggesting that these cytokines may induce ICAM-1 in these cells in vitro, and the effect of PBMC culture supernatant on the up-regulation of ICAM-1 expression may be caused by these cytokines.
Recently, it was suggested that MC, expressing both ICAM-1 and MHC class II following cytokine stimulation, function as immune accessory cells8). Up-regulated expression of ICAM-1 on MC may promote adhesion of LFA-1 positive immune cells13, 14) and subsequent immune processes may injure the glomerular cells, including mesangial cells.
Our results that ICAM-1 expression on MC is up- regulated by PBMC supernatant from patients with IgA nephropathy give support to the hypothesis that ICAM-I up-regulation may be important in the development of immune reaction in IgA nephropathy. If this hypothesis is correct, the next problem that should be solved is what the main factor causing the difference in the degree of up-regulation of ICAM-I expression on MC between the patients with IgA nephropathy and normal controls is. The main factor may be either MC hyper-responsiveness to cytokines in expressing ICAM-1 or the increased amount of the cytokines production that stimulates the ICAM-I expression. The results of this study show that mononuclear cells from the patients with IgA nephropathy produce more TNF-α and IL-1β compared with normal controls, and the concentration of these cytokines show good correlation with the ICAM-1 expression on MC. Although we cannot rule out the possibility that MC’s inherent hyperactivity to cytokines may contribute to the ICAM-1 up-regulation, the intrinsic property of mononuclear cells to produce more IL-1 and TNF-α is suggested as one of the main factors causing the up-regulated ICAM-1 expression on MC in IgA nephropathy.
When the recombinant human TNF-α and IL-1β and the human PBMC are used as the source of cytokines IL-1β to induce the ICAM-1 expression on mouse MC, amino acid sequence homology and species cross-reactivity between human and murine cytokines should be considered16, 17). For TNF-α, inferred amino acid sequences from human and murine cDNA clones indicate that 79% of the amino acids are conserved between the two species and there are species cross-reactivity between human and mouse. For IL-Iα, amino acid sequence homology is 62% and human IL-Iβ is also effective in mouse systems. However, murine IFN-γ exhibit only a 40% homology with the human form, and this low degree of homology is believed to contribute to the apparent lack of species cross-reactivity. In this study, we can confirm the species cross-reactivity between human and mouse in the aspects of recombinant TNF-α, IL-1β, and PBMC culture supernatant on the ICAM-1 expression. We cannot assess the role of IFN-γ on the up-regulation of ICAM-1 in IgA nephropathy because of the species difference. As expected, human recombinant IFN-γ added at the dosage of 1–500 U to mouse mesangial cells does not show any effects on ICAM-1 expression (data not shown).
In conclusion, TNF-α and IL-I released from mononuclear cells induced the up-regulation of ICAM-1 expression, and this may be related to the immune pathogenesis of IgA nephropathy.