Serum IgE Levels in Korean Patients with Human Immunodeficiency Virus Infection
Article information
Abstract
Background
Human immunodeficiency virus (HIV) infection results in a selective CD4+ T cell depletion and an impairment of T cell regulation. Despite the immune depletion, the progression of HIV infection is accompanied by the stimulation of antibody synthesis. Thus, the prevalence and amplitude of the increase of total serum IgE level and the relationship between the IgE levels and the degree of immunodeficiency were evaluated in patients with HIV infection.
Method
Twenty-six Korean adults infected with HIV, in different stages, were evaluated for serum IgE level and CD4+ T cell count. Serum IgG, IgM and IgA levels were also determined. All subjects enrolled in this study denied an individual and familial history of atopic diseases. The possibility of parasitic infestation was also excluded by history and stool examination.
Results
The mean serum IgE level was 473.5 IU/L with a standard deviation of 671.4 IU/L (range: 15.9–2000 IU/L) and increased serum IgE levels (>200 IU/L) were found in 38.5% of the study population. The mean serum IgG, IgA and IgM levels were 1,939.5±588.6 mg/dL (normal: 751–1,560 mg/dL), 388.9±216.7 mg/dL (normal: 82–453 mg/dL) and 153.6±75.3 mg/dL (normal: 46–304 mg/dL), respectively. The CD4+ T cell count was inversely correlated to the serum IgE level (r=−0.429, p<0.05), but not to the other isotypes of immunoglobulin.
Conclusion
Serum IgE levels are increased in adults with HIV infection and could be useful as a marker of disease progression. Further study is needed to elucidate the causes and clinical significance of these findings.
INTRODUCTION
Human immunodeficiency virus (HIV) infection is associated with a selective depletion of CD4+ T cells and an impairment of T cell regulation1). Despite immune depletion, the progression of HIV infection is accompanied by the stimulation of antibody synthesis. Early on increased levels of immunoglobulin G (IgG), immunoglobulin A (IgA), and immunoglobulin M (IgM) in patients with the acquired immunodeficiency syndrome (AIDS) have been reported2, 3). Lane et al4) demonstrated marked abnormalities of B cell activation, including an inability to develop a proliferative response to the pure B cell Staphylococcus aureus Cowen strain and an increase in the number of B cells spontaneously secreting immunoglobulin.
A high incidence of clinical manifestations suggestive of IgE-mediated allergic disease occurs in individuals infected with HIV1, 5). Sinusitis, skin eruptions consistent with atopic dermatitis, drug hypersensitivity and wheezing suggestive of asthma have been described in patients with AIDS5). Elevated serum IgE levels, a hallmark of atopic disorders, have been observed in adults and children with HIV infection6). The immune dysregulation associated with HIV infection seems to be involved in these manifestations. Our understanding of the molecular mechanism of IgE production has improved by virtue of the recent development of molecular biology and genetic technology. After mature B cells are stimulated by antigens, some activated B cells undergo heavy chain class (isotype) switching and begin to express Ig heavy chain classes other than μ and δ, such as α, γ or ɛ7). Heavy chain class switching is not a random process but is regulated by helper T cells and their secreted cytokines, among which interleukin-4 (IL-4) is an essential signal for switching to IgE7).
Early findings of T cell proliferation and an interleukin-2 (IL-2) decrease with increased B cell activity suggested a switch from a TH1 to a TH2 cytokine profile in HIV infection8–10). However, Maggie et al11) did not find a bias toward the TH2-like cytokine pattern in T cell clones from HIV-1 infected individuals during the progression to AIDS. Instead, they demonstrated a preferential depletion of CD4+ TH2 cells in the advanced phases of HIV-1 infection and a preferential replication of HIV-1 in TH2 rather than TH1 clones11). Thus, it would be interesting to evaluate the capacity of IgE production and its relation to the immune status in HIV infection.
This study aimed to evaluate (1) the prevalence and amplitude of the increase of total serum IgE level and (2) the relationship between the IgE levels and the degree of immunodeficiency assessed primarily by CD4+ cell counts in a group of HIV infected patients in Korea.
SUBJECTS AND METHODS
1. Study population and study design (Table 1)
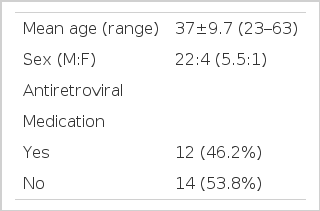
General characteristics of the study population
The study group consisted of twenty-six Korean adults, in various stages of HIV infection, who visited Kyungpook University Hospital from June, 1999 to July, 2001. All patients were HIV seropositive as confirmed by ELISA and Western blot. This study was conducted in a cross-sectional manner. Each subject was evaluated for whole blood cell count, CD4+ T cell count, HIV RNA level and serum IgG, IgM, IgA and IgE levels.
Among the 26 patients included, 22 patients (84.6%) were male. The mean age was 37 years, ranging from 23 to 63 years old. According to HIV transmission categories, 7 (26.9%) were homosexuals, 1 (3.8%) bisexual, 14 (53.8%) heterosexuals with multiple sex partners, 1 (3.8%) blood-transfusion recipient, 1 (3.8%) intravenous drug user, 1 (3.8%) intravenous drug user with multiple heterosexual sex partners and 1 (3.8%) patient had no known risk factor for HIV infection. The patients were classified clinically and immunologically according to the 1993 revised Centers for Disease Control (CDC) classification12). Twelve (46.2%) of the 26 patients were undergoing treatment with more than one of the following three antiretroviral agents, zidovudine, lamivudine and indinavir at the time of evaluation.
To avoid the possible increase of IgE concentrations secondary to allergic activation, patients were questioned for an individual or family history of atopic diseases, such as atopic dermatitis, allergic rhinitis or asthma. They were also questioned for a history of parasitic infestations and were screened by stool examination. All included were negative for atopic diseases or parasitic infestations by these criteria. Allergic skin tests were performed on some patients who agreed.
2. T-lymphocyte and CD4+ cell count enumeration
Whole blood cell counts were evaluated with an automated hematology analyzer (Advia 120, Bayer, Leverkusen, Germany). T cell subpopulations (CD4+ cell count) were determined by flow cytometry (FACS calibur, Becton Dickinson Immunocytometry Systems, San Jose, California, U.S.A.).
Absolute lymphocyte counts and eosinophil counts were derived from leukocyte differential counts and used to calculate the numbers of each lymphocyte and eosinophil population. An eosinophil count of less than 7% of the leukocyte differential count was considered normal.
3. Immunoglobulin assay
Serum IgE concentrations were determined by immunocapture (Pharmacia AutoCAP System IgE EIA, Pharmacia, Uppsala, Sweden). The reference for normal IgE values in our laboratory has been established as below 200 IU/L.
Serum IgG, IgA and IgM levels were determined by rate nephelometry (Image Immunochemistry System, Beckman Array System, Fullerton, California, U.S.A.). The normal ranges were 751–1,560 mg/dL for IgG, 82–453 mg/dL for IgA and 46–304 mg/dL for IgM.
4. Skin test
A skin prick test was performed with 30 types of inhalant allergens from the Bencard Company (Ontario, Canada). The allergens included Dermatophagoides species, Aspergillus species, dog and cat fur and a variety of tree, grass and weed pollens. Normal saline was used for a negative control and histamine solution (1 mg/mL) was used for a positive control. Results were interpreted in 20 minutes and graded according to the ratio of the size of the wheal induced by the allergen to the size of that caused by histamine (allergen/histamine ratio=A/H ratio). An A/H ratio ≥1 with an erythema size ≥21 mm was graded as a positive reaction.
5. HIV RNA assay
HIV RNA was measured by RT-PCR (reverse transcription polymerase chain reaction) assay (HIV-1 version 2.0, Roche Molecular Systems, Branchburg, New Jersey, U.S.A.) according to the manufacturer’s instructions.
6. Statistical analysis
Comparisons of IgG, IgA, IgM, IgE and CD4+ T cell counts were made after conversion into their logarithmic values, since they were not normally distributed. All data were analyzed by bivariate analysis on the SPSS software package, version 10.0 (SPSS Inc., IL, U.S.A.). A two-tailed p value of <0.05 was regarded as statistically significant. Pearson correlation coefficients are represented as r in the text.
RESULTS
1. CDC classification of the study population (Table 2)
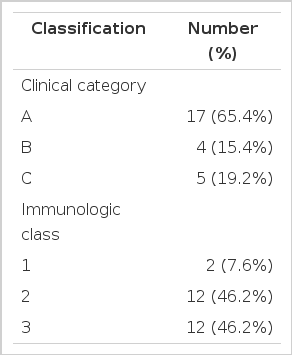
CDC classification of the study population
Clinically, seventeen (65.4%) patients were classified in CDC category A. Four (15.4%) patients were classified in category B, including 2 patients with diarrhea of an unknown cause for more than 1 month and 2 patients with recurrent herpes zoster infection. Five (19.2%) patients were in category C where 3 patients had Pneumoncystis carinii pneumonia, of which 2 patients also had the wasting syndrome of HIV, one patient had pulmonary tuberculosis and one patient had cryptococcal meningitis. Immunologically, 2 (7.6%) patients were class 1 (CD4+ cell counts >500/L), 12 (46.2%) were class 2 (CD4+ cell counts 200–499/L) and 12 (46.2%) were class 3 (CD4+ cell counts <200/L).
2. Immunoglobulin E levels
The mean IgE level was 473.5 IU/L with a standard deviation of 671.4 IU/L (range: 15.9–2,000 IU/L). Serum IgE level was increased (>200 IU/L) in ten (38.5%) of the twenty-six patients. Serum IgE was elevated in none of the patients in immunologic class 1, in 4 (33.3%) of the 12 patients in immunologic class 2 and in 6 (50%) of the 12 patients in immunologic class 3. Serum IgE was elevated in 6 (35.3%) patients in clinical category A, 2 (50%) patients in category B and 2 (40%) patients in category C. Serum IgE showed no correlation with the immunologic class (p=0.112, r=0.319) or clinical category (p=0.830, r=0.044) of HIV infection.
Eight patients consented to undergo a skin prick test. Although none of the patients had a history of atopic disease, three patients (37.5%) showed positive reactions to more than one allergen. A positive skin test did not show a positive correlation with serum IgE levels (p=0.531, r=−0.262). Also, there was no difference in serum IgE levels whether the patient was taking antiretroviral medication or not (p=0.911, r=−0.023).
3. CD4+ T cell counts and HIV RNA
The mean CD4+ cell count was 283.0/mm3 with a standard deviation of 273.9/mm3 (range: 0 to 1124/ mm3). CD4+ T cell count was inversely correlated to the serum IgE level (p<0.05, r=−0.429, Figure 1). HIV RNA was checked in 17 (65.4%) of the 26 patients. The mean HIV RNA level was 126,495 copies/mL with a standard deviation of 195,369 copies/mL (range: 233–726,894 copies/mL). HIV RNA showed an inverse correlation with CD4+ T cell count (p=0.001, r=−0.708), but showed no correlation with the serum IgE level (p=0.485, r=0.182).

The inverse correlationship between IgE and CD4+ T cells
4. Peripheral blood eosinophil count
Peripheral blood (PB) eosinophilia was seen in none of the study population. The mean PB eosinophil count was 99.7/mm3 with a standard deviation of 70.2/mm3 (range: 20.8–269.3/mm3). Eosinophil counts showed no correlation to CD4+ T cell counts (p=0.724, r=−0.074).
5. Immunogiobulin G, A, M levels
The mean serum IgG, IgA, and IgM levels were 1,939.5±588.6 mg/dL (range: 1120–2870 mg/dL), 388.9±216.7 mg/dL (range: 42.2–770 mg/dL) and 153.6±75.3 mg/dL (range: 62.4–294.0 mg/dL), respectively (Figure 2). Serum IgG and IgA were elevated above the normal levels in 70% and 35%, respectively. None of the patients had an increase in serum IgM level. The serum IgG, IgA and IgM levels showed no correlation to CD4+ T cell counts or serum IgE level (data not shown).

Serum levels of immunoglobulin isotypes (Bar ends represent the highest and lowest levels, thick bar lines represent the mean level and diagonal boxes represent 95% confidence interval).
DISCUSSION
In this study, the mean IgE level was increased in HIV positive patients and the serum IgE levels were inversely correlated to CD4+ T cell counts. These results confirm previous studies on the relationship between IgE and HIV6, 13) in Western countries and demonstrates the possibility that serum IgE level increases along with the severity of the disease in Korean patients with HIV infection.
Increased IgE production is commonly seen in atopic diseases and parasitic infestations. In this study, atopic diseases or parasitic infestations were screened primarily by questionnaire and stool examination and allergic skin tests were performed in some patients. Of the patients who underwent a skin prick test, no difference in the mean IgE was seen in atopic (positive skin test) and nonatopic (negative skin test) patients. Though the number of patients tested is small, this result is consistent with previous studies6, 14, 15) where no difference in mean serum IgE was found between atopic and nonatopic subjects with HIV infection. Goetz et al15) demonstrated a higher total IgE level with serologic evidence of specific IgE in atopic patients with early HIV disease than in nonatopic patients. But after development of AIDS, both patient groups had increased mean total IgE, regardless of specific IgE status, with no significant difference between the groups, thus suggesting the elevation of total IgE with HIV disease progression to be related to immunologic changes accompanying HIV disease progression and not to the presence or absence of allergic disease.
Wright et al6) reported an increase in mean serum IgE in HIV infected patients with a CD4+ T cell count ≤200/mm3 compared to HIV infected patients with a CD4+ T cell count ≥200/mm3. However, our study showed no correlation between serum IgE levels and CDC clinical or immunologic class. Also, despite a statistically significant correlation between CD4+ T cell counts and HIV RNA levels, no relationship was seen between serum IgE levels and HIV RNA levels. The reason for these discordances between CD4+ T cell count and CDC class or HIV RNA level is not clear at this moment. It might be due to differences in the characteristic of the study population or inherent disparities in the tests. Also, it might be a statistical error due to the small size of the study population.
HIV infected patients manifest an abnormal activation of B cells resulting in spontaneous proliferation and immunoglobulin secretion2–4, 16–18). This is probably due to activation of B cells by virus products, such as HIV gp41 envelope protein. In previous studies, increased serum levels of IgG, IgA and IgM have been seen in patients infected with HIV2–3, 16–18). Fling et al19) reported that though serum IgG levels were elevated even during the early stages of infection, serum IgA levels did not significantly increase until late in the course of the disease, thus suggesting that the serum IgA level in HIV infected patients might be useful as a marker of immunologic progression of disease. In our study, serum IgG and IgA levels were elevated above the normal levels in some patients and the mean serum IgG level was also elevated above normal. But the mean serum IgA and IgM levels were within normal limits and IgG, IgA and IgM levels were not correlated to immune status assessed by CD4+ T cell counts. Furthermore, no correlation was found between serum IgE level and either IgG, IgA or IgM levels. Lin et al14) also found no significant difference in mean serum IgE levels between subjects with and without the hypergammaglobulinemia associated with HIV infection. These findings suggest that the factors causing an increase in serum IgG, IgA or IgM in HIV infection may not be involved in the elevation of IgE.
The previous studies13, 20, 21) and this study suggest that an increased serum IgE level may be a marker of disease progression. Vigano et al20) had shown such a relationship between total IgE level and progression of disease in HIV infected children. Furthermore, Rancinan et al21) showed a high serum IgE level to be significantly associated with a faster progression to AIDS, suggesting IgE serum level as an additional prognostic marker.
IgE mediated reactions are dependent on the activation of CD4+ T cells of the TH2 subset. Clerici et al8–10) were the first to suggest that abnormal IgE synthesis might be explained by a switch from a TH1 to a TH2 cytokine profile during the course of HIV infection. TH1 cells produce gamma-interferon (IFN-γ) and IL-2 and promote cell-mediated effector responses; whereas TH2 cells produce IL-4, IL-5, IL-6, IL-10 and IL-13, which influence B cell development and can augment humoral responses. Thus, a TH1 to a TH2 switch would result in an increase in IL-4 production and a decrease in IL-2 and IFN-γ production, causing stimulation of IgE production. Initial studies9, 10, 22) on the switch from a TH1 to TH2 cytokine profile in HIV infection focused on increases in IL-4 and IL-10 and decreases in IL-2 but later studies23, 24) have investigated the roles of IL-12, IL-13 and IFN-γ. Agarwal et al24) showed the progression of HIV-1 infection to be associated with an increased plasma level of IL-10 and a reduced level of IFN-γ and IL-12. However, Maggi et al11) did not find a trend toward the TH2-like cytokine pattern in T cell clones from HIV-1 infected individuals during the progression to AIDS but they did demonstrate a preferential depletion of CD4+ TH2 cells in the advanced phases of HIV-1 infection.
Recently, immune cells other than lymphocytes have been suggested to be a major source of TH2 cytokines in patients with HIV infection. Marone et al25–27) have demonstrated that HIV-1 gp120, Tat protein and bacterial surface proteins activate human high-affinity IgE receptor (FcɛRI) expressing basophils and mast cells (FcɛRI+ cells) by acting as viral superantigens. HIV-1 gp120 can interact with the VH3 domain of IgE to induce the release of IL-4 and IL-13 from human FcɛRI+ cells25). During early HIV infection, basophils exposed to virus-bound or shed gp120 might represent an initial and critical source of IL-4 and IL-13, thereby favoring a shift of the response toward a TH2 phenotype. In advanced HIV infection when CD4+ T cells are decreased, FcɛRI+ cells might also represent a significant source of TH2-like cytokines26). Therefore during both early and advanced HIV infection, basophils and mast cells might be a relevant source of cytokines that contribute to the polarization of CD4+ cells toward TH2 cells. IL-4 and IL-13 released from human FcɛRI+ cells might also indirectly play a role in the entry of HIV-1 into CD4+ cells. The chemokine receptors CXCR4 and CCR5 are major coreceptors for HIV entry into CD4+ T cells28). Upregulation of CXCR4 by IL-4 facilitates HIV infection of T cells and might even be sufficient to trigger CD4+ T cell depletion29). These findings suggest that an imbalance in the TH1 and TH2 cytokine profile, due to activation of FcɛRI+ cells by HIV gp120 protein or Tat protein, might be a critical step in the progression of HIV infection.
In conclusion, serum IgE levels are increased and inversely correlated to CD4+ T cell counts and may be useful as a prognositic marker for disease progression in patients with HIV infection. Further studies on the molecular mechanisms of IgE overproduction and its role in HIV infection are needed.