Airway Obstruction after Acute Ozone Exposure in BALB/c Mice Using Barometric Plethysmography
Article information
Abstract
Background
Airway responsiveness after acute inhalation of ozone is related to the concentration and duration of ozone exposure. Using barometric whole-body plethysmography and increase in enhanced pause (Penh) as an index of airway obstruction, we measured the response of BALB/c mice to acute ozone inhalation to study the time course change of pulmonary function after ozone exposure.
Methods
Penh was measured before and after exposure to filtered air or 0.12, 0.5, 1, or 2 ppm ozone for 3 hr (n=6/group). In addition, Penh was measured 24, 48 and 72 hr after ozone exposure. Bronchoalveolar lavage (BAL) and histopathologic examinations were performed.
Results
The increase in Penh after ozone exposure was significantly higher in the 0.12, 0.5, 1 and 2 ppm groups compared with the control group (all p<0.01). Increases in Penh 24 hr after ozone exposure were significantly lower than those immediately after acute ozone exposure; however, increases in Penh 72 hr after ozone exposure were significantly higher than those in the control group (each p<0.01). The proportion of neutrophils in BAL fluid was significantly higher in the group exposed to 2 ppm ozone than in the groups exposed to filtered air or 0.12 ppm ozone (both p<0.01).
Conclusion
These results indicate that airway obstruction is induced following ozone exposure in a concentration-dependent manner and persists for at least 72 hr.
INTRODUCTION
Ozone is an important component of air pollution and is a photochemical oxidation product of substrates emitted from automobile engines. Attention has been drawn to its potential adverse effects on respiratory health because of its potential toxic effects related to its oxidant properties1).
Acute ozone exposure decreases pulmonary function, increases airway hyper-responsiveness (AHR) and induces airway inflammation in dogs2), guinea pigs3) and humans4–6). The effects on FEV1 are clearly related to the concentration and duration of ozone exposure, with the decrement increasing as exposure continues7).
Four different approaches have been used to measure altered airway function in mice: in vitro measurements of tracheal smooth muscle contractility after electrical field stimulation8), in vivo measurements of lung resistance or compliance after intravenous injection of bronchoconstrictors9), in vivo measurements of peak airway opening pressure10) and in vivo measurements of AHR in unrestrained, conscious mice using barometric whole-body plethysmography (WBP)11).
We examined the effects of a single 3-hr exposure to ozone (0.12, 0.5, 1, or 2 ppm) and the time course change of AHR in BALB/c mice, using barometric WBP.
MATERIALS AND METHODS
1) Animals and ozone exposure
Five- to six-week-old female BALB/c mice were obtained from Damul Laboratories (Daejon, Korea). The mice were maintained on OVA-free diets and housed individually in rackmounted stainless steel cages with free access to food and water. Mice housed in whole-body exposure chambers were exposed to ozone concentrations of 0.12, 0.5, 1, or 2 ppm, or filtered room air, for 3 h (n=6/group). Ozone was generated with Sander Model 50 ozonizers (Sander, Eltze, Germany). The concentration of ozone within the chambers was monitored throughout the exposure, by ambient-air ozone motors (Model 49C; Thermo Environmental Instruments Inc., Franklin, MA). The air-sampling probes were placed in the breathing zone of the mice. The mean chamber ozone concentrations (±SEM) during the 3-hr exposure period were 0.11±0.02, 0.48±0.05, 0.98±0.03 and 1.95±0.06 ppm for 0.12, 0.5, 1 and 2 ppm ozone, respectively. Temperature and humidity were maintained at a constant level within the chamber.
2) Determination of airway responsiveness
Airway responsiveness was measured by barometric plethysmography using WBP (Buxco, Troy, NY) immediately after ozone exposure, while the animals were awake and breathing spontaneously, using a modification of the method described by Hamelmann et al.11) Before taking the readings, the box was calibrated with a rapid injection of 150 μL of air into the main chamber. The pressure differences between the main WBP chamber containing an animal and a reference chamber (box pressure signal) were measured. This box pressure signal is caused by changes in volume and resultant pressure changes in the main chamber during the respiratory cycle of the animal. A pneumotachograph with defined resistance in the wall of the main chamber acts as a low-pass filter and allows thermal compensation. The time constant of the box was determined to be approximately 0.02 s. Mice were placed in the main chamber and baseline readings were taken and averaged for 3 min.
3) BAL fluid preparation and analysis
BAL was performed immediately after the last measurement of airway responsiveness. The mice were deeply anesthetized intraperitoneally with 50 mg/kg of pentobarbital sodium and were killed by exsanguination from the abdominal aorta. The trachea was cannulated with a polyethylene tube through which the lungs were lavaged three times with 1.0 mL of physiologic saline (4.0 mL total). The BAL fluid was filtered through wet 4×4 gauze. Trypan blue exclusion for viability and total cell count was performed. The BAL fluid was centrifuged at 150×g for 10 min. The obtained pellet was immediately suspended in 4 mL of physiologic saline and total cell numbers in the BAL fluid were counted in duplicate with a hemocytometer (improved Neubauer counting chamber). Then, a 100-μL aliquot was centrifuged in a cytocentrifuge (Model 2 Cytospin; Shandon Scientific Co., Pittsburgh, PA). Differential cell counts were made from centrifuged preparations stained with Diff-quick, counting at least 500 cells in each animal at 1,000× magnification (oil immersion).
4) Histopathologic examinations of lung tissue
After BAL, 10% formalin was instilled into the trachea through a polyethylene tube and the lungs were dissected and fixed in 10% formalin solution and embedded. Random 3-μm thick sections were stained with hematoxylin and eosin. Two observers blindly examined the histopathologic changes under light microscopy.
5) Statistical analysis
All data were analyzed using SPSS version 7.5 for Windows. Data were expressed as the mean±SEM. Inter-group comparisons were assessed by a non-parametric method using the Mann-Whitney U test. The correlation between variables was examined using the Spearman rank correlation coefficient. A p-value of less than 0.05 was regarded as statistically significant.
RESULTS
1) Airway responsiveness
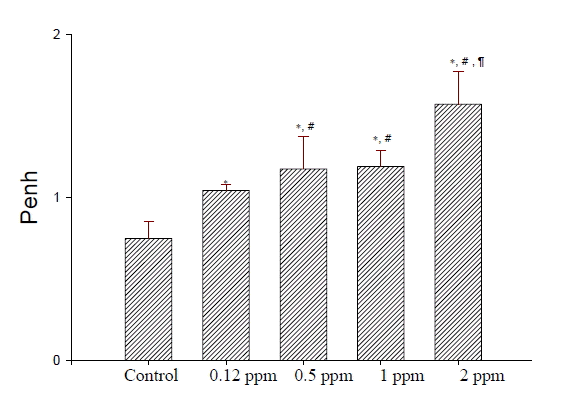
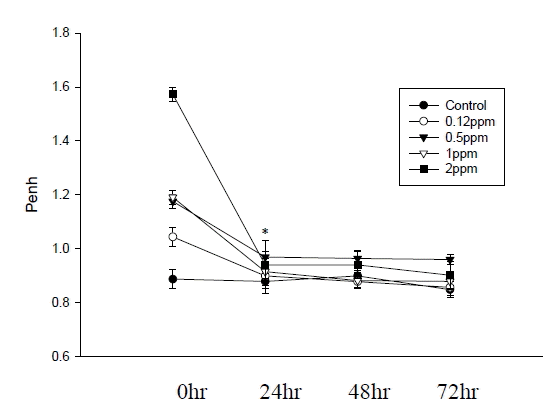
Dose-dependent increases in Penh after ozone exposure were significantly higher in the groups exposed to 0.12, 0.5, 1, or 2 ppm compared with the control group (all p<0.01, Figure 1). Increases in Penh 24 hr following ozone exposure were significantly lower than those immediately after acute ozone exposure. There were no significant differences in the increases in Penh between the 24, 48 and 72 hr groups (Figure 2). However, increases in Penh after ozone exposure were significantly higher 72 hr following ozone exposure than those in the control group (all p<0.01).

Dose-dependent increases in enhanced pause (Penh) after ozone exposure for 3 hours. *p<0.01 compared with the control and 0.12 ppm group. #p<0.05 compared with the 0.5 ppm group. ¶p<0.01 compared with the 0.12, 0.5 and 1 ppm groups.
2) Cell differentials in BAL fluid
The recovery rates of BAL fluid were similar in all groups (2.8±0.04 mL). Compared with the groups exposed to filtered air and 0.12 ppm ozone, the proportion of neutrophils recovered in BAL fluid was increased after exposure to 2 ppm ozone (both p<0.01, Table 1).
3) Histopathologic examinations of lung tissue
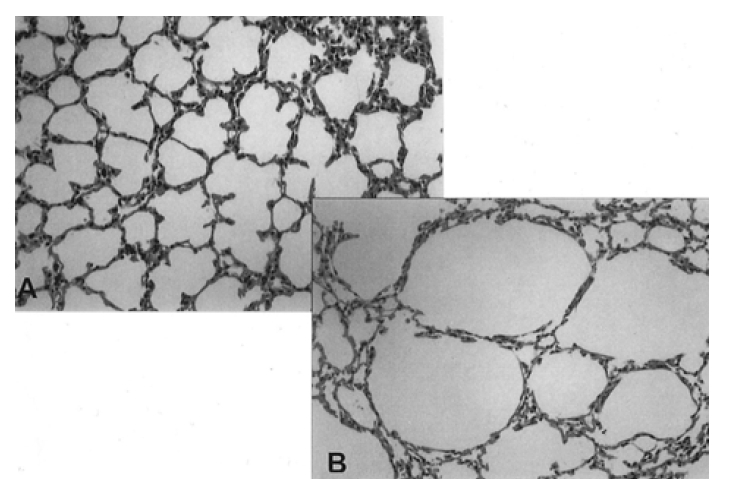
Compared with the group exposed to filtered air, the lung tissues of the groups exposed to ozone showed hyperinflation, bronchiolar epithelial shedding, mucus and cell plugging in the bronchiolar lumen, and airway smooth muscle contraction (Figure 3, 4).

Representative photomicrographs of lung tissue from a mouse exposed to filtered air (A, ×100) and ozone (B, ×100). Marked hyperinflation is seen following ozone exposure.
DISCUSSION
In this study, we observed that increases in Penh in mice after ozone exposure were concentration-dependent and that airway obstruction persisted for at least 72 hr following acute ozone exposure.
Penh measured in mice using barometric plethysmography is a valid indicator of bronchoconstriction and can be used to measure AHR12, 13). Bronchoconstriction is known to alter breathing patterns, and changes in Pause (timing of early and late expiration) and Penh are really due to alterations in the timing of breathing, as well as prolongation of the expiratory time. Furthermore, airway constriction increases the thoracic flow asynchronously with the nasal flow, resulting in an increase in the box pressure signal14). Penh is an empiric parameter that reflects changes in the waveform of the measured box pressure signal that are a consequence of bronchoconstriction. Several authors have used barometric WBP to measure AHR in guinea pigs, rats and mice11–13). In this study, we measured in vivo airway responsiveness in conscious, spontaneously breathing mice before and after ozone exposure at different ozone concentrations.
Acute inhalation of toxic doses of ozone induces macrophage accumulation in the lung and the release of cytotoxic and pro-inflammatory mediators. These include hydrogen peroxidase, nitric oxide, tumor necrosis factor, interleukin 1 and fibronectin15). A number of studies have found associated changes in neutrophils and eosinophils16, 17). In this study, the proportion of neutrophils increased in the 2 ppm ozone group, suggesting that neutrophil inflammation plays an important role in mice exposed to ozone.
The effects of ozone on airway methacholine responsiveness can be detected as early as 90 min after exposure and the biochemical changes in BAL fluid can persist for as long as 18 h18, 19). Our results showed that airway obstruction after acute ozone exposure persisted for at least 72 hr, suggesting that acute ozone exposure may induce long-standing airway obstruction. Further studies are needed to investigate the effects of long-time ozone exposure. The persistent nature of ozone-induced mucous cell metaplasia in rats suggests that ozone exposure has the potential to induce similar long-lasting alterations in the airways of humans20). The magnitude of the FEV1 decrement is a function of ozone concentration, minute ventilation during exposure and duration of exposure16, 21). Adams et al.22) reported significant linear relationships between changes in lung function and total inhaled dose. Costa et al.23) observed that ozone concentration seems to be a more important predictor of response than does duration. Consistent with previous studies16, 21–23), increases in Penh in mice were ozone dose-dependent, indicating that ozone exposure can decrease airway function in an animal model. So far, there are no human studies following ozone exposure in Korea. McDonnell et al.24) have identified a sigmoid-shaped mathematical model form that accurately and precisely described the observed mean FEV1 decrement in a sample of 374 young, healthy, nonsmoking males as a function of exposure rate and duration of exposure.
In conclusion, increases in Penh in mice were dose-dependent and persisted for at least 72 hr following acute ozone exposure, suggesting that ozone may induce long-lasting airway obstruction.


