


INTRODUCTION
Acute myeloid leukemia (AML) is a clinically heterogeneous disease characterized by multitudes of chromosomal abnormalities and gene mutations. With advances in next generation sequencing (NGS) techniques, more sophisticated risk stratification models have been adapted for better management of the disease [1-3]. Unfortunately resistance to treatment and relapse remains a big challenge, and some feel that the mutation status alone is not enough to predict the prognosis of AML.
Leukemic stem cells (LSCs) are cells with self-renewal capacity to repopulate a leukemia and often thought as the major cause of resistance and relapse despite their low frequency [4-6]. The origin of these cells, whether it be from normal hematopoietic stem cells or from more mature progenitors that gain stem-ness features, may differ among patients [7-9], but previous reports on the prognostic implications of LSCs support the importance of eliminating LSCs to improve AML clinical outcomes [4]. As such, understanding the relationship between LSC and genetically defined sub-clones can, in turn, help to understand the heterogeneity of AML [10]. However, to date, there are only a few reports specifically focusing on this topic. To this end, we conducted this study to (1) examine the phenotypic diversity of AML-LSC, (2) explore the association between AML-LSC phenotypes and gene mutations, and (3) investigate the prognostic implications of AML-LSCs.
METHODS
Study design and subjects
Newly diagnosed adult AML patients, defined as 18 years or older, were included for this study. Patients with acute promyelocytic leukemia were excluded. The patient selection and bone marrow sample acquisition was done between October 2016 and July 2018. At the end, a total of 52 patients were included for analyses. Their medical records were reviewed and analyzed for demographics, baseline disease characteristics, factors related to treatment, response to treatment, adverse events including treatment related mortality, and survival outcomes. Data available up to March 2019 were used. Their bone marrow samples collected at AML diagnosis were subjected to flow cytometry and NGS.
The diagnosis of AML was made according to the WHO classification of hematopoietic neoplasms [11], which requires identification of 20% or more leukemic blasts in the bone marrow. Secondary AML was defined as AML following myelodysplastic syndrome (MDS) or myeloproliferative neoplasm (MPN) confirmed prior to the diagnosis of AML. Cytogenetic studies were performed onsite, whose satisfactory performance was monitored by a national external quality assurance scheme. Bone marrow cells were cultured for 24 hours then karyotype was analyzed using the standard G-banding technique. The karyotypes were constructed and chromosomal abnormalities were reported in accordance with the International System for Human Cytogenetic Nomenclature [12]. Prognostic grouping of cytogenetics was performed according to Southwest Oncology Group (SWOG) criteria [13]. Risk stratification was mainly based on cytogenetics, and NGS results for those with available data, according to 2019 National Comprehensive Cancer Network (NCCN) guidelines [14].
The study was conducted in compliance with all national and international ethical standards for research with humans and for research using radiopharmaceuticals. This study was conducted according to the Declaration of Helsinki and was approved by the Institutional Review Board of Seoul National University Hospital (IRB No. H-1902-140-101). Written informed consent was obtained from all patients. All authors had access to the study data and reviewed and approved this study.
Flow cytometry
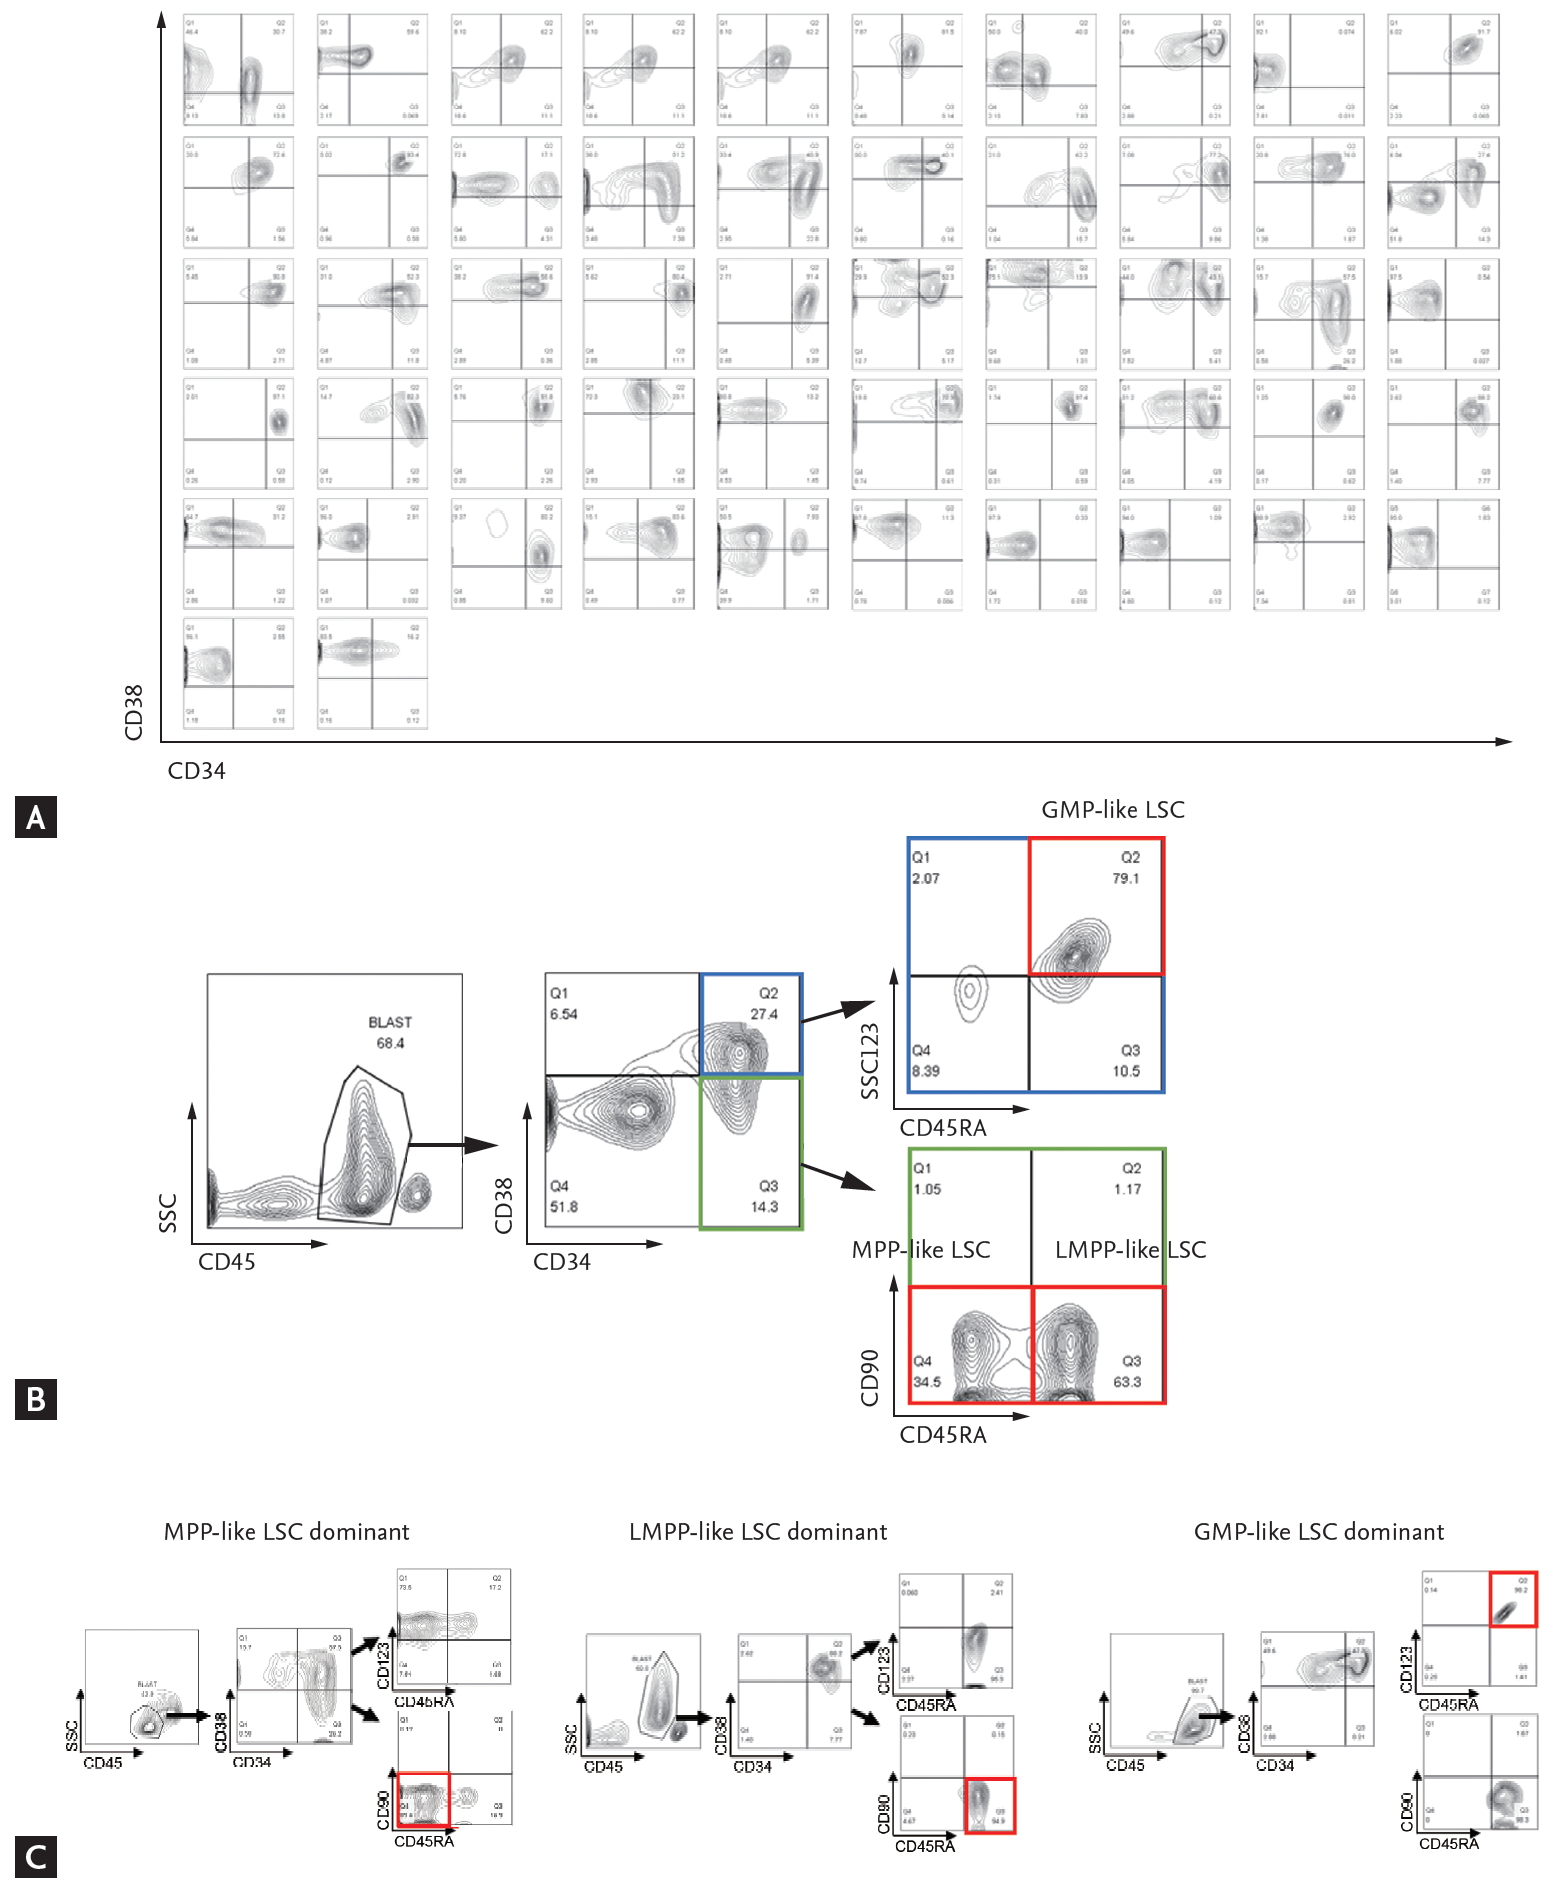
Mononuclear cells were isolated from the patient’s bone marrow aspirates by ficoll gradient centrifugation and cryopreserved in serum-free medium. Stored cells were thawed to Iscove’s Modified Dulbecco’s Medium and washed with fluorescence-activated cell sorting (FACS) buffer (2% fetal bovine serum, Dulbecco’s phosphate-buffered saline). Cells were stained with following anti-human monoclonal antibodies: CD45-APC/cy7 (557833), CD34-APC (555824), CD38-BV421 (562445), CD90-PE (555596), CD123-PE/Cy7 (560826), and CD45RA-PerCP/Cy5.5 (563429) (BD Bioscience). Analyses were performed on a FACSCanto II (High Throughput Sampler, BD Bioscience, Franklin Lakes, NJ, USA) and FlowJo version 10.0 program (BD Bioscience). First, the expression profiles of CD34 and CD38 markers were analyzed (Fig. 1A). Then, the phenotypes of LSCs were further analyzed per methods proposed by Goardon et al. [15]; multipotent progenitor (MPP)-like LSC (CD34+CD38–CD90–CD45RA–), lymphoid primed multipotent progenitor (LMPP)-like LSC (CD34+CD38+CD90–CD45RA+) and granulocyte-macrophage progenitors (GMP)-like LSC (CD34+CD38+CD123+CD45RA+). The CD45 and side scatter properties were used for gating bulk leukemic blast cells and sub-gated from the cells [16], as shown in Fig. 1B. End results showed that there was a dominantly expressed LSC phenotype in each patient (Fig. 1C). In some cases, two or more LSC phenotypes co-existed. The percentage of cell fractions satisfying each LSC phenotype markers in CD34+ cells was calculated.
Targeted capture and massive parallel sequencing
The DNA capture probes for 76 target genes were designed using the Agilent SureDesign web-based application (https://earray.chem.agilent.com/suredesign/, Agilent Technologies, Santa Clara, CA, USA). The target regions included protein coding exons with 10 bp intron flanking regions and hot spot regions of the 20 genes involved in recurrent translocations. DNA was extracted on a Chemagic 360 instrument (Perkin Elmer, Baesweiler, Germany). The genomic DNA was sheared using Covaris S220 focused-ultrasonicator (Covaris, Woburn, MA, USA). We used 50 ng of total input genomic DNA. A library preparation was performed according to Agilent’s SureSelectQXT Target Enrichment protocol (Agilent Technologies). Paired-end 150-bp sequencing was using NextSeq 550 Dx platform (Illumina, San Diego, CA, USA). Targeted sequencing raw data was obtained in FASTQ format.
Secondary analysis using in-house bioinformatics pipeline
The produced sequencing data was analyzed using the Seoul National University Hospital First Hemic Panel Analysis Pipeline (FHPAP). First, we performed the quality control of the FASTQ file and analyzed only the data that passed the criteria. Pair-end alignment to HG19 reference genome was performed using BWA-men and the GATK Best Practice [17,18]. After finishing the alignment step, an “analysis-ready BAM” was produced and a second quality control is performed to determine if further variant calling is appropriate. In the pipeline, SNV, InDel, CNV, translocation, FLT3 ITD, and KMT2A PTD were analyzed using at least more than two analysis tools including in-house and open-source software. Along with in-house software, GATK UnifiedGenotyper, SNVer, LoFreq were used for SNV/InDel detection [18-20], Delly and Manta for Translocation discovery [21,22], and THetA2 and CNVKit for purity estimation and CNV calling [23,24], respectively. FLT3 ITD and KMT2A PTD were analyzed by only the in-house software. Detected variants was annotated by SnpEff with various database such as RefSeq, COSMIC, dbSNP, ClinVar, and gnomAD. Then germline variant was filtered using the population frequency of these databases (> 1% population frequency) [25-30]. Finally, the variants were confirmed throughout a comprehensive review of a multidisciplinary molecular tumor board.
Statistical analysis
The relapse free survival (RFS) and overall survival (OS) curves were estimated using the Kaplan–Meier method. The RFS was derived from the date AML diagnosis to that of relapse or death from any cause, while the OS was defined as the time from AML diagnosis to death from any cause. If patients survived, RFS and OS was censored on the last date of follow-up when no death or relapse was confirmed. Complete remission rate, based on the revised recommendations of the Center for International Blood and Marrow Transplant Research (CIBMTR) group, with induction was compared. Induction TRM was also analyzed, and defined as mortality during induction chemotherapy. The differences between groups were assessed using a Mann–Whitney test or one-way analysis of variance for continuous variables, and Pearson chi-square test for categorical variables, as indicated. All data were analyzed using the SAS Enterprise Guide version 6.1 (SAS Institute, Cary, NC, USA) and the statistical software R (www.r-project.org). A p value of < 0.05 was considered statistically significant.
RESULTS
Patient characteristics, AML subtypes and LSC phenotypes
The baseline characteristics of the enrolled patients are presented in Table 1. There were 40 de novo AML and 12 secondary AML patients. Among secondary AML patients, there were four post-MPN AML patients and eight post-MDS AML patients. The median age of the whole group was 62 years.
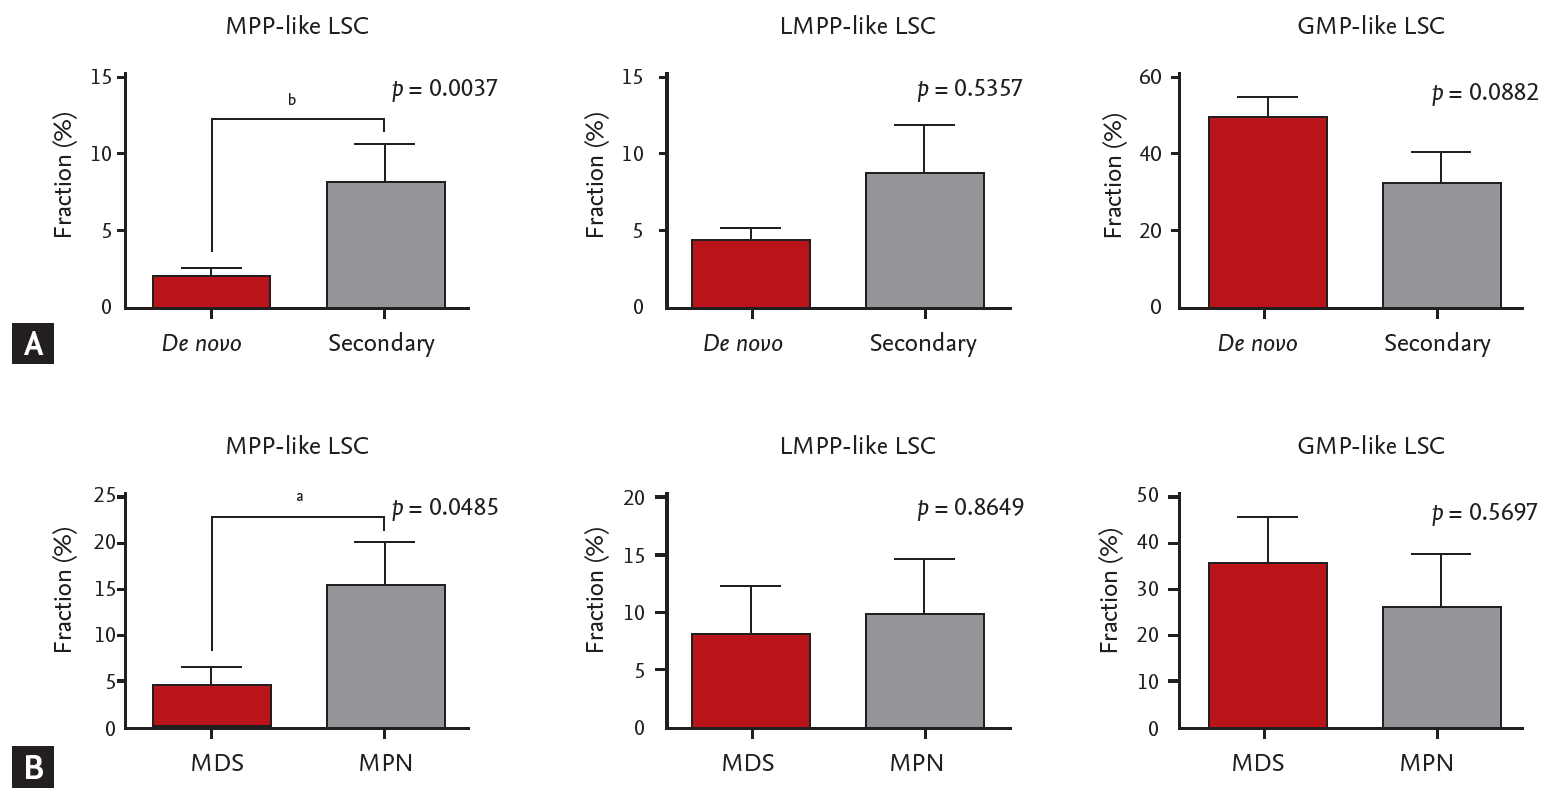
When different LSC phenotypes were considered, secondary AML group showed higher fraction of CD34+CD38– cells (p = 0.0245) and MPP-like LSCs (p = 0.0037) compared to de novo AML group (Fig. 2A). When secondary AML was further classified into post-MPN versus post-MDS, there was a statistically significant increase in percentage of MPP-like LSCs in post-MPN AML compared to post-MDS AML (p = 0.0485) (Fig. 2B). Collectively, secondary AML, particularly post-MPN AML, was associated with higher fraction of the MPP-like LSC phenotype compared to its de novo counterpart.
To determine the association between the age and LSC phenotype compositions, patients were divided into two group according to age at AML diagnosis at cutoff of 65 years (Supplementary Fig. 1). The CD34+CD38– cell fraction was higher for younger patients (i.e., ≤ 65 years), but there were no differences in LSC phenotypes between the two age groups.
Risk stratification, survival and LSC phenotypes
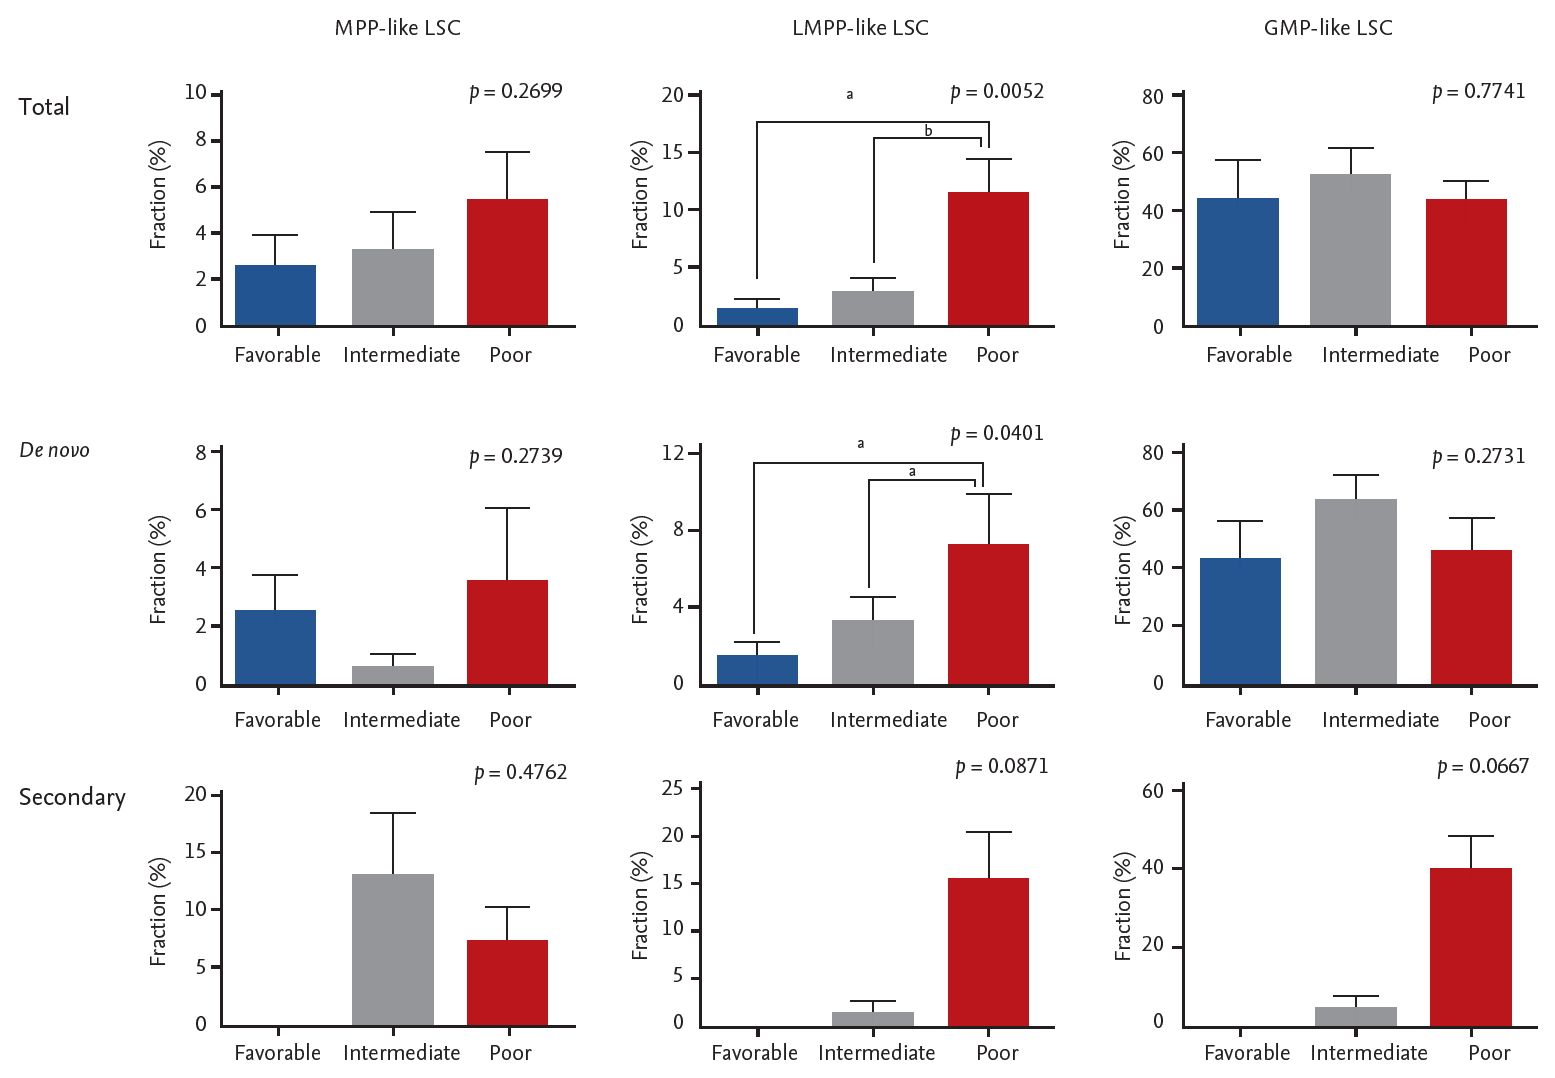
While data on conventional cytogenetics was available in all patients, the NGS data was not available in 14 patients due to lack of quality-assured samples. The majority of the patients were classified as intermediate risk by both cytogenetics risk stratification and combined risk stratification based on NGS data (Table 1). No correlation was seen between cytogenetics risk and LSC phenotypes (Supplementary Table 1). On the other hand, LMPP-like LSC was predominant in the poor risk group by combined risk stratification (p = 0.0052) (Fig. 3). This was true for both de novo AML (n = 28, p = 0.0401) and secondary AML (n = 10, p = 0.0871) patients (Supplementary Table 2).
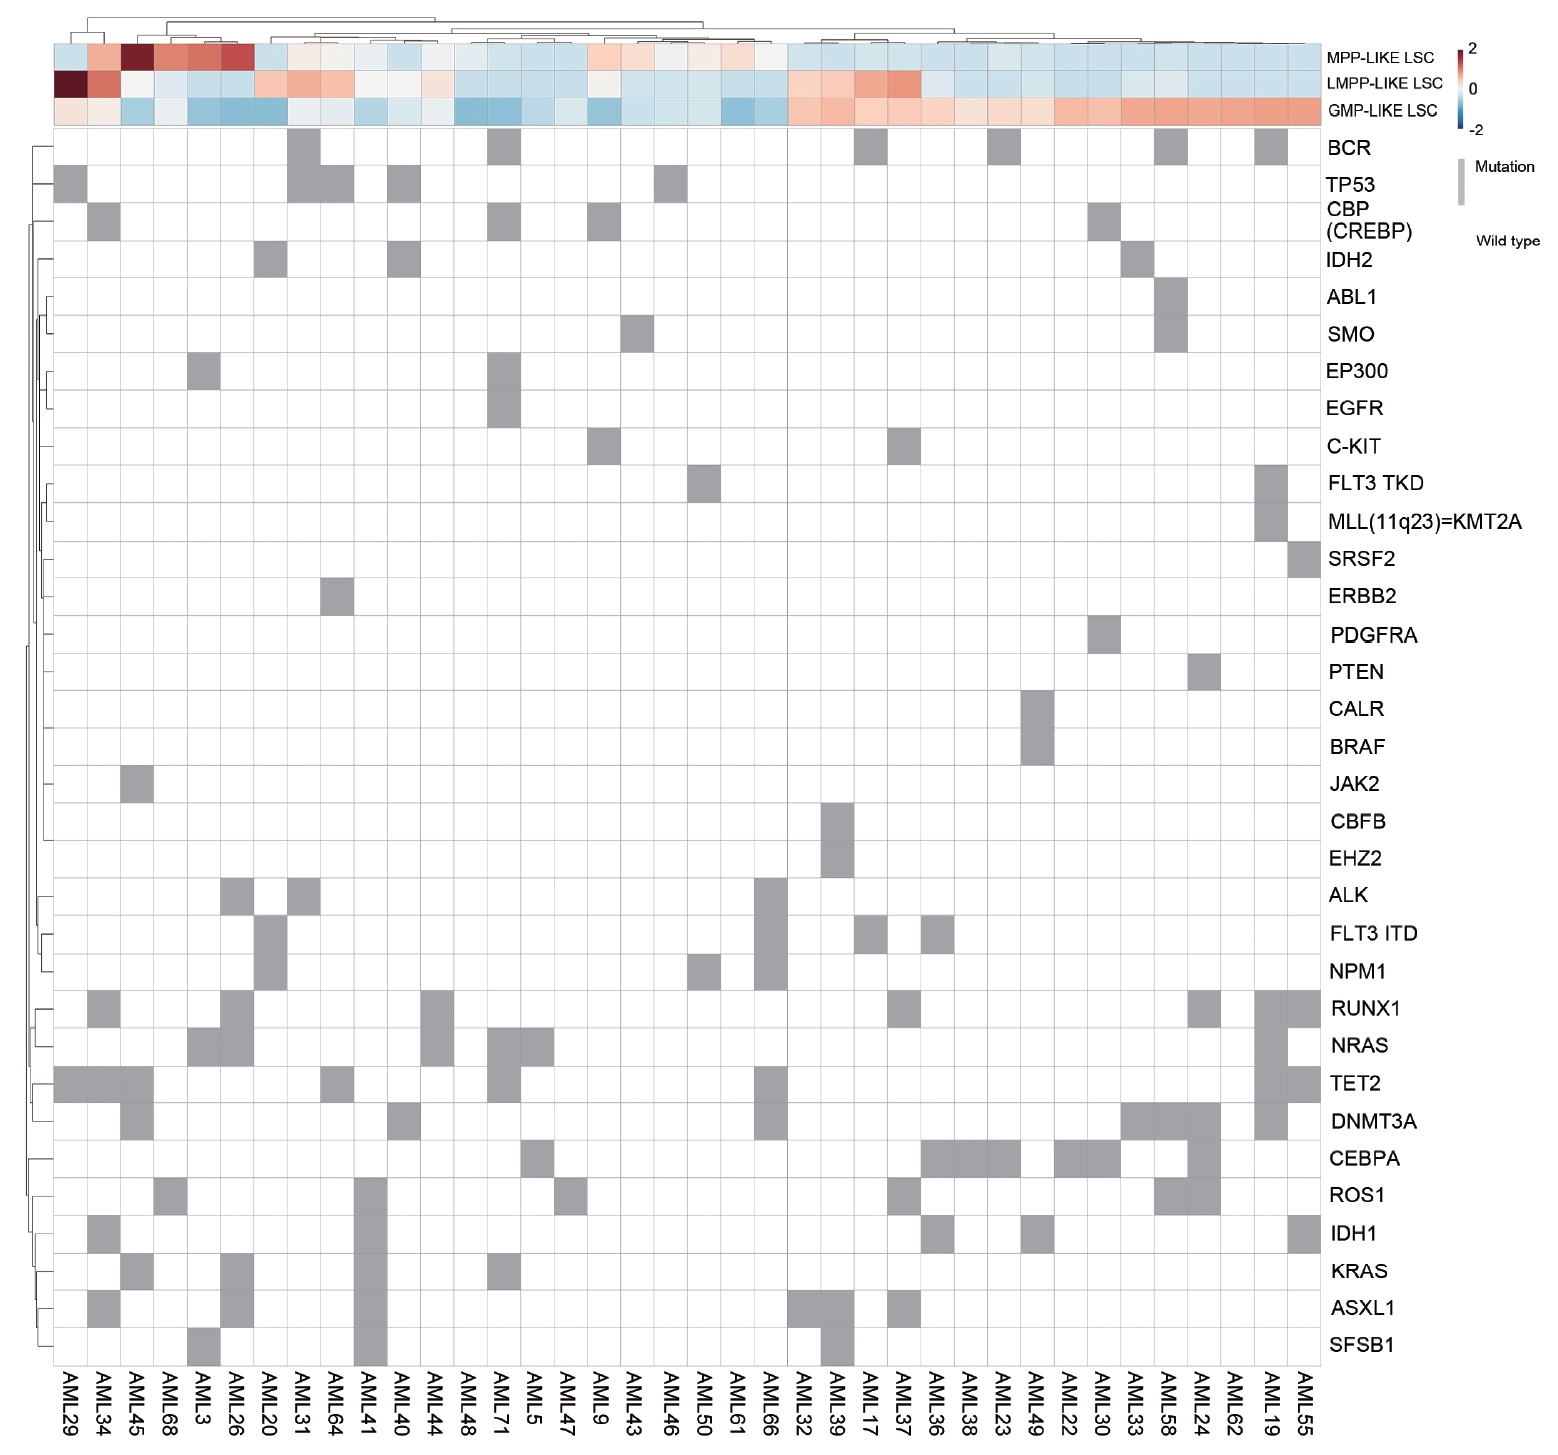
For survival analyses, the patients were grouped according to their dominant LSC phenotypes (Fig. 4). There were ten patients in MPP-like LSC group, 11 in LMPP-like LSC group, and 31 in GMP-like LSC group. For the entire cohort, the mean RFS was 10.8 months and mean OS 12.3 months (Supplementary Table 3). Supplementary Fig. 2 represents the survival curves of the patients undergoing treatment per dominant LSC phenotype. In light of small number of patients with heterogeneous treatment schema, only those who underwent treatment regardless of intensity were included for survival analyses. Furthermore, to compensate the innate differences in survival among different AMLs, de novo AML and secondary AML were analyzed separately. There was no correlation between RFS or OS and LSC phenotype in either group.
Individual mutations and LSC phenotypes
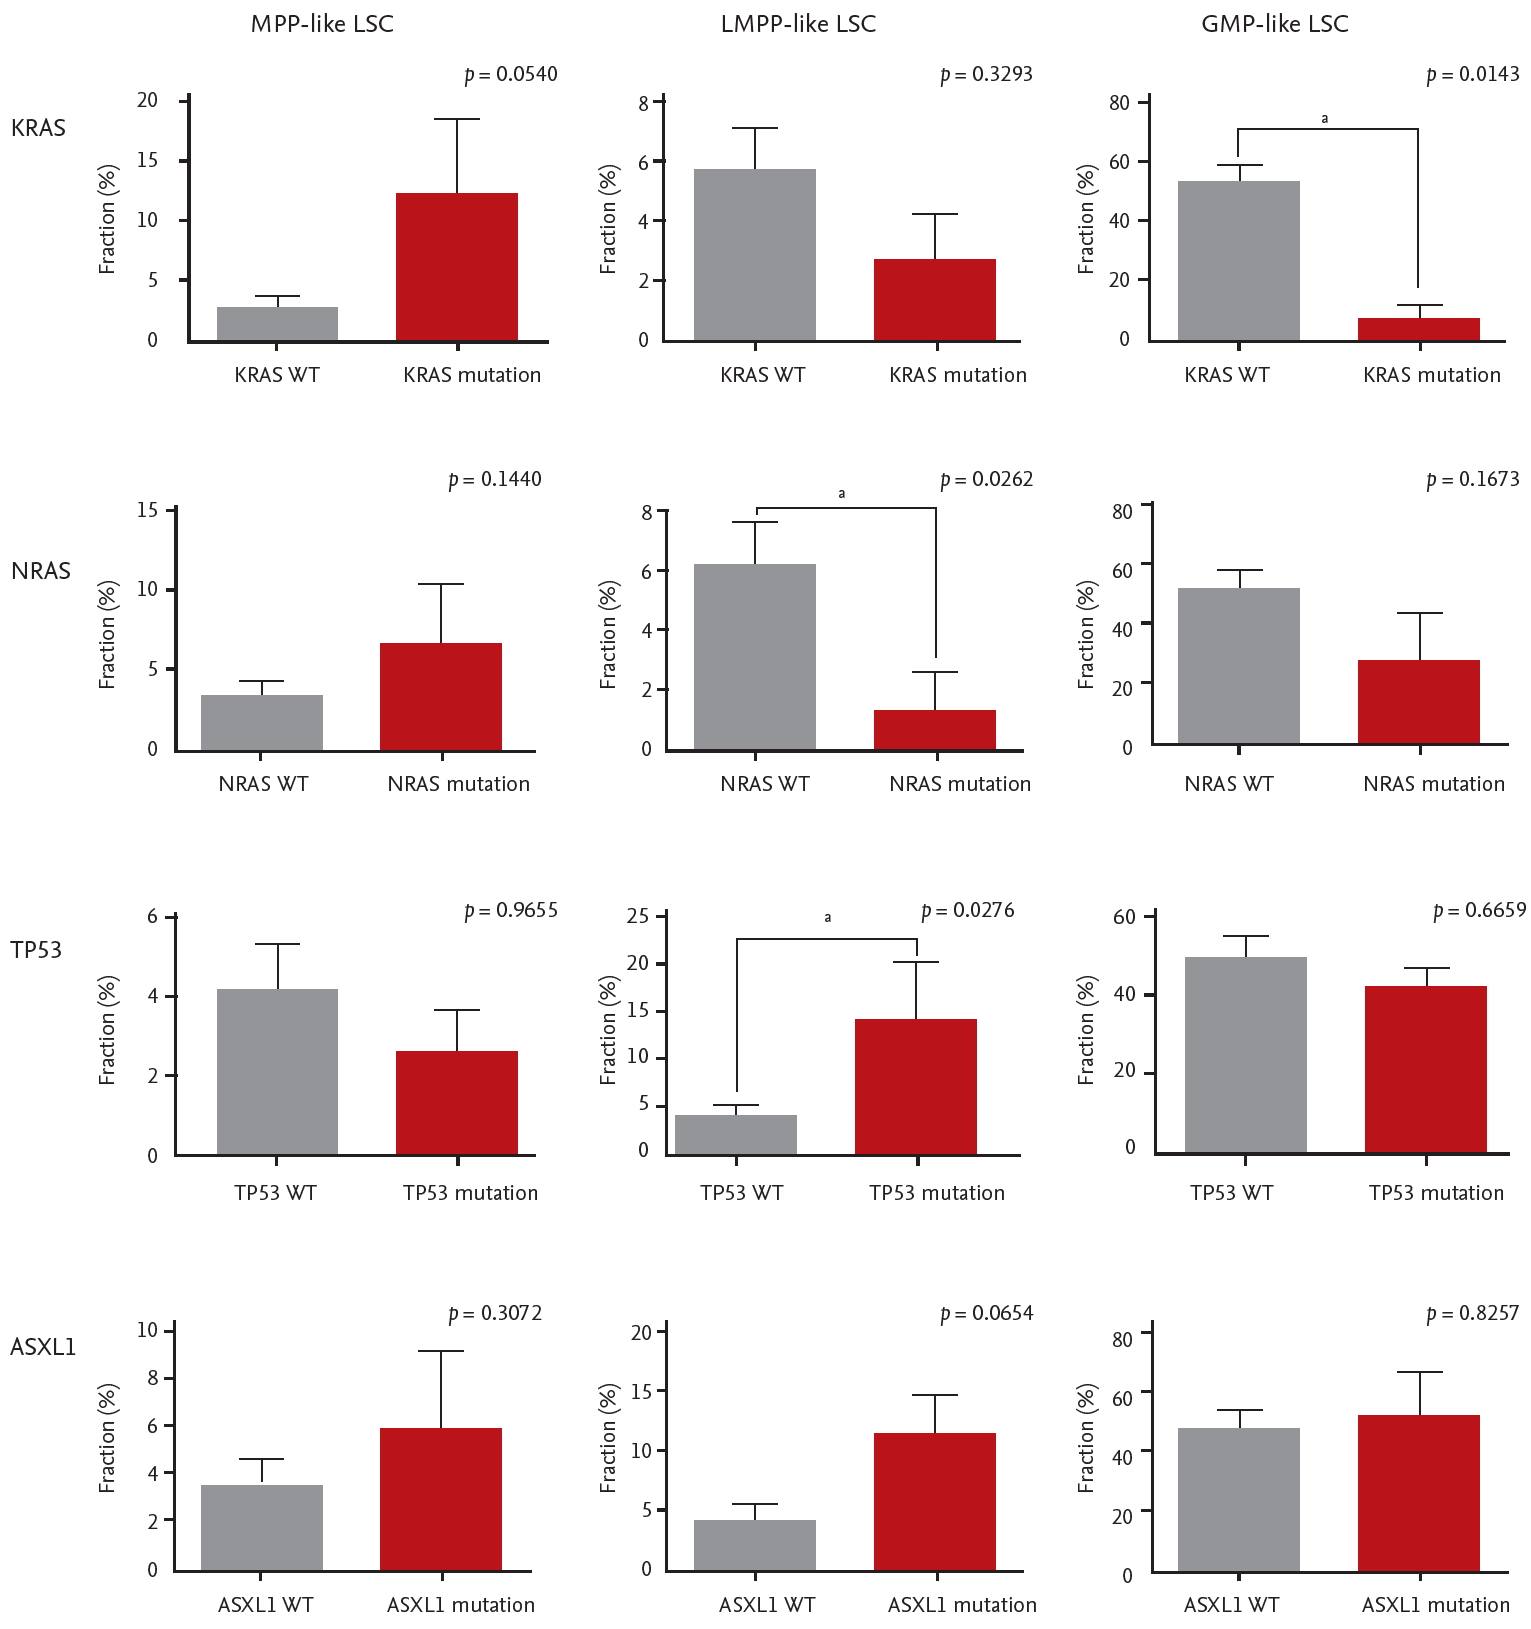
The mutational landscape of enrolled patients is shown in Fig. 4. We looked for specific mutations that were enriched in each LSC phenotype group. Mutations in CEPBA (6 out of 7), DNMT3A (4 out of 7), and IDH1 (3 out of 5) were predominantly clustered in GMP-like LSC group. On the other hand, mutations in NRAS (4 out of 6) and KRAS (3 out of 4) were dominantly found in MPP-like LSC group, while mutations in TP53 (4 out of 5) and ASXL1 (5 out of 6) were often found in LMPP-like LSC group.
This observation was verified by comparing the LSC phenotype composition of specific mutation carriers versus non-carriers (i.e., wild-type). The differences in LSC expression per CEBPA, DNMT3A, and IDH1 mutations were not statistically significant. Interestingly, KRAS mutants showed higher fraction of MPP-like LSC compared to KRAS wild-types (Fig. 5). Also, the fraction of GMP-like LSC was significantly lower in KRAS mutants. NRAS mutants also showed similar tendencies, but the difference did not reach statistical significance. For TP53 and ASXL1 mutants, LMPP-like LSC was present in higher fraction. For TP53 mutants, the expression of LMPP-like LSC was significantly higher by 3.4-folds (p = 0.0276) compared to wild-type. ASXL1 mutants also showed trends towards higher expression of LMPP-like LSC (p = 0.0654).
DISCUSSION
The importance of our study lies in that we showed for a given AML patients there is a dominant LSC phenotype and LSCs are associated with clinical outcomes, supporting the significance of cancer stem cell model for human AML. First of all, based on detailed characterization of the surface immunophenotype of AML-LSCs we found that AML show evidence of a hierarchical cellular organization (Fig. 1). We also recognized that the composition of LSC phenotypes is associated with AML phenotypes. For example, secondary AML patients showed higher fraction of MPP-like LSCs compared to de novo AML patients (Fig. 2). Given that MPP-like LSCs are at the apex of LSC hierarchy, these cells are thought capable of initiating AML [4] and able to protect themselves from chemotherapy via ATP-binding cassette transporters [31-33]. In this regard, the higher expression of MPP-like LSCs could explain the poor response to standard treatments traditionally associated with secondary AML. Furthermore, the higher expression of MPP-like LSCs in post-MPN AML compared to post-MDS AML could explain the dismal prognosis associated with post-MPN AML, despite the relative indolent clinical course in their chronic phase and the presence of druggable target.
Interestingly, age did not seem to affect the composition of LSCs (Supplementary Fig. 1). The expression of CD34+CD38– cell fraction was higher in younger patients, but this was probably due to the higher total number of cells in younger patients. When each LSC phenotype was considered, there was no difference between age groups. From clinical point of view, this finding implies two things: (1) this could explain the unsatisfactory RFS with hypomethylating agents (HMA) alone, and (2) this supports the role of allogeneic stem cell transplantation in elderly AML patients and at the same time highlights the unmet medical needs for better transplant techniques in such population. Whilst it is true that HMA has broadened the therapeutic options for elderly AML, since LSCs are reported to be more hypomethylated compared to leukemic blasts to begin with, these agents cannot eradicate LSCs hence the short RFS [34]. Thus, allogeneic stem cell transplantation remains the only currently available option of eradicating LSCs [6].
Moving onto the association between LSCs, gene mutations and prognostic implications, we found that LSC phenotypes by themselves do not predict survival outcomes but when taken in together with gene mutations they carry certain predictive values. It is true that AML risk stratification has been refined considerably with the advent of NGS. However, even within the same risk group some patients do much worse than others. KRAS/NRAS mutations deserve special attention in this regard. It has been found that there is a sequential order for the acquisition of AML defining gene mutations during leukemogenesis. Somatic mutations in signaling pathways that drive proliferation, such as KRAS/NRAS, are considered later events in AML transformation [35,36]. In our samples the variant allele frequencies of KRAS/NRAS mutations were less than 10% in most patients, confirming these mutations are acquired later during clinical course. Whether RAS mutations confer prognostic values or not is yet to be settled [37-39], thus they are not incorporated in the current risk stratification schema [14]. Although the relationship is somewhat tenuous, we showed that RAS mutants might actually be associated with worse prognosis because they tend to carry higher fraction of MPP-like LSCs (Fig. 5).
The obvious limitation of our study includes the small number of patients included. Another pitfall of our study is that the NGS was carried out with DNA extracted from bone marrow samples at diagnosis, rather than with the gated LSCs. However, we believe the value of our study lies in that it contains adequate scientific clues to inspire future studies regarding the genetics of LSC and their prognostic values. Given that merging of data on genomic and epigenomic landscape of AML with biology of LSCs is still in its infancy, our data might provide certain clues for further investigations.
In conclusion, our findings provide better insights into the characteristics and clinical implications of LSC. Although in a small scale, we provide evidence that specific LSC phenotypes are associated with certain mutations thus should be in the AML risk stratification process.
KEY MESSAGE
1. Leukemic stem cells (LSCs) are associated with clinical outcomes in acute myeloid leukemia (AML) patients, supporting the significance of cancer stem cell model for human AML.
2. The composition of LSC phenotypes is associated with AML phenotypes. For example, secondary AML patients showed higher fraction of multipotent progenitor-like LSCs compared to de novo AML patients.
3. LSC phenotypes, when taken in together with gene mutations, carry certain predictive values. This can explain why even within the same risk group some patients do much worse than others.
 PDF Links
 PubReader
 ePub Link
 Full text via DOI
 Download Citation
 Supplement 1
 Print
Print


