Effect of urinary angiotensinogen and high-salt diet on blood pressure in patients with chronic kidney disease: results from the Korean Cohort Study for Outcome in Patients with Chronic Kidney Disease (KNOW-CKD)
Article information
Abstract
Background/Aims
This study aimed to investigate whether urinary angiotensinogen (UAGT) excretion was associated with elevated blood pressure in patients with chronic kidney disease (CKD) and to evaluate the relationship among blood pressure, intra-renal renin-angiotensin system (RAS) activity, and dietary sodium in patients with CKD.
Methods
Participants from the Korean Cohort Study for Outcome in Patients with Chronic Kidney Disease (KNOW-CKD) were included. Of the total cohort of 2,238 individuals with CKD, we included 1,955 participants who underwent complete 24-hour urinary sodium (24-hour UNa) analysis. They were categorized into three groups according to three tertiles of their 24-hour UNa, reflecting daily salt intake. To measure intra-renal RAS activity, the UAGT excretion was assayed with an enzyme-linked immunosorbent assay.
Results
Elevated 24-hour UNa levels, logarithm of UAGT-to-creatinine ratio (UAGT/Cr), increased waist-to-hip ratio, and decreased estimated glomerular filtration rate were the risk factors for increased systolic blood pressure. Systolic blood pressure showed a positive correlation with 24-hour UNa levels and logarithm of UAGT/Cr.
Conclusions
UAGT and urinary sodium excretion are independent determinants of systolic blood pressure in patients with CKD. These findings suggest that increased systolic blood pressure in CKD patients is associated with both increased dietary sodium levels and intra-renal RAS activity. The risk of elevated systolic blood pressure in the 3rd tertile of both the UAGT/Cr and 24-hour UNa groups was about 2.3 times higher than that in the reference group.
INTRODUCTION
Increased renin-angiotensin system (RAS) activity is an independent risk factor for hypertension and when it is accompanied by sodium retention following volume expansion, the risk intensifies. In general, as a consequence of enhanced sodium retention, the activity of the systemic RAS is suppressed [1,2]. The question of whether salt intake leads to hypertension directly has been controversial for decades. Extensive studies have been conducted to identify the pathophysiological mechanisms responsible for the heterogeneity of responses due to increased salt intake [3-5]. Inappropriate or paradoxical activation of the intra-renal RAS, oxidative stress, and inflammatory cytokines in the kidney are key factors that lead to the development of salt - sensitive hypertension [6,7]. The intra-renal RAS, independent of the systemic RAS, plays an important role in the pathophysiology of hypertension and renal injury [6,8]. Moreover, high sodium diet modulates renal hemodynamics and tubular resorptive function to enhance sodium retention, volume expansion, and the development of hypertension [9]. Hypertension is associated with both increased intra-renal RAS activity and volume expansion [10], and it gets worse when these exist concomitantly.
Angiotensinogen (AGT) is the only known substrate for renin, the rate-limiting enzyme of the RAS, and changes in AGT levels as well as renin levels can control the activity of the RAS [11]. Angiotensin II in renal tissues is locally generated from AGT produced by the proximal tubule cells and delivered in the kidney. Urinary angiotensinogen (UAGT) may serve as a new biomarker to reflect the activity of intra-renal RAS activity, because it is derived largely from proximal tubular AGT. In addition, urinary excretion of AGT highly correlated with intra-renal AGT and angiotensin II levels [12-19].
The objective of the present study was to investigate whether UAGT excretion was associated with elevated blood pressure in chronic kidney disease (CKD) patients, and to evaluate the relationship between blood pressure, intra-renal RAS activity, and dietary sodium in patients with CKD.
METHODS
Study subjects
The design of the Korean Cohort Study for Outcome in Patients with Chronic Kidney Disease (KNOW-CKD) study has been described in detail in a previous study [20]. KNOW-CKD is a patient-based multicenter cohort study involving nine tertiary-care general hospitals in Korea. The KNOW-CKD enrolled ethnic Korean patients with CKD of stages 1 to 5 aged between 20 and 75 years. A total of 2,238 adults with CKD were enrolled from all participating centers between 2011 and 2015 in an ongoing prospective cohort study in collaboration with a multicenter cohort study. Of the total 2,238 patients, 1,955 patients who completed the measurements of 24-hour urinary sodium (24-hour UNa) excretion were included our analysis. The estimated glomerular filtration rate (eGFR) was calculated using the CKD Epidemiology Collaboration (CKD-EPI) creatinine (Cr) equation [21]. The serum and urine samples were subsequently collected on a regular basis according to the standardized protocol. All data, including clinical information, laboratory results, and outcomes were entered into a web-based, electronic, case-reporting form. The patients were divided into three groups according to their 24-hour UNa and UAGT to Cr (UAGT/Cr) ratio values.
Clinical data and laboratory analyses
The clinical data, including detailed demographic information and baseline laboratory results, were extracted from the electronic data management system (PhactaX, Seoul, Korea). The morning spot urine samples were collected from all patients to measure the UAGT, urinary Cr, albumin, and protein levels. The urine samples were centrifuged at 1,500 rpm for 10 minutes at 4°C. The urinary supernatants were pooled, and the UAGT concentrations were measured using human AGT ELISA kits (IBL, Takasaki, Japan). Intra-assay and inter-assay coefficients of variation for the human AGT ELISA kits were 4.4% and 4.3%, respectively [22]. The urinary concentrations of AGT and albumin were normalized to the urinary Cr level. The resting blood pressure was measured at each clinic using an electronic sphygmomanometer. Based on the etiology of CKD, the patients were categorized as having glomerulonephritis, diabetic nephropathy, hypertensive nephropathy, and polycystic kidney disease.
Statistical analysis
R language version 3.3.3 (R Foundation for Statistical Computing, Vienna, Austria) and T&F program ver. 2.0 (YooJin BioSoft, Goyang, Korea) were used for all statistical analyses. The data were expressed as mean ± SD for continuous variables. The continuous variables, including systolic blood pressure (SBP), diastolic blood pressure (DBP), 24-hour UNa, and UAGT/Cr were transformed to categorical variables having three subgroups corresponding to the three respective tertile ranges. For the continuous variables, Pearson correlation and Spearman correlation coefficient were computed. Linear regression analysis was performed to analyze the effect of each clinical measurement on the continuous response of SBP. Multivariable linear regression analysis was performed using backward stepwise procedure as a variable selection method to minimize Akaike information criterion (AIC). Significance level of 0.1 was set for the univariable analysis to select initial input variables for the multivariable analysis (Supplementary Table 1).
Binary logistic regression analysis was performed to analyze the effect of each clinical measurement on the binary response of SBP (1st and 2nd group vs. 3rd group). For analyzing the combined effect of more than two variables on the SBP (1st and 2nd group vs. 3rd group), multivariable logistic regression analysis was performed using backward stepwise procedure as a variable selection method to minimize AIC. Significance level of 0.1 was set for the univariable analysis to select the initial input variables for the multivariable analysis.
Ethical approval and informed consent
The study protocol was approved by the Institutional Review Board at each participating clinical center—i.e., Seoul National University Hospital (1104-089-359), Seoul National University Bundang Hospital (B-1106/129-008), Yonsei University Severance Hospital (4-2011-0163), Kangbuk Samsung Medical Center (2011-01-076), Seoul St. Mary’s Hospital (KC11OIMI0441), Gil Hospital (GIRBA2553), Eulji General Hospital (201105-01), Chonnam National University Hospital (CNUH-2011-092), and Inje University Pusan Paik Hospital (11-091) in 2011. Written informed consent was obtained from all study participants. This study was conducted in accordance with the principles of the Declaration of Helsinki.
RESULTS
Baseline characteristics and comparison of study participants according to 24-hour UNa excretion
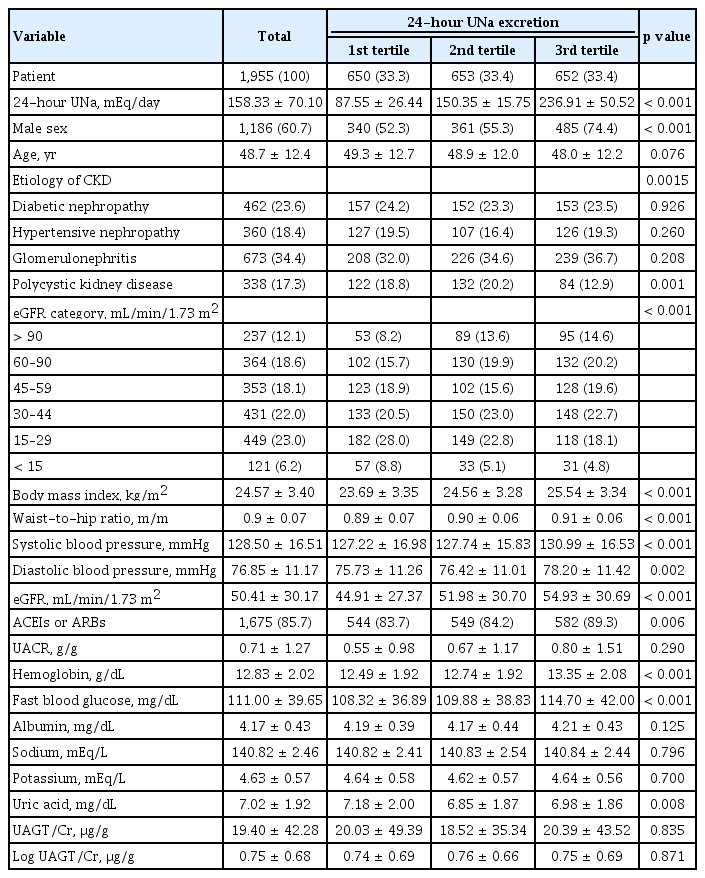
A total of 1,955 patients (mean age, 48.7 ± 12.4 years; 60.7% male population) were included in this study. The etiology of primary renal disease in the subjects was hypertension in 18.4%, autosomal dominant polycystic kidney disease in 17.3%, diabetes in 23.6%, and glomerulonephritis in 34.4% of the subjects. The mean 24-hour UNa level was 158.33 ± 70.10 mEq/day. Table 1 represents the demographics and clinical features in the three 24-hour UNa categories. In the group with high 24-hour UNa excretion, the proportion of males, body mass index, waist-to-hip ratio, SBP, and DBP was higher. In addition, in the group with high 24-hour UNa, RAS blockers (angiotensin-converting enzyme inhibitors and angiotensin II receptor blocker) were more used, and serum hemoglobin and fasting blood glucose were also higher. On the other hand, mean UAGT/Cr was 20.03, 18.52, and 20.39 μg/g respectively, in the three groups and there were no significant differences among them. There were no pertinent differences in values of serum albumin, sodium, potassium concentration and urinary albumin Cr ratio. The 24-hour UNa had no correlation with logarithm (Log) of UAGT/Cr (coefficient R, 0.005; p = 0.831; not shown).
Factors affecting SBP
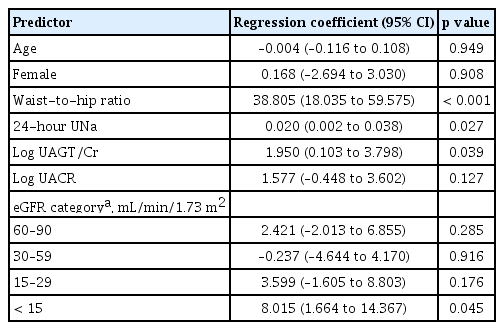
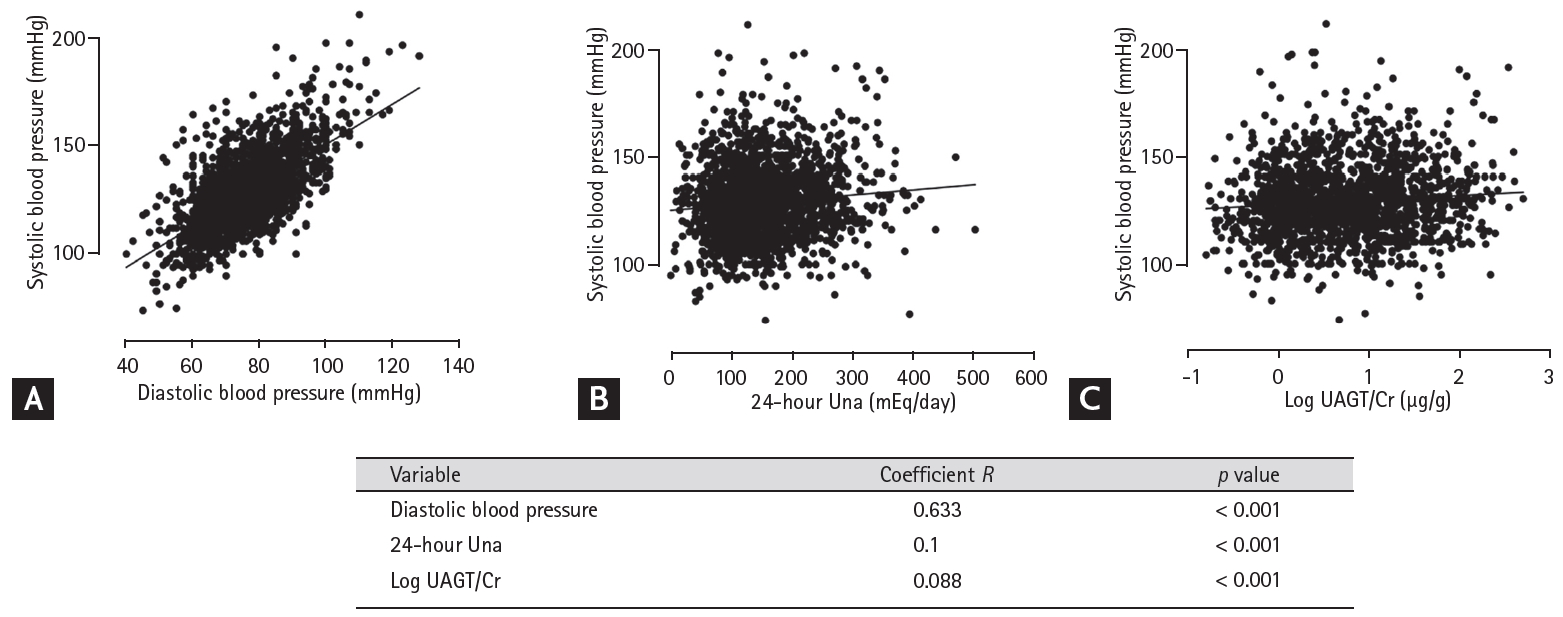
We evaluated factors affecting SBP in CKD patients. SBP was related to waist-to-hip ratio, 24-hour UNa, Log UAGT/Cr, eGFR < 15 mL/min/1.73 m2 (Table 2). SBP had a positive correlation with DBP, 24-hour UNa, and Log UAGT/Cr (Fig. 1).

Results of the multiple linear regression analysis using the backward stepwise method for systolic blood pressure
Effect of 24-hour UNa excretion and UAGT/Cr on SBP
Fig. 1 represents the single regression analysis for SBP. SBP revealed a positive association with DBP (coefficient R, 0.633; p < 0.001), Log UAGT/Cr (coefficient R, 0.1; p < 0.001), and 24-hour UNa levels (coefficient R, 0.088; p < 0.001). Patients were divided into nine groups based on the third tertile of 24-hour UNa and UAGT/Cr. Table 3 showed that in the three groups with the lowest 24-hour UNa (1st tertile), SBP increased as the UAGT/Cr increased. Similarly, in the three groups with the lowest UAGT/Cr values (1st tertile), SBP increased significantly as the 24-hour UNa increased. SBP was the highest (with a mean blood pressure of 131.873 ± 1.384 mmHg) in the cluster with the highest tertiles (third groups) of both 24-hour UNa and UAGT/Cr compared to that of the other groups (Table 3).
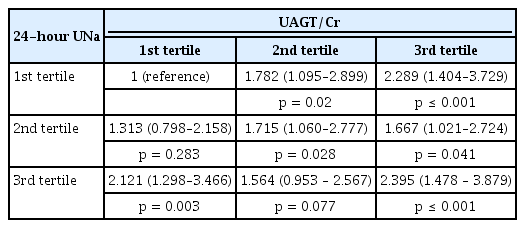
After adjusting for clinical and basic demographic factors including age, sex, five stages according to the eGFR category, waist-to-hip ratio, body mass index, and hemoglobin level, the odds of having the 3rd tertile (highest) of SBP in each patient group was analyzed by multivariable binary logistic regression (Table 4). The odds ratio of the group with the lowest 24-hour UNa and UAGT/Cr was used as a reference. In this study, the risk of elevated SBP in the 3rd tertile of both the UAGT/Cr and 24-hour UNa groups was about 2.3 times higher than that in the reference group. High SBP was associated with elevated levels of both UAGT/Cr and 24-hour UNa.

OR (95% CI) for the 3rd tertile (highest) of systolic blood pressure according to the 24-hour UNa and UAGT/Cr
In the three groups with the lowest 24-hour UNa (1st tertile), odds of an elevated SBP increased with a large difference as the UAGT/Cr increased. Similarly, in the three groups with the lowest UAGT/Cr values (1st tertile), odds of SBP increased considerably as the 24-hour UNa increased. Therefore, when the value of either 24-hour UNa or UAGT/Cr was low, SBP was more strongly affected by the other corresponding variable.
DISCUSSION
The present study demonstrated that enhanced intra-renal RAS activity and high urinary sodium excretion were associated with high SBP in CKD patients. It was conducted by using data from the KNOW-CKD study, which was a well-designed, cross-sectional study of 2,238 patients with CKD. The group with the highest tertile of UAGT/Cr and 24-hour UNa had the highest tertile SBP with an odds ratio of 2.395 compared to the rest of the group. The high salt intake and intra-renal RAS activity may be related to the group with the increased SBP.
Many observational studies have evaluated the relationship between high salt intake and blood pressure, and obtained conflicting results. Recently, however, numerous observational studies, Cochrane meta-analyses, and randomized trials have revealed that there is a close association between salt intake and elevated blood pressure [23-25]. Our study showed that for every 100 mEq/day increase of 24-hour UNa, SBP increased by 2.0 mmHg (p = 0.027) (Table 2). This is a small change compared to the results of the Korean National Health and Nutritional Examination Survey, which revealed that as 24-hour UNa increased by 100 mEq/day, SBP increased by 6.1 mmHg [26]. This may be explained by the fact that sensitivity to changes in blood pressure due to sodium intake is very distinctive for an individual and is known to be associated with genetic susceptibility [27]. In salt-sensitive hypertensive patients, a long-term high-salt diet can cause hypertension and renal injury, more prominently than in the general population [28-31]. When sodium retention occurs, the intra-renal RAS activity may be elevated, which may be the mechanism underlying salt-induced hypertension, which causes hypertensive renal injury [7]. Additionally, salt-sensitive patients exhibited higher blood pressure and less plasma renin activity suppression in response to elevated sodium intake [32-34]. In our present study, higher the salt intake, higher the SBP and DBP. This may affect CKD progression, even among those with better renal function and high eGFR. This is because high-salt diet is associated with increased renal injury and significant changes in the gene expression of renal cytokines that are related to the pro-inflammatory response and endothelial dysfunction, and attenuated cell differentiation and survival [35].
While previous studies conducted in patients classified as salt-sensitive groups have shown that high salt intake leads to an increase in intra-renal RAS activity, our study did not show a correlation between UAGT excretion and urinary sodium excretion. Understandably, as in our study we had not distinguished between salt-sensitive and salt-resistant groups. However, it showed that UAGT excretion was independently associated with SBP. It was also demonstrated that the group with the highest urinary sodium excretion and UAGT excretion showed the greatest odds of presenting with high SBP.
The strength of the present study is that it provides evidence in a relatively large, well-designed CKD patient cohort. To our knowledge, this was the first Asian study to show an effect of both UAGT and high-salt diet on SBP in CKD patients. Regardless, this study had several limitations. First, owing to the cross-sectional nature of the study, it was difficult to demonstrate the cause-effect relationship between SBP and 24-hour UNa and UAGT/Cr. Second, more than 85% of the patients with CKD were on RAS blocker; these patients could not be excluded or analyzed as a different group. Third, it does not provide insights on 24-hour UNa and daily sodium intake in CKD patients with impaired tubular function and sodium reabsorption.
In conclusion, both the intra-renal RAS and high-salt diet could be related to the elevation of SBP in CKD patients. Modulating and monitoring each of these in hypertensive CKD patients may help alleviate renal injury. While treating patients with hypertension, both the amount of sodium in the diet and the intra-renal RAS need to be considered. More research in the future will be needed to determine if dietary sodium restriction could be a more effective treatment for patients with increased intra-renal RAS activity.
KEY MESSAGE
1. Systolic blood pressure (SBP) showed a positive correlation with 24-hour urinary sodium (24-hour UNa) and urine angiotensinogen-to-creatinine ratio (UAGT/Cr), in patients with chronic kidney disease (CKD).
2. SBP was the highest in the group with the highest 24-hour UNa (third tertile) and the group with the highest UAGT/Cr (third tertile).
3. These findings suggest that increased SBP in CKD patients is associated with both increased dietary sodium and intra-renal renin-angiotensin system activity.
Notes
No potential conflict of interest relevant to this article was reported.
Acknowledgements
This research was assisted by the Research Program funded by the Korea Centers for Disease Control and Prevention (2011E3300300, 2012E3301100, 2013E3301600, 2013E3301601, 2013E3301602, 2016E3300200), the Basic Science Research Program through the National Research Foundation of Korea (NRF) funded by the Ministry of Science, ICT & Future Planning (2015R1D1A1A01061037), by the Bio & Medical Technology Development Program of the NRF funded by the Korean government, MSIT (2017M3A9E8023001), and by a grant (BCR18015-1) of Chonnam National University Hospital Biomedical Research Institute.


