Association of kidney function and proteinuria with lower-extremity dysfunction in older Korean adults: a cross-sectional study
Article information

Abstract
Background/Aims
Chronic kidney disease (CKD) is associated with complications that affect physical function and mobility. This study investigated the associations between kidney function, proteinuria, and lower-extremity dysfunction.
Methods
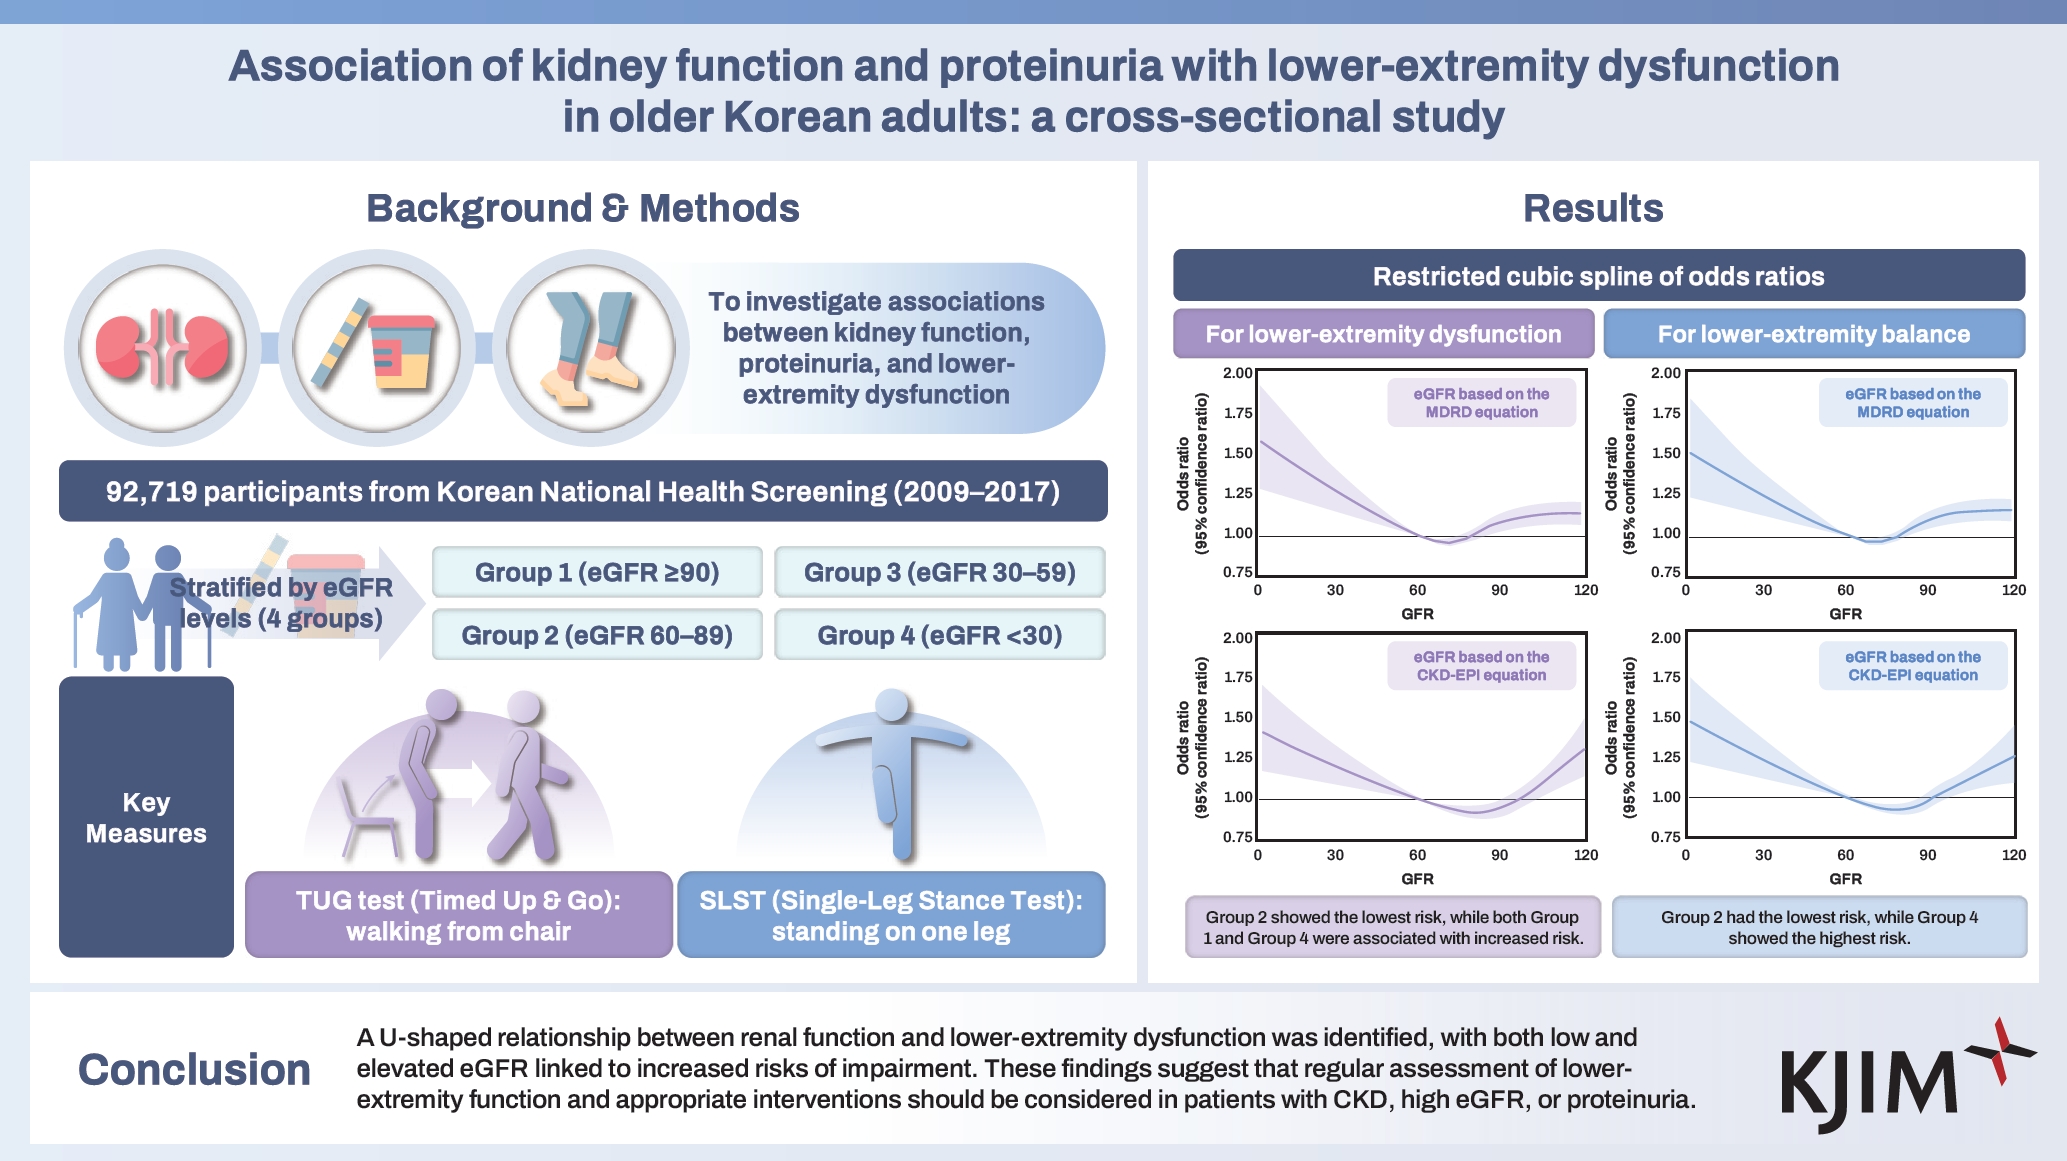
Data were obtained from the Korean National Health Insurance Service Health Screening Program, including individuals aged 66 years who participated in the National Screening Program for Transitional Ages in Korea. Participants were stratified based on estimated glomerular filtration rate (eGFR) into four groups: Group 1 (eGFR ≥ 90 mL/min/1.73 m2), Group 2 (60 ≤ eGFR < 90 mL/min/1.73 m2), Group 3 (30 ≤ eGFR < 60 mL/min/1.73 m2), and Group 4 (eGFR < 30 mL/min/1.73 m2). Lower-extremity dysfunction was assessed using two physical tests measuring function and balance. Multivariable logistic regression was performed to examine the associations between kidney function, proteinuria, and lower-extremity dysfunction.
Results
Group 2 served as the reference. Both decreased (Groups 3 and 4) and elevated (Group 1) eGFR levels were significantly associated with an increased risk of lower-extremity dysfunction (Group 4: adjusted OR 1.40, 95% CI 1.10–1.78; Group 1: adjusted OR 1.19, 95% CI 1.12–1.25). Similar patterns were observed for balance dysfunction. A U-shaped relationship was identified between eGFR and lower-extremity dysfunction. Proteinuria was independently associated with balance dysfunction (adjusted OR 1.35, 95% CI 1.20–1.51) but not with lower-extremity dysfunction.
Conclusions
A U-shaped relationship was identified between renal function and lower-extremity dysfunction, with both lower and elevated eGFR linked to increased risks of impairment, underscoring the need for regular assessment of lower-extremity function and appropriate interventions in patients with CKD, elevated eGFR, or proteinuria.
INTRODUCTION
Lower-extremity function, including muscle strength, balance, and mobility, is essential for maintaining independence, mobility, and overall quality of life [1,2]. As individuals age, a decline in lower-extremity strength is associated with reduced functional mobility, slower gait speed, and increased sedentary behavior, all of which negatively affect cognitive function, emotional well-being, and self-sufficiency [3,4]. Moreover, reduced lower-extremity strength is a major risk factor for falls, a leading cause of injury and hospitalization among older adults, thereby increasing both societal and personal medical burdens [5,6]. The impact of lower-extremity weakness extends beyond mobility limitations, often presenting as a comorbidity in chronic conditions such as chronic kidney disease (CKD), diabetes mellitus (DM), and cardiovascular diseases (CVDs) [7,8]. This weakness exacerbates physical impairment and limits physical activity levels, which are critical for managing these chronic conditions [9]. The kidneys play a vital role in maintaining electrolyte balance, acid-base homeostasis, and the excretion of metabolic waste, functions essential for optimal muscle performance [10-12]. CKD is characterized by structural or functional kidney abnormalities that persist for at least 3 months and carry significant health implications [13]. Recent studies have highlighted a link between CKD and impaired lower-extremity function, which is associated with increased mortality, higher hospitalization rates, and a greater risk of falls, fractures, and loss of independence [11,14]. Proteinuria, an early indicator of glomerular dysfunction, often precedes a detectable decline in renal function [15]. It is associated with increased oxidative stress, systemic inflammation, and endothelial dysfunction, reflecting broader vascular impairment [16,17]. Additionally, proteinuria is a strong and independent predictor of an elevated risk of all-cause and cardiovascular mortality in individuals with and without CKD [15,18]. Although previous studies have identified a general association between CKD and lower- extremity dysfunction, the specific relationships between varying levels of kidney function, proteinuria, and lower-extremity performance remain poorly understood. This study aimed to investigate these associations in a large cohort of older adults (aged 66 years) in South Korea. Using data from the National Health Insurance Service Health Examination and Health Screening (NHIS-HEALS) cohort database, which includes information from the Transitional National Screening Program, we sought to clarify the impact of renal function and proteinuria on lower-extremity performance in this population.
METHODS
Study population
This study utilized data from the NHIS-HEALS cohort database, which contains comprehensive insurance claim records covering approximately 98% of the Korean population [19]. The analysis included individuals aged 66 years who participated in the National Screening Program for Transitional Ages between January 2009 and December 2017. Participants with missing data (n = 2,634) and those with documented disabilities, such as lower-extremity dysfunction or walking impairments, identified through questionnaires (n = 1,210), were excluded. The final analysis included 92,719 individuals (Fig. 1). Abnormalities in lower-extremity function and balance were assessed by trained examiners, with the data available through the NHIS-HEALS database. This database also provides a wide range of demographic, socioeconomic, and clinical information, including healthcare utilization records and health screening data such as blood test results. Further details regarding the NHIS-HEALS database are available at: https://nhiss.nhis.or.kr/en/z/a/001/lpza001m01en.do. The study protocol was approved by the Institutional Review Board of Chosun University Hospital and adhered to the principles of the Declaration of Helsinki (approval number: CHOSUN IRB 2024-09-014-002). The requirement for informed consent was waived by the Institutional Review Board due to the use of anonymized, de-identified data.
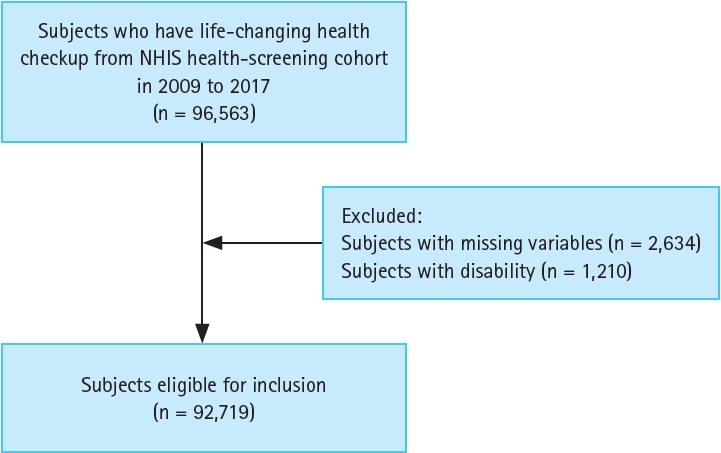
Flowchart of the study population. NHIS, National Health Insurance Service.
Covariates
To control potential confounding factors, the analysis incorporated a comprehensive set of covariates, including sociodemographic characteristics (such as sex and income level) and physical measurements (such as body mass index [BMI], waist circumference, and systolic and diastolic blood pressure). Similarly, a range of laboratory parameters, including fasting blood glucose, lipid profile components (total cholesterol, triglycerides, and high-density lipoprotein cholesterol), liver function indicators (aspartate aminotransferase, alanine aminotransferase, and gamma-glutamyl transferase), hemoglobin levels, and renal function (assessed using the estimated glomerular filtration rate [eGFR]), were also extensively considered. The eGFR was calculated using both the Modification of Diet in Renal Disease (MDRD) and CKD Epidemiology Collaboration (CKD-EPI) equations (Supplementary Table 1) [13,20]. Proteinuria was assessed using a dipstick test and categorized into six levels: absent, trace, 1+, 2+, 3+, and 4+. Proteinuria was defined as a urine dipstick result of ≥ 1+. Additionally, comorbid conditions were identified using health screening and prescription data based on the International Classification of Diseases, 10th Revision codes. These included hypertension (HTN; I10, I11), DM (E11–E14), dyslipidemia (E78), ischemic heart disease (IHD; I20–I25), CVD (I60–I64), chronic obstructive pulmonary disease (COPD; J41–J44), and depression (F32, F33) (Supplementary Table 2). Lifestyle factors were assessed using questionnaires that collected information on smoking habits, alcohol consumption, and physical activity. Participants were categorized as non-smokers, ex-smokers, or current, and as non-drinkers or drinkers. Exercise frequency was classified into four groups: no regular exercise, exercise 1–2 times per week, 3–4 times per week, and ≥ 5 times per week.
Definition of abnormal lower-extremity function and balance
To assess lower-extremity function and balance in our cohort, we employed two widely recognized physical performance tests. Lower-extremity function was evaluated using the 3-m timed up-and-go (TUG) test, in which participants rose from a standard armchair, walked 3 m at their usual pace, turned around, returned to the chair, and sat down. The time required to complete the sequence was recorded in seconds. Balance was evaluated using the single-leg stance test (SLST), performed with both eyes open and closed, and the duration participants could maintain the stance was recorded. Both TUG and SLST were administered by trained medical staff. According to the NHIS criteria, the lower-extremity function was considered normal if the TUG test time was < 10 seconds. Balance function was considered normal if participants maintained the SLST for > 10 seconds with eyes open or > 6 seconds with eyes closed. The combination of dynamic (TUG) and static (SLST) assessments provided a comprehensive evaluation of physical function, addressing key aspects of mobility and balance essential for daily activities and independence in older adults.
Statistical analysis
Data provided by the NHIS were analyzed using R v.4.3 (R Foundation for Statistical Computing, Vienna, Austria) and SAS (v.9.4; SAS Institute Inc., Cary, NC, USA). Baseline characteristics were presented as means with standard deviations for continuous variables and as numbers with percentages for categorical variables. Group comparisons for continuous and categorical variables were conducted using Student’s t-test and chi-square test, respectively. Multivariable-adjusted logistic regression analysis was performed to examine the associations between CKD, lower-extremity function, and balance. Results were presented as odds ratios (ORs) with 95% confidence intervals (CIs). The regression model was adjusted for severe covariates, including sex, income level, BMI, hemoglobin level, GFR, smoking status, alcohol consumption, exercise frequency, cerebrovascular disease, IHD, and COPD. The level of statistical significance was set at p < 0.05.
RESULTS
Baseline characteristics of the study participants according to eGFR and proteinuria
The baseline characteristics of the 92,719 study participants were analyzed according to eGFR levels calculated using both the MDRD and CKD-EPI equations. Participants were stratified into four groups based on eGFR: Group 1 (eGFR ≥ 90 mL/min/1.73 m2; MDRD: n = 21,213, CKD-EPI: n = 43,095), Group 2 (60 ≤ eGFR < 90 mL/min/1.73 m2; MDRD: n = 62,513, CKD-EPI: n = 45,404), Group 3 (30 ≤ eGFR < 60 mL/min/1.73 m2; MDRD: n = 8,356, CKD-EPI: n = 3,619), and Group 4 (eGFR < 30 mL/min/1.73 m2; MDRD: n = 637, CKD-EPI: n = 601). As presented in Table 1 and Supplementary Table 3, individuals in the groups with lower eGFRs exhibited a significantly higher prevalence of proteinuria and comorbid conditions, including HTN, DM, dyslipidemia, IHD, and CVD. Additionally, the groups with lower eGFRs (Groups 3 and 4) showed elevated systolic blood pressure, fasting blood glucose, and triglyceride levels. Notably, participants in Group 4 exhibited significantly higher rates of physical dysfunction, with abnormal lower-extremity function and balance function being the most prevalent (MDRD: 12.4% and 14.0%, CKD-EPI: 12.5% and 14.1%, respectively). When stratified by proteinuria status (Supplementary Table 4), individuals with proteinuria (n = 2,800) were predominantly male and had higher rates of comorbidities, including HTN, DM, dyslipidemia, IHD, and CVD. These individuals also performed worse on physical assessments, such as the TUG test (normal: 8.1 seconds vs. proteinuria: 8.2 seconds) and SLST (normal: 18.7 seconds vs. proteinuria: 17.2 seconds), indicating greater impairments in lower-extremity function and balance.
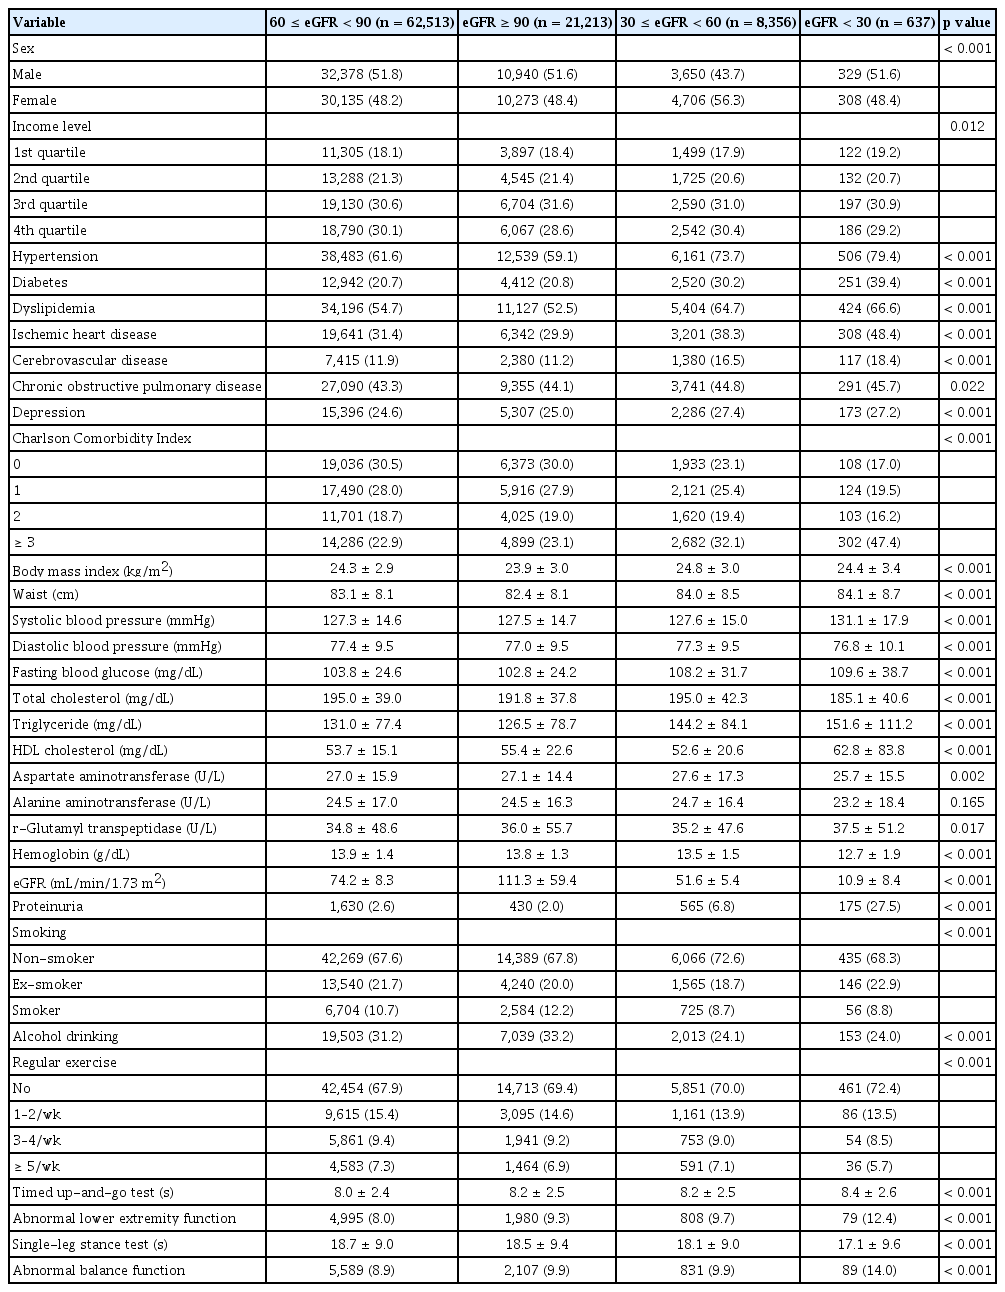
Baseline characteristics of participants stratified by eGFR calculated using MDRD equations
Associations of kidney function and proteinuria with abnormal lower-extremity function
Logistic regression analyses were performed using eGFR values calculated with both the MDRD and CKD-EPI equations to examine the relationship between kidney function and lower-extremity function (Table 2). Using the MDRD equation, Group 2 served as the reference group. Compared to Group 2, participants in Groups 3 (crude OR 1.23, 95% CI 1.14–1.33, p < 0.001) and 4 (crude OR 1.63, 95% CI 1.28–2.05, p < 0.001) showed a significantly higher risk of abnormal lower-extremity function. Notably, participants in Group 1 also exhibited an elevated risk (crude OR 1.19, 95% CI 1.12–1.25, p < 0.001). In multivariable analyses adjusted for potential confounders, higher risks of abnormal lower-extremity function were observed in Groups 1 (adjusted OR 1.19, 95% CI 1.12–1.25, p < 0.001), 3 (adjusted OR 1.12, 95% CI 1.03–1.21, p = 0.005), and 4 (adjusted OR 1.40, 95% CI 1.10–1.78, p = 0.006) compared to Group 2. Analyses based on the CKD-EPI equation yielded similar results. Participants in Group 1 had a significantly increased risk of abnormal lower-extremity function (adjusted OR 1.08, 95% CI 1.03–1.13, p = 0.002), and those in Group 4 exhibited a 40% higher risk (adjusted OR 1.40, 95% CI 1.09–1.79, p = 0.008). However, the adjusted model did not indicate a significant increase in risk for Group 3 (adjusted OR 1.09, 95% CI 0.97–1.23, p = 0.129). Furthermore, a restricted cubic spline curve illustrated a U-shaped association, with eGFR levels between 60–90 mL/min/1.73 m2 associated with the lowest risk of abnormal lower-extremity function (Fig. 2). We also investigated the association between proteinuria and lower-extremity dysfunction. Although univariable analysis showed a significantly increased risk among participants with proteinuria (crude OR 1.17, 95% CI 1.03–1.32, p = 0.017), this association was not significant in the adjusted model (adjusted OR 1.11, 95% CI 0.97–1.26, p = 0.118).
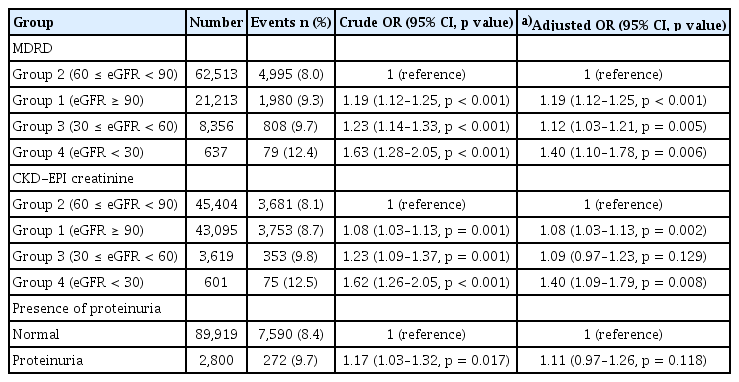
Association of kidney function and proteinuria with abnormal lower extremity function

Restricted cubic spline of odds ratios with 95% confidence intervals for lower-extremity dysfunction. The restricted cubic spline curve depicts the association between the estimated GFR and the odds of abnormal lower-extremity function, as calculated by both the Modification of Diet in Renal Disease (A) and chronic kidney disease Epidemiology Collaboration (B) equations. GFR, glomerular filtration rate.
Associations of kidney function and proteinuria with abnormal lower-extremity balance
We further evaluated the association between kidney function and balance function using both the MDRD and CKD-EPI equations to calculate eGFR (Table 3). Using Group 2 as the reference, participants in Group 4 consistently demonstrated the highest risk of abnormal balance function across both equations. In the MDRD model, Group 4 had a crude OR of 1.65 (95% CI 1.31–2.06, p < 0.001) and an adjusted OR of 1.42 (95% CI 1.13–1.79, p = 0.003). Similarly, in the CKD-EPI model, Group 4 showed a crude OR of 1.72 (95% CI 1.35–2.15, p < 0.001) and an adjusted OR of 1.49 (95% CI 1.18–1.89, p < 0.001). Group 3 also exhibited higher crude odds in both models (MDRD OR 1.12, 95% CI 1.04–1.21, p = 0.003; CKD-EPI OR 1.23, 95% CI 1.10–1.37, p < 0.001), although these associations became non-significant after adjustment (MDRD adjusted OR 1.01, 95% CI 0.94–1.09, p = 0.773; CKD-EPI adjusted OR 1.09, 95% CI 0.97–1.22, p = 0.153). Notably, participants in Group 1 demonstrated a significantly increased risk of impaired lower-extremity balance across both models post-adjustment (MDRD adjusted OR 1.13, 95% CI 1.07–1.19, p < 0.001; CKD-EPI adjusted OR 1.12, 95% CI 1.07–1.18, p < 0.001). Restricted cubic spline analysis (Fig. 3) revealed a U-shaped association between eGFR and abnormal lower-extremity balance, with the lowest risk observed in Group 2, consistent with the pattern observed for abnormal lower-extremity function. Additionally, proteinuria correlated significantly with a higher risk of balance impairment, with participants exhibiting proteinuria showing a crude OR of 1.45 (95% CI 1.29–1.62, p < 0.001) and an adjusted OR of 1.35 (95% CI 1.20–1.51, p < 0.001).
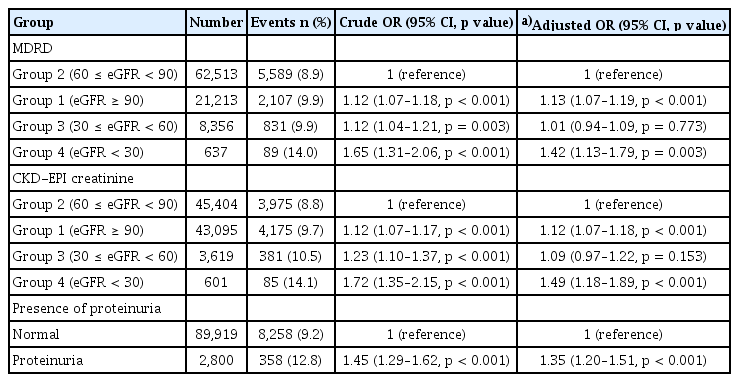
Association of kidney function and proteinuria with abnormal balance function

Restricted cubic spline of odds ratios with 95% confidence intervals for lower-extremity balance. The restricted cubic spline curve illustrates the relationship between the estimated GFR and the odds of abnormal lower-extremity balance, analyzed with the Modification of Diet in Renal Disease (A) and chronic kidney disease Epidemiology Collaboration (B) equations. GFR, glomerular filtration rate.
Subgroup analysis of the associations between kidney function, proteinuria, and lower-extremity dysfunction stratified by sex
Subgroup analyses stratified by sex were conducted to examine the relationships between kidney function, proteinuria, and abnormalities in lower-extremity function and balance (Fig. 4). For abnormal lower-extremity function (Fig. 4A), male participants in Group 4 had a higher risk (OR 1.28, 95% CI 0.87–1.82) compared to those in Group 2 (reference), while female participants in Group 4 demonstrated a significant association (OR 1.51, 95% CI 1.08–2.05). Notably, Group 1 was significantly associated with impaired lower-extremity function in both sexes (male OR 1.13, 95% CI 1.04–1.23; female OR 1.22, 95% CI 1.14–1.32). Regarding abnormal lower-extremity balance (Fig. 4B), males in Group 4 had a significantly elevated risk of balance dysfunction (OR 1.45, 95% CI 1.03–2.00), with females showing a comparable association (OR 1.39, 95% CI 1.00–1.89). Additionally, Group 1 was significantly linked to abnormal lower-extremity balance in both male and female participants. Moreover, the prevalence of proteinuria was associated with a significantly higher risk of abnormal balance (OR 1.24, 95% CI 1.05–1.45), as was the female sex (OR 1.49, 95% CI 1.26–1.75).

Subgroup analysis of the association between GFR and abnormal lower-extremity function and between GFR and abnormal balance, stratified by sex. Forest plots showing ORs for abnormal lower-extremity function (A) and balance (B) stratified by sex. The ORs and 95% confidence intervals were calculated using multivariable logistic regression analysis. The ORs and 95% confidence intervals were calculated using multivariable logistic regression analysis, adjusted for income level, body mass index, hemoglobin level, smoking status, alcohol consumption, regular exercise status, hypertension, diabetes, dyslipidemia, ischemic heart disease, cerebrovascular disease, chronic obstructive pulmonary disease, depression, and the Charlson Comorbidity Index. OR, odds ratio; CI, confidence interval; MDRD, Modification of Diet in Renal Disease; GFR, glomerular filtration rate.
DISCUSSION
In this study, we identified a significant association between kidney function and lower-extremity dysfunction, as well as a correlation between lower-extremity dysfunction and proteinuria. Using participants with eGFRs between 60–89 mL/ min/1.73 m2 as the reference group, we found that those with reduced renal function (eGFR < 60 mL/min/1.73 m2) had a significantly increased risk of abnormal lower-extremity function. Notably, participants with elevated eGFRs (≥ 90 mL/min/1.73 m2) also exhibited an increased risk of lower-extremity dysfunction compared to the reference group, suggesting a U-shaped relationship between renal function and physical performance. Additionally, proteinuria was independently associated with lower-extremity dysfunction, particularly impairments in balance. CKD is known to be closely linked with various comorbidities, including DM, HTN, and CVDs, all of which contribute to complications such as peripheral artery disease and increased arterial stiffness [21,22].
Previous studies have explored the relationship between eGFR and muscle strength, indicating that CKD is linked to muscle wasting and weakness, potentially mediated by factors such as nutritional deficiencies, uremic toxins, inflammation, and metabolic acidosis [23,24]. Consistent with these findings, we observed that participants in Group 4 (eGFR < 30 mL/min/1.73 m2) had a high prevalence of comorbidities, including HTN, DM, dyslipidemia, and IHD (Table 1), along with a significantly increased risk of lower-extremity dysfunction (Tables 2, 3).
Notably, although patients in Group 1 (eGFR ≥ 90 mL/min/1.73 m2) exhibited fewer comorbidities, such as HTN, DM, dyslipidemia, and IHD (Table 1), they also exhibited an increased risk of lower-extremity dysfunction compared to those in Group 2 (Tables 2, 3). Several potential mechanisms can explain this paradoxical finding. First, an elevated eGFR may reflect reduced muscle mass, as creatinine production is directly proportional to muscle mass [25,26]. Lower muscle mass results in decreased creatinine production, leading to an overestimation of eGFR. Therefore, in individuals with high creatinine-based eGFR (eGFR ≥ 90 mL/min/1.73 m2), it is important to assess lower-extremity function, promote lower extremity strengthening exercises, and consider using cystatin C-based eGFR for a more precise assessment of renal function. Although muscle mass was not directly measured in this study, Group 1 participants had the lowest BMI among all groups (Table 1), supporting this hypothesis. Second, elevated eGFR may indicate glomerular hyperfiltration, an early marker of kidney dysfunction that can precede overt kidney disease [27,28]. Hyperfiltration is frequently observed in individuals with sarcopenia and has been linked to increased arterial stiffness and elevated cardiovascular risk [25,29].
Our analysis revealed an interesting discrepancy between the MDRD and CKD-EPI equations in assessing CKD stage 3 (eGFR 30–60 mL/min/1.73 m2). Using the MDRD equation, we observed a significant association between moderate CKD and lower-extremity dysfunction, while the CKD-EPI equation showed no significant association at this stage (Table 2). The MDRD formula generally produces lower eGFR estimates than the CKD-EPI equation at moderate levels of kidney function [20], potentially making it more sensitive for detecting individuals at risk of physical impairment. In contrast, the CKD-EPI equation is regarded as more accurate at higher eGFR levels and has demonstrated superior performance across most subgroups, offering better risk stratification for CVD and CKD progression [20,30]. As shown in the baseline characteristics (Table 1, Supplementary Table 3), the MDRD-based classification included a larger number of individuals in Group 3 (n = 8,356) compared to the CKD-EPI-based classification (n = 3,619), which may partly explain the stronger associations observed in the MDRD-based analysis. In our study, which primarily involved individuals participating in a health checkup program, this discrepancy may have influenced the sensitivity of each equation in detecting associations with lower-extremity dysfunction. In the sex-stratified subgroup analysis (Fig. 4), females in Group 4 (eGFRs < 30 mL/min/1.73 m2) exhibited a significant association with lower-extremity dysfunction, while no significant association was observed among males in the same group. This finding suggests potential sex-specific vulnerabilities to lower-extremity dysfunction in CKD, possibly due to differences in muscle mass, hormonal factors, or other physiological variations between males and females. Moreover, individuals with proteinuria exhibited a significantly higher risk of abnormal balance function, although the prevalence of proteinuria did not significantly increase the risk of abnormal lower-extremity function overall (Tables 2, 3). Proteinuria, a marker of endothelial dysfunction and microvascular damage [16,31], may specifically impact balance-related neural pathways.
Limitations
This study had some limitations. First, due to its cross-sectional design, we were unable to establish causal relationships between kidney function and lower-extremity dysfunction. Second, although eGFR is a frequently used marker of kidney function, it may not fully reflect the complexity of renal function, particularly in populations with low muscle mass, as creatinine-based eGFR estimates can be influenced by individual variations in muscle mass. Further studies are required to validate these findings using other markers, such as cystatin C, which is less influenced by muscle mass than creatinine [32]. Third, we did not directly measure muscle mass or strength, which could have provided a more comprehensive understanding of the relationship between kidney function and physical performance. Despite these limitations, this study has some notable strengths. First, we analyzed a large sample size, ensuring sufficient statistical power to detect significant associations and enabling detailed subgroup analyses. Second, we employed both the MDRD and CKD-EPI equations for eGFR calculations, enabling a more robust estimation of kidney function. Finally, we conducted detailed stratified analyses based on kidney function and proteinuria while assessing both balance and lower-extremity function.
Conclusions and perspectives
Our study identified a U-shaped relationship between renal function and lower-extremity dysfunction, with both reduced and elevated eGFR levels associated with an increased risk of impairment. Decreased renal function and proteinuria prevalence were linked to a higher risk of lower-extremity and balance dysfunction. These findings suggest that patients with CKD or proteinuria may benefit from regular assessments of lower-extremity function and appropriate interventions, such as exercise programs, to maintain physical performance.
KEY MESSAGE
1. A U-shaped relationship exists between renal function and lower-extremity dysfunction, with both low and elevated eGFR levels linked to increased impairment risk.
2. Proteinuria is independently associated with a higher risk of lower-extremity dysfunction and balance impairment.
3. Regular assessment of lower-extremity function is essential in patients with CKD or proteinuria.
Notes
CRedit authorship contri
Bongjo Kim: methodology, writing - original draft, visualization; Eun-Bin Lim: methodology, writing - original draft; Young Sang Lyu: methodology; Minkook Son: methodology, supervision; Youngmin Yoon: writing - review & editing, supervision, funding acquisition
Conflicts of interest
The authors disclose no conflicts.
Funding
This study was supported by a research fund from Chosun University (2023) and by a grant from the National Research Foundation of Korea, funded by the Korean government (MSIT) (No. RS-2024-00342613).