Enhanced prediction of left ventricular ejection fraction using electrocardiography with the addition of clinical metadata
Article information

Abstract
Background/Aims
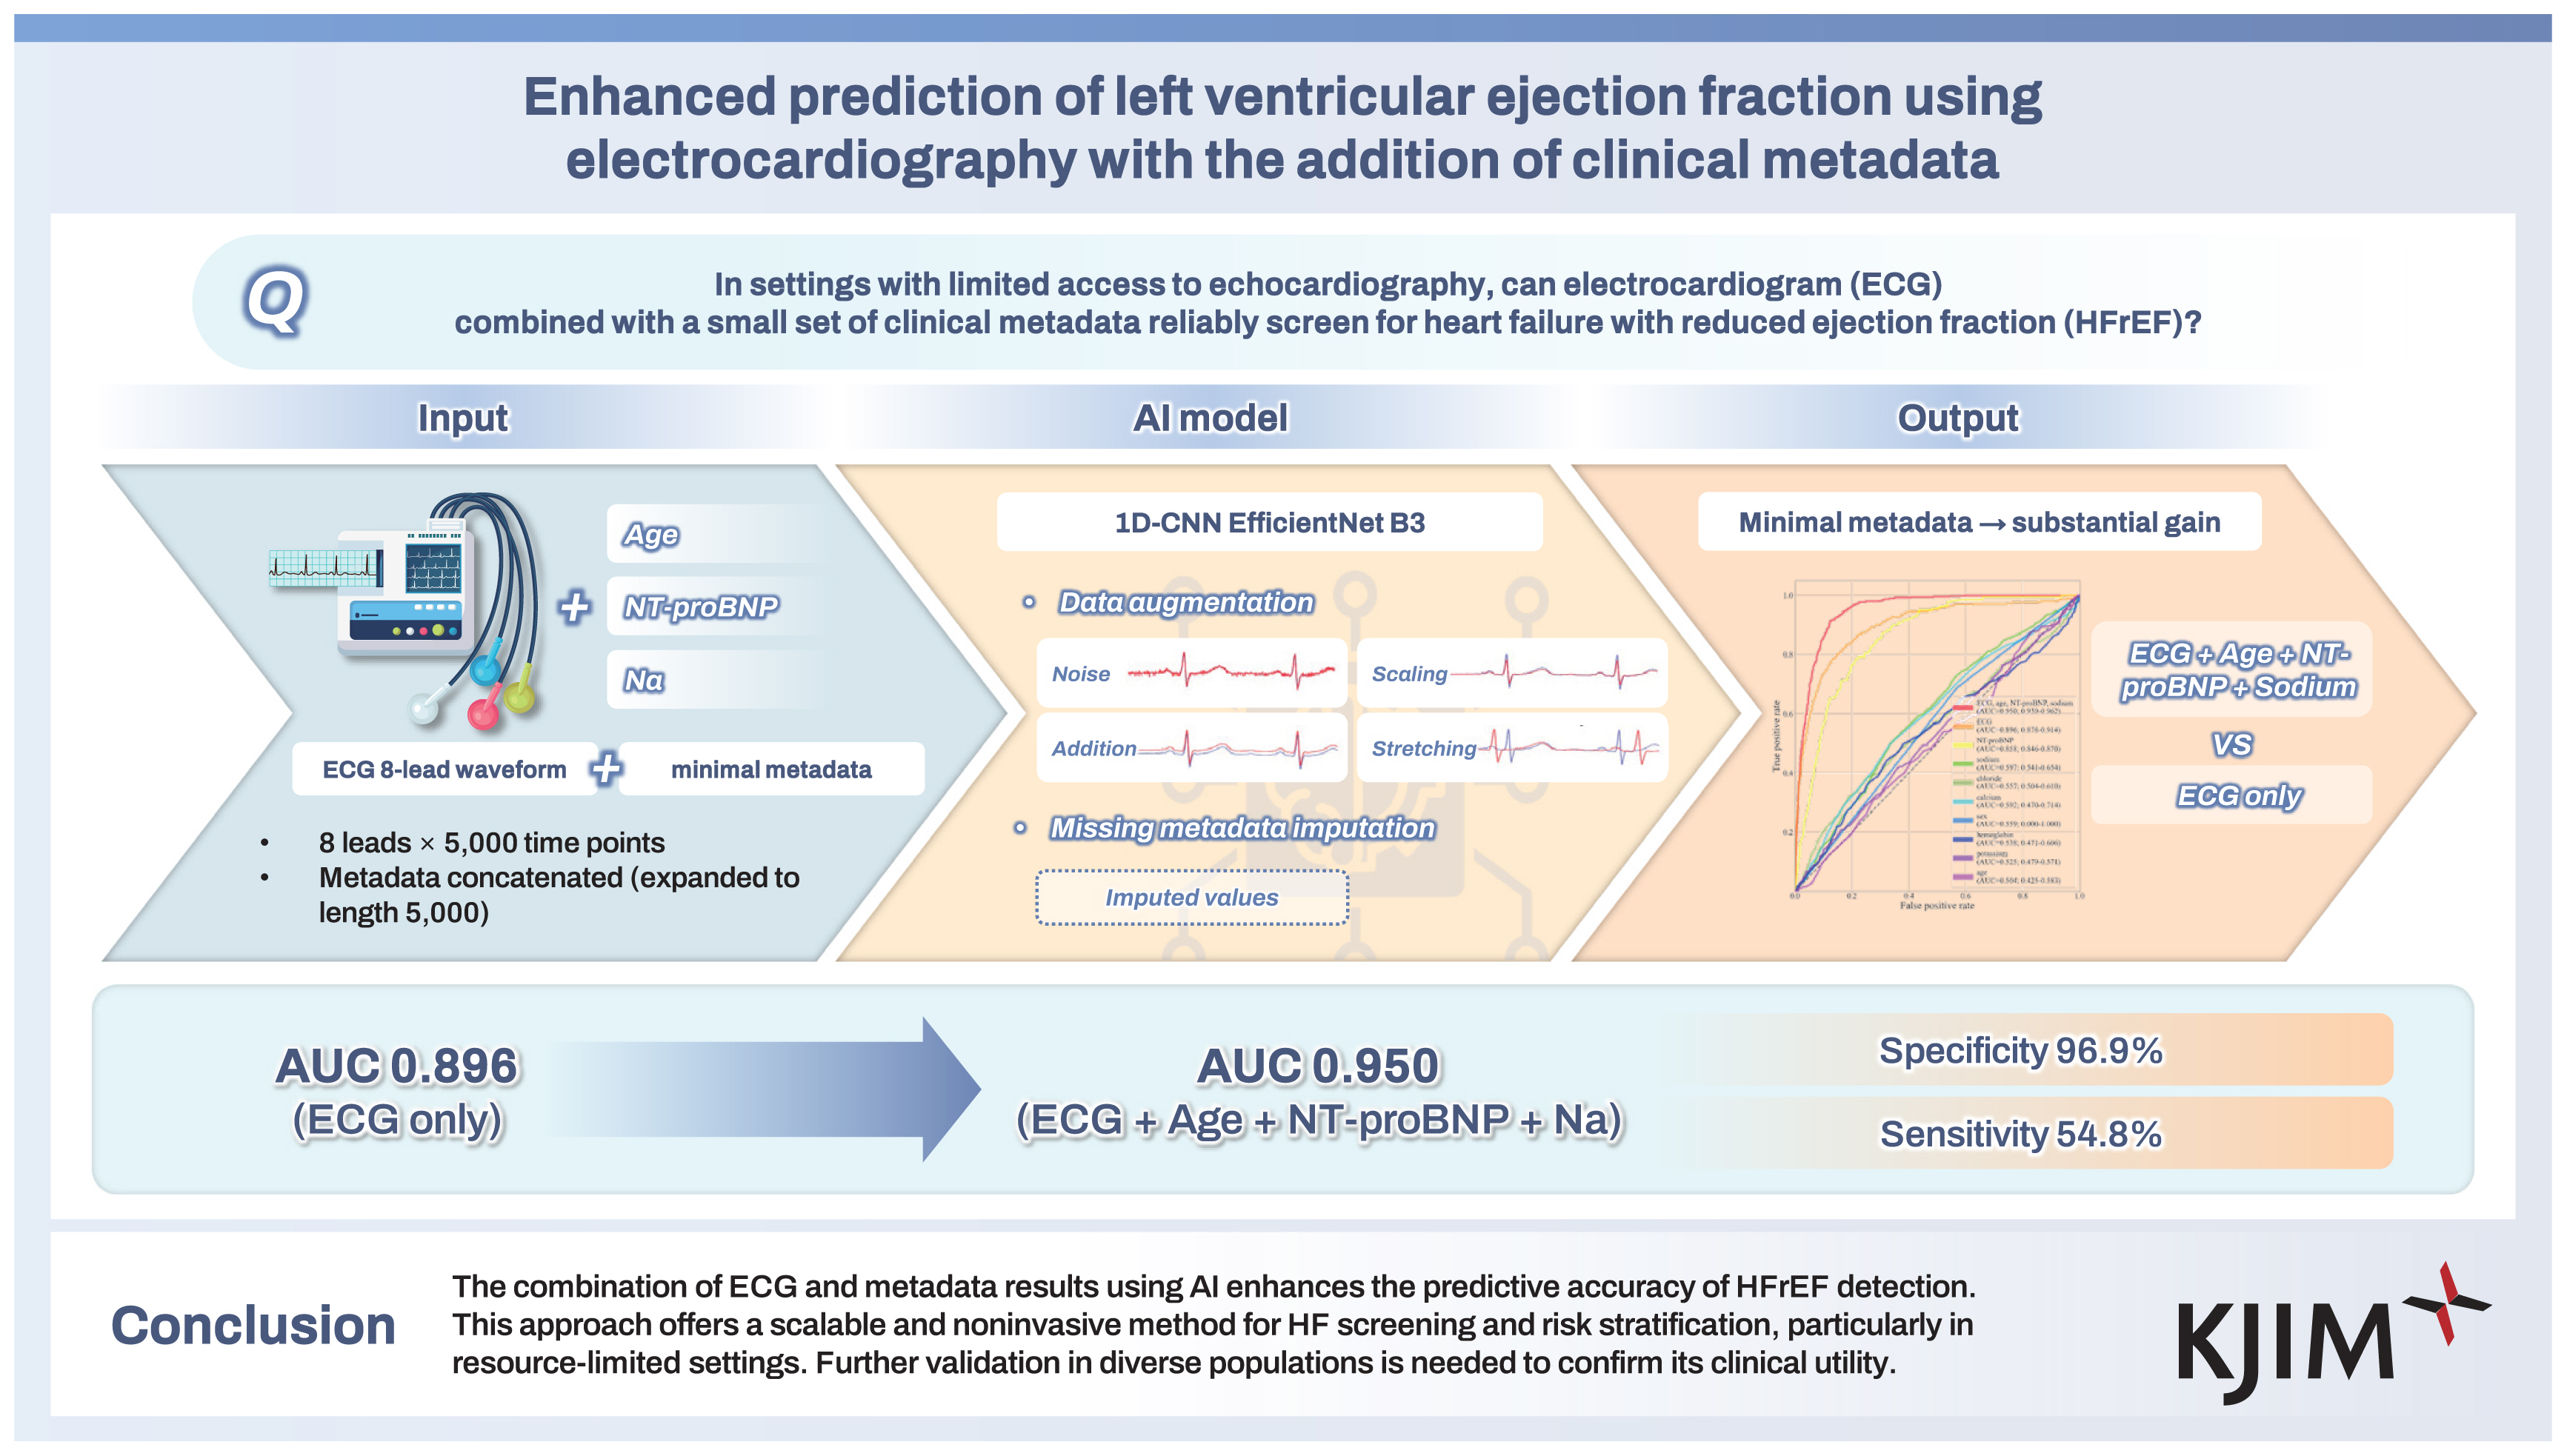
Left ventricular ejection fraction (LVEF) is a key echocardiographic parameter for assessing LV systolic function, guiding the management of many cardiovascular diseases, including heart failure (HF). While traditional electrocardiography (ECG) has been widely used in clinical practice, it has limitations in predicting LVEF. This study investigated the impact of integrating ECG data with metadata, such as age, N-terminal pro B-type natriuretic peptide (NT-proBNP), and sodium levels, to enhance the accuracy of LVEF prediction, especially in HF with reduced ejection fraction (HFrEF, LVEF ≤ 40%).
Methods
This retrospective study analyzed ECG and metadata from two tertiary teaching hospitals in Korea. A deep neural network (EfficientNet B3) was trained to predict LVEF, incorporating clinical metadata alongside ECG inputs. Model performance was assessed using the area under the curve (AUC) and the coefficient of determination (R2).
Results
The artificial intelligence (AI) model achieved an AUC of 0.95 when ECG data were combined with age, NT-proBNP, and sodium levels, outperforming models relying on ECG alone (AUC = 0.90). The integration of metadata significantly improved the prediction accuracy, particularly for HFrEF cases. The specificity of the model remained high (96.9%), but sensitivity was relatively low (54.8%), indicating its potential as a screening tool for HFrEF.
Conclusions
The combination of ECG and metadata results using AI enhances the predictive accuracy of HFrEF detection. This approach offers a scalable and noninvasive method for HF screening and risk stratification, particularly in resource-limited settings. Further validation in diverse populations is needed to confirm its clinical utility.
INTRODUCTION
Heart failure (HF) is a severe global health issue, affecting over 64 million individuals worldwide. Its prevalence is rising due to the aging population and the increasing burden of risk factors such as hypertension and diabetes mellitus. Early diagnosis and effective management are critical not only for improving clinical outcomes across all forms of HF but also for delaying the progression to advanced stages [1,2].
Left ventricular ejection fraction (LVEF) is one of the most widely used echocardiographic parameters to assess LV systolic function and is essential for the diagnosis and management of HF. It also plays a key role in monitoring disease progression, assessing treatment response, and serving as an independent predictor of mortality in HF patients [3–5]. Transthoracic echocardiography (TTE) is required to assess LVEF. However, TTE examinations need trained personnel and echocardiographic equipment, which may not be universally available.
Conversely, the conventional electrocardiogram (ECG) is a widely accessible diagnostic modality due to the affordability and ease of use of the equipment necessary for its execution. Conventional ECG interpretation methods, which prioritize the analysis of prominent waveforms, are constrained in their capacity to discern and incorporate subtle ECG variations into the diagnostic process. Significant ECG abnormalities frequently manifest only after the disease has advanced considerably, impeding the ability to make an early diagnosis. Furthermore, the prediction of LVEF using ECGs has proven to be challenging. However, recent advancements in artificial intelligence (AI) have demonstrated that ECGs possess significantly more diagnostic potential than is currently being exploited. Deep neural networks, a subset of machine learning that utilizes hierarchical structures to extract low-dimensional features from high-dimensional data, have demonstrated considerable potential in enhancing the efficacy of ECG-based diagnostic procedures [6,7].
Convolutional neural networks (CNNs), in particular, excel at capturing complex features and detecting local variations, making them highly efficient with minimal memory requirements. Due to these advantages, numerous studies have leveraged CNNs to extract meaningful features from ECG signals [8–18]. AI-enhanced ECG has demonstrated the ability to predict various clinical parameters, including cardiac function, age, sex, and electrolyte imbalances [19–21]. Moreover, previous studies have shown that AI-ECG models can estimate LVEF with excellent performance [14–18]. However, the potential to improve LVEF prediction accuracy further by integrating clinical metadata into AI-ECG models remains underexplored. It is hypothesized that incorporating these variables could enhance the predictive accuracy of AI-ECG models. Thus, we aimed to expand upon the established capabilities of ECG analysis using deep neural networks by integrating metadata, including age, sex, N-terminal pro B-type natriuretic peptide (NT-proBNP), and electrolyte levels. By combining ECG signals with relevant clinical information, this approach sought to improve the predictive power of AI-ECG models for LVEF estimation and diagnosis of HF with reduced ejection fraction (HFrEF, LVEF ≤ 40%). Ultimately, this research aimed to develop a more accurate and comprehensive tool for the early detection and effective management of HF, addressing the limitations of conventional diagnostic methods.
METHODS
Study design
This retrospective study analyzed data collected from two tertiary hospitals, Hospital A (Chungnam National University Hospital) and Hospital B (Konyang University Hospital), between June 2022 and December 2024. The study was approved by the Institutional Review Board of Chungnam National University Sejong Hospital (CNUSH IRB number 2023-08-004) and conducted in accordance with the principles outlined in the Declaration of Helsinki. For this retrospective study, the requirement for informed consent was waived by the institutional review board due to the use of de-identified patient data.
Dataset
To distinguish between training and evaluation datasets, data from Hospital A were used for training and validation, while data from Hospital B were designated as the test dataset. The inclusion criteria for Hospital A required that LVEF measurements via TTE were performed within seven days of the ECG test. For Hospital B, cases were included if LVEF and laboratory values—serum sodium, chloride, potassium, calcium, NT-proBNP, and hemoglobin—were measured within seven days of an ECG test. To prevent data overlap, patients who visited both Hospital A and Hospital B were included only in the training dataset and excluded from the evaluation dataset.
Missing blood test results within the seven-day window were treated as missing values in the training and validation datasets. Missing metadata were imputed using a deep neural network trained on ECG data and available metadata from Hospital A (Fig. 1) [22].
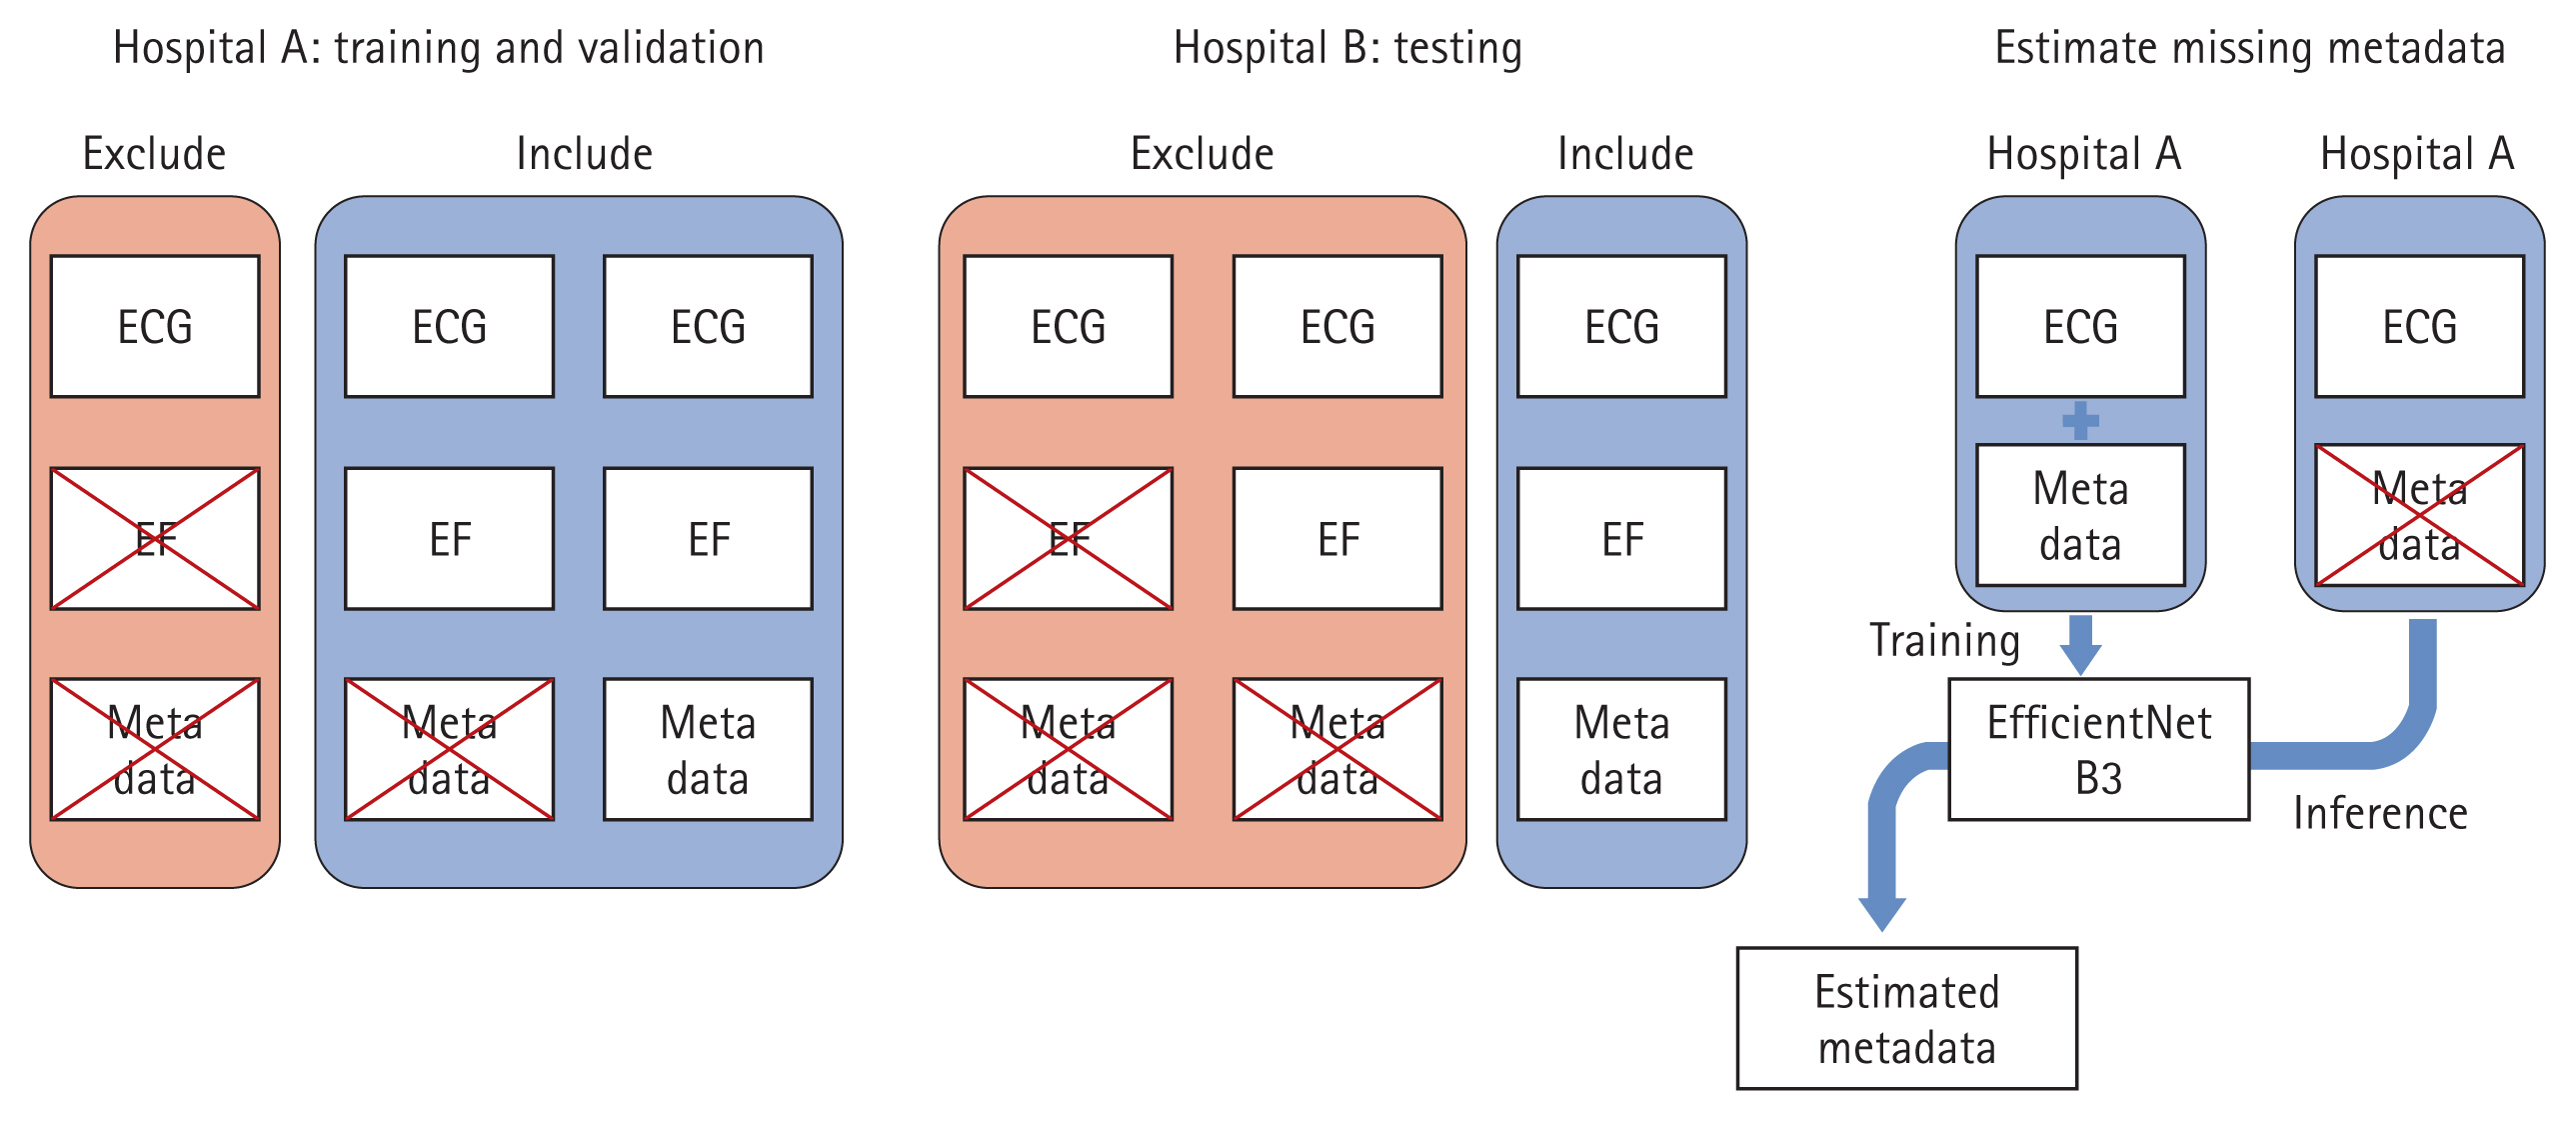
Dataset configuration. The training and validation datasets were obtained from Hospital A, while the test dataset was derived from Hospital B. For inclusion in the training and validation datasets, cases were required to have their EF measured within seven days of an ECG test. In contrast, the test dataset required that EF, along with serum sodium, chloride, potassium, calcium, NT-proBNP, and hemoglobin, be measured within seven days of an ECG test. Since the dataset from Hospital A contained missing metadata, a deep neural network based on EfficientNet B3 was employed to impute the missing values. This model was trained using ECG signals and the available metadata from Hospital A, ensuring that the imputed values remained consistent with the dataset’s overall characteristics. EF, ejection fraction; ECG, electrocardiogram; NT-proBNP, N-terminal pro B-type natriuretic peptide.
Among the metadata, serum sodium, chloride, potassium, calcium, and hemoglobin levels were standardized using the mean and standard deviation from Hospital A. NT-proBNP values were log-transformed before standardization, following the same mean and standard deviation normalization approach. After standardization, these variables had a mean of 0 and a standard deviation of 1. Age and sex information were embedded in the ECG XML files. Age was normalized by dividing by 100, resulting in a range between 0 and 1, while sex was coded as 1 for males and 0 for females.
ECG data from both hospitals were stored in the MUSE™ Cardiology Information System (GE Healthcare, Salt Lake City, UT, USA). ECGs were recorded at 500 Hz over a 10-second interval using the MUSE™ system, with voltage measurements stored as integers ranging from −32,000 to +32,000. Only leads I, II, V1, V2, V3, V4, V5, and V6 were analyzed, while leads III, aVR, aVL, and aVF were excluded.
Echocardiographic data
TTE examinations were performed by expert cardiologists and sonographers using commercially available echocardiographic machines, and all echocardiographic images were stored in an electronic database. LVEF was measured by the modified Simpson’s method using apical 4-chamber and 2-chamber views. We gathered a unique identifier for the patient, date, time, and LVEF value as an integer, and a total of 54,829 echocardiographic reports from 42,182 patients were collected. We defined HFrEF as an LVEF ≤ 40% [23].
Preprocessing of ECG
ECG signals from leads were recorded simultaneously over time, allowing each lead to be treated as a separate channel, as described in previous ECG studies. Consequently, the ECG dataset was structured as a one-dimensional time-series dataset with eight channels and 5,000 measurements.
In the full dataset, the mean ECG voltage was 1.28, with a standard deviation of 68.48. To standardize the data, values were divided by 26 (approximately 64), resulting in an adjusted mean voltage of 0.02 and a standard deviation of 1.07.
To enhance the robustness of training data, ECG augmentation techniques were applied using graphics processing units with hyperparameters optimized through multiple configurations. The augmentation process involved:
Adding Gaussian noise with a mean of 0 and a standard deviation of 0.04.
• Adding a single value sampled from a distribution with a mean of 0 and a standard deviation of 0.04 uniformly across an entire batch.
• Applying scaling by multiplying a single value sampled from a normal distribution with a mean of 1 and a standard deviation of 0.1 across the batch.
• Performing stretching by sampling a value from a normal distribution with a mean of 0 and a standard deviation of 0.06, converting it to a positive value, adding 1 to determine the stretching ratio, and applying it to the data.
• Random cropping of segments to create datasets with a final batch size of × 8 × 5,000.
Combination of ECG and metadata
In this study, demographic (age and sex) and laboratory (serum sodium, potassium, chloride, calcium, NT-proBNP, and hemoglobin) data were incorporated as metadata to improve LVEF prediction (Fig. 2). A tensor combining ECG signals and metadata was used as input for the deep neural network.
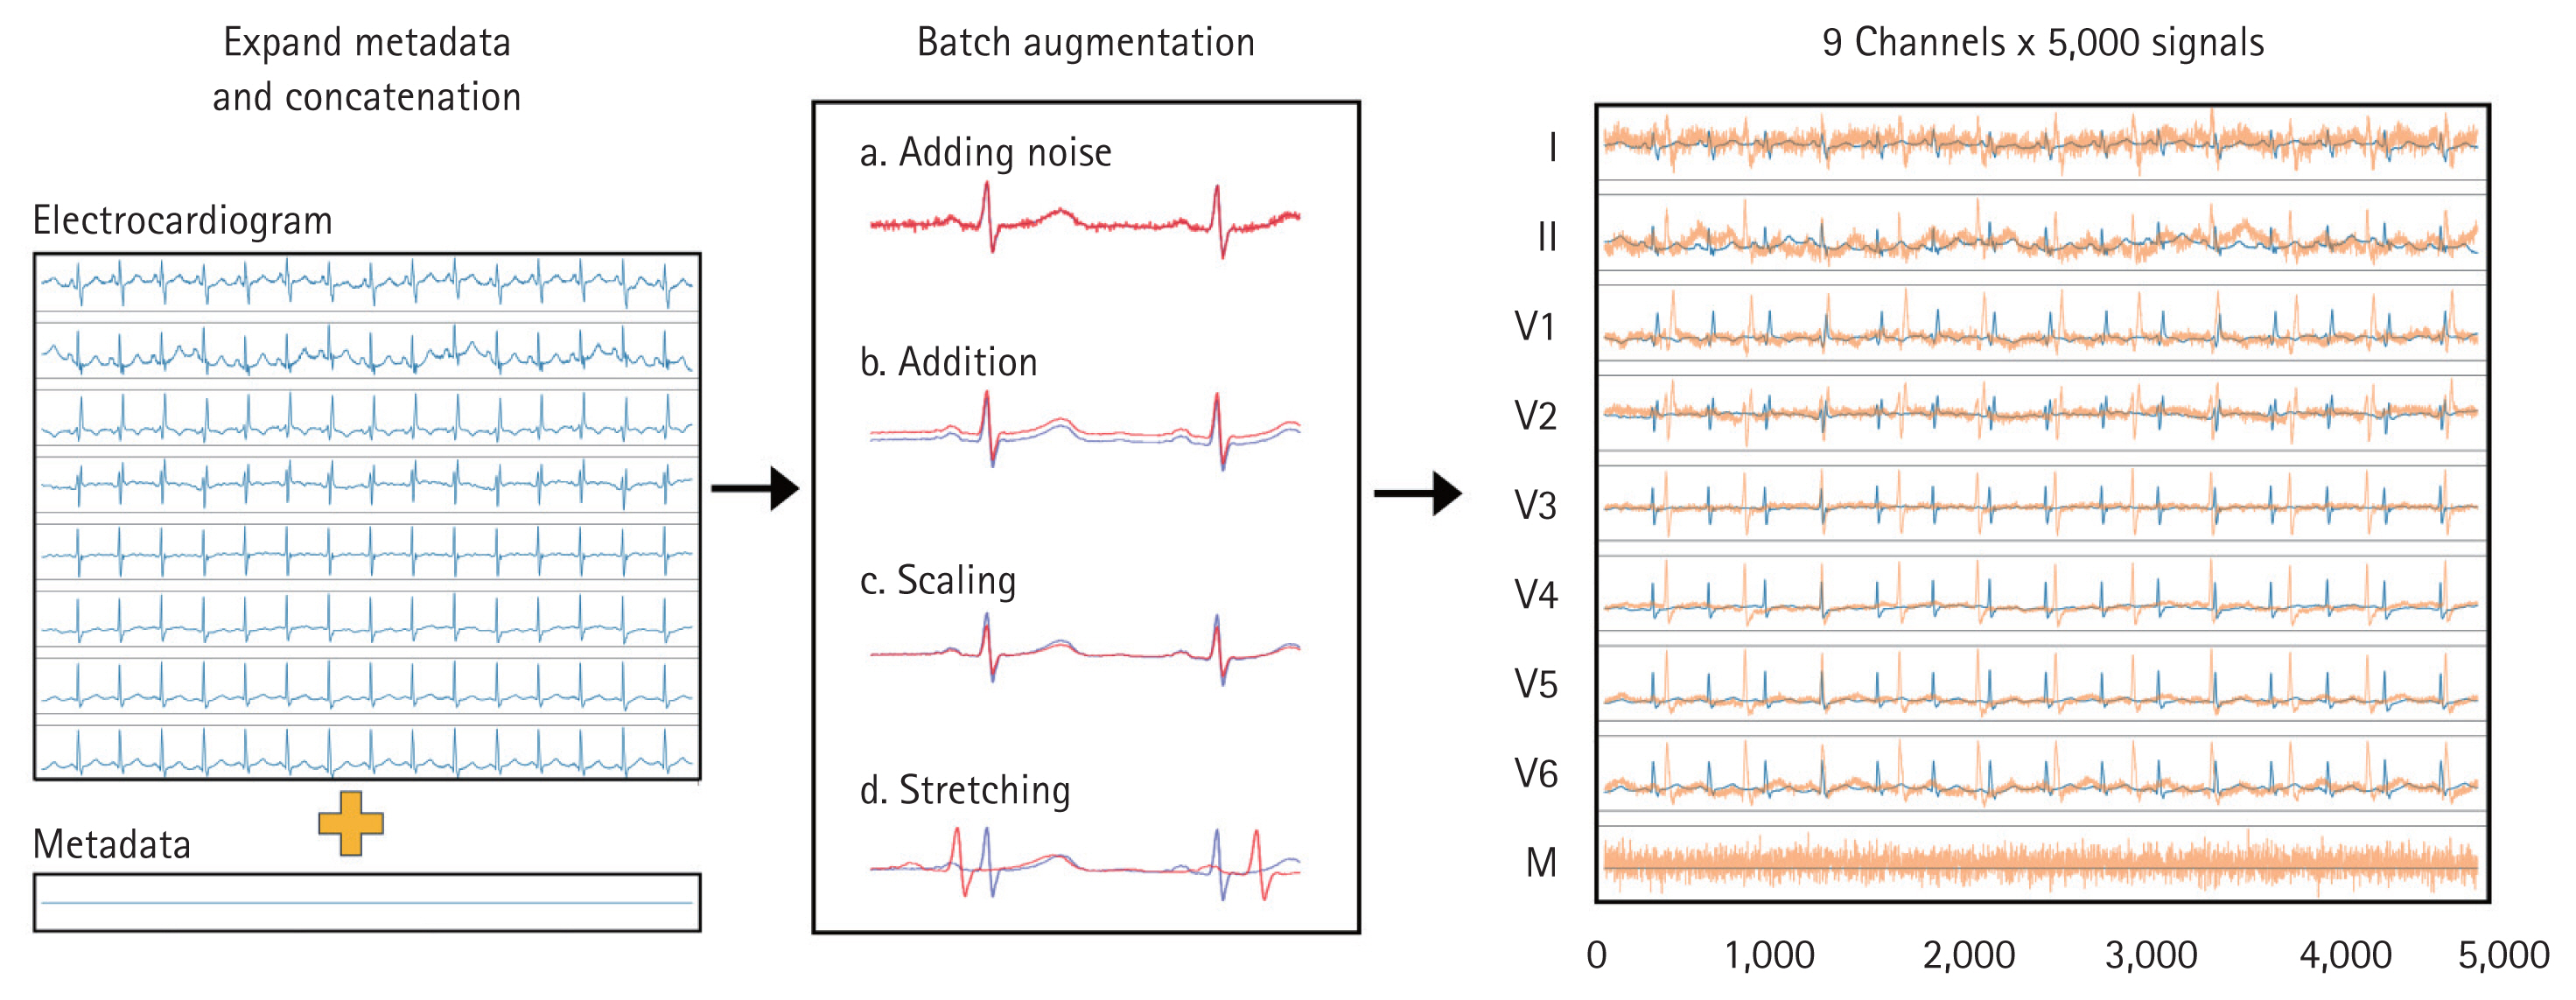
ECG augmentation and metadata concatenation. To generate input data, eight time-series ECG signals (leads I, II, V1–V6) and one metadata variable (M) were used, resulting in a final data size of 9 channels × 5,000 signals. The metadata variable was expanded to match the length of the ECG signals and concatenated with the augmented ECG data to create the final input. To enhance data variability and robustness, several augmentation techniques were applied to the ECG signals. Gaussian noise was introduced to simulate real-world signal variations, while a constant value was uniformly added across all signals in a batch. Additionally, a scaling factor was applied to modify the amplitude of the ECG signals, and stretching was performed by modifying the time axis, followed by random cropping and expansion at a specific ratio. The rightmost section of the figure visually represents these augmentations, where the original ECG signals are shown in blue, and the augmented signals are displayed in orange. ECG, electrocardiogram.
To integrate the metadata into the model, the metadata matrix (originally structured as batch size × number of metadata) was expanded to batch size × number of metadata × 5,000. These expanded metadata were then combined with the ECG data, resulting in an input shape of batch size × (8 + number of metadata) × 5,000.
CNN model
The CNN model was based on the ResNet-101 and Efficient-Net B3 architectures, reconfigured into a one-dimensional convolutional model (Supplementary Data). The encoding method employed Ensemble Probabilistic Quantization, inspired by histogram loss, to distribute each ejection fraction value across 15 classes in a normal distribution (Fig. 3A). All trainable variables were initialized using Gaussian distributions.
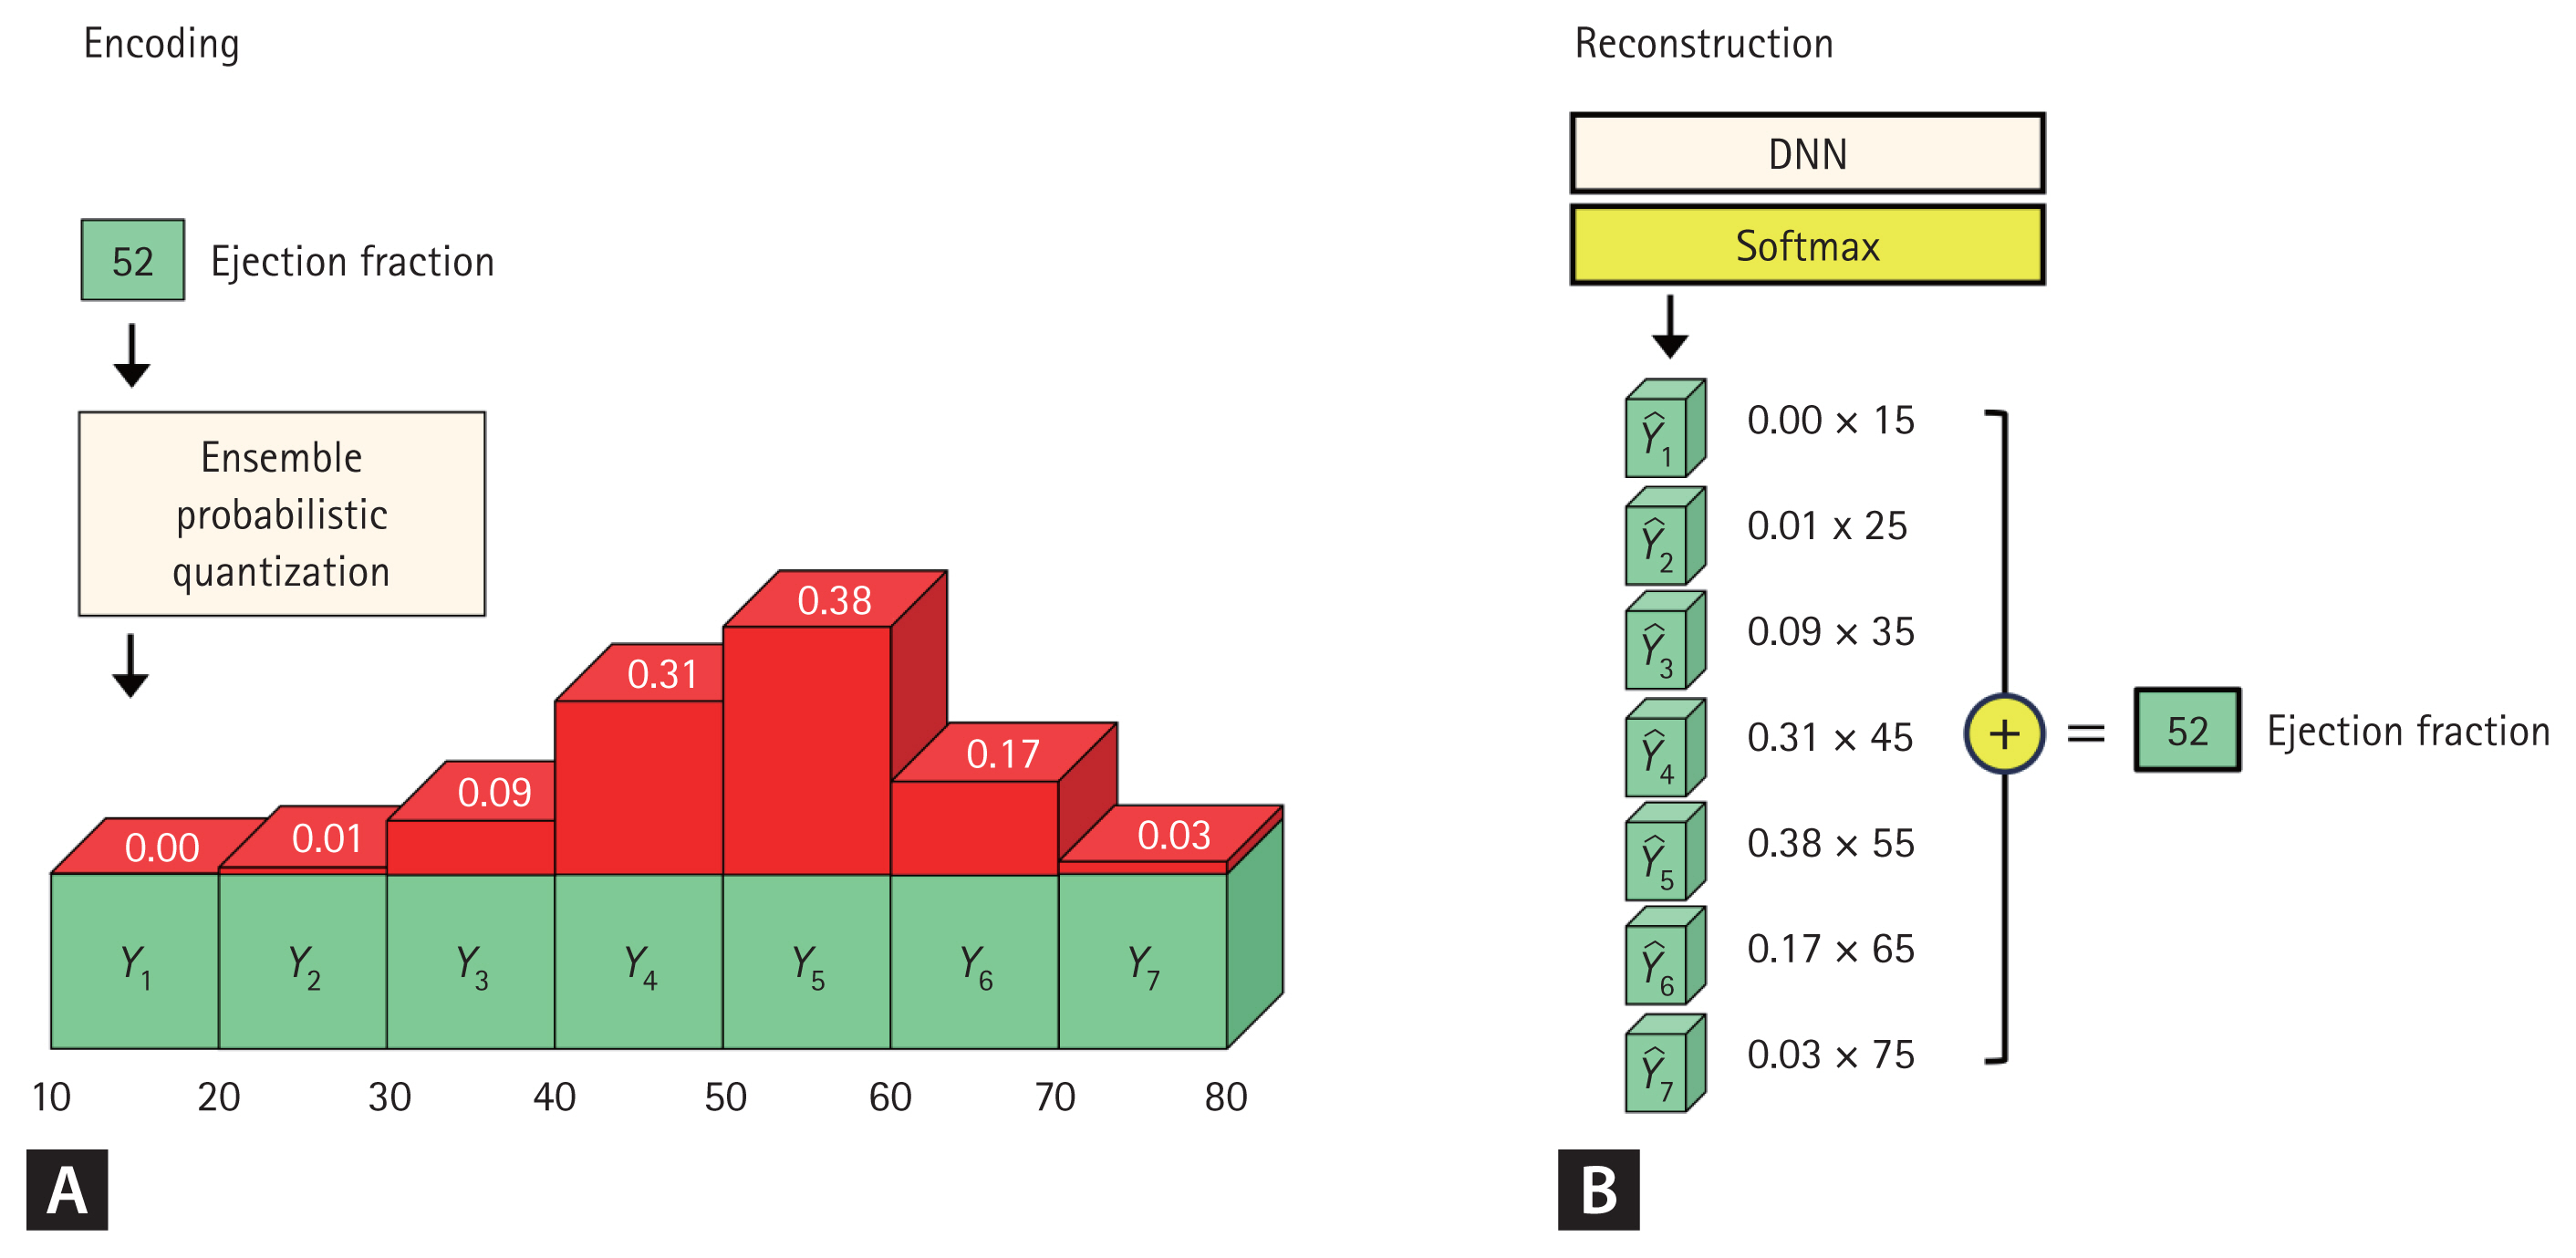
Encoding and reconstruction method. For visualization purposes, EF values were categorized into seven classes, each representing 10-unit intervals (A). The Ensemble Probability Quantization method was used to assign probabilities to each class based on a probability density function. For example, when the EF was 52, the difference between 52 and the expected value of each class (e.g., 15, 25, 35…75) was calculated (B). This difference was then divided by the interval (10) and input into a normal probability distribution, which assigned probability values to each class. Once the softmax function was applied, the final EF value was reconstructed by multiplying the probability of each class by its corresponding expected value and summing the resulting products. This approach enabled the model to accurately estimate continuous EF values while maintaining a structured probability distribution. EF, ejection fraction; DNN, deep neural network.
Several hyperparameters were evaluated to optimize batch size, number of epochs, and learning rate for maximum accuracy. The final model configuration included:
• Batch size: 25
• Epochs: 100
• Learning rate: 0.002
• Optimizer: Adam
The training process utilized the BCEWithLogitsLoss function as the loss criterion. Outputs were processed using the softmax function and then reconstructed (Fig. 3B).
Software
Python (version 3.10.9) was used in this study. The CNN model comprised torch 2.0.0+cu117, torchvision 0.15.1, OpenCV 4.7.0.72, and NumPy 1.23.5. The central processing unit used to train the CNN model was an Intel® Core™ i9-10980XE system (Intel Corp., Santa Clara, CA, USA), equipped with a GeForce RTX 6000 Ada graphics card (Nvidia Corp., Santa Clara, CA, USA). Statistical significance was defined as p < 0.05.
RESULTS
Baseline characteristics
Between June 2022 and December 2024, a total of 157,686 ECG data were recorded at Hospital A, and 23,514 ECGs were recorded at Hospital B. Cases without echocardiography performed within seven days of the ECG were excluded, resulting in the removal of 130,099 cases from Hospital A and 11,956 cases from Hospital B. Additionally, 5,743 cases from Hospital B were excluded due to missing metadata. Ultimately, 27,587 cases from Hospital A and 6,213 cases from Hospital B were included in the study. Among the Hospital A dataset, 24,829 cases (90.0%) were allocated to the training dataset, while 2,758 cases (10.0%) were used as the validation dataset.
At Hospital A, the mean age of patients was 68.53 ± 14.03 years, with 56.6% being male, and the mean LVEF was 55.59%. The proportion of missing metadata ranged from 17.2% to 42.5%, with the highest number of missing data points observed for NT-proBNP levels. After imputing the missing metadata using a deep neural network, significant differences were noted in potassium, hemoglobin, and NT-proBNP levels, whereas sodium, chloride, and calcium levels did not show statistically significant differences. At Hospital B, the mean patient age was 66.65 ± 15.84 years, with 58.2% being male, and the mean LVEF was 56.11%. When comparing the post-imputation dataset from Hospital A to Hospital B, significant differences were observed in all parameters except for chloride levels (Table 1).
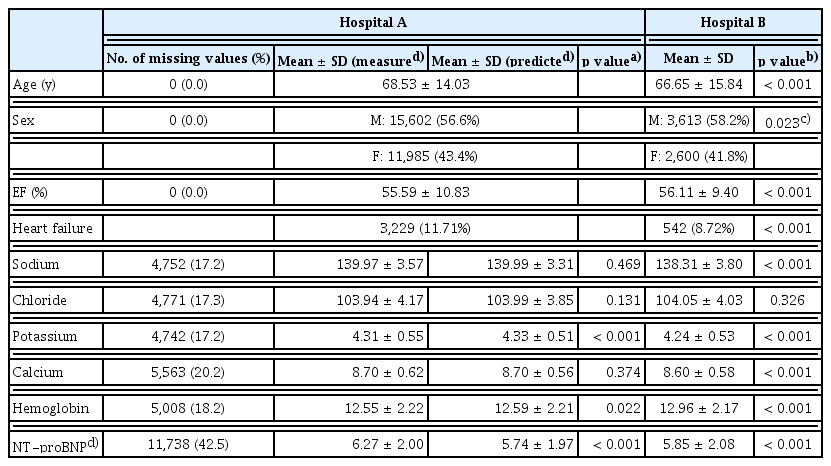
Demographics of the study participants and metadata
Estimation of metadata using ECG and EfficientNet
To estimate missing metadata, a deep neural network (EfficientNet B3) was trained using ECG data from Hospital A. The model was validated using data from Hospital B, with results presented as a scatter plot in Figure 4.
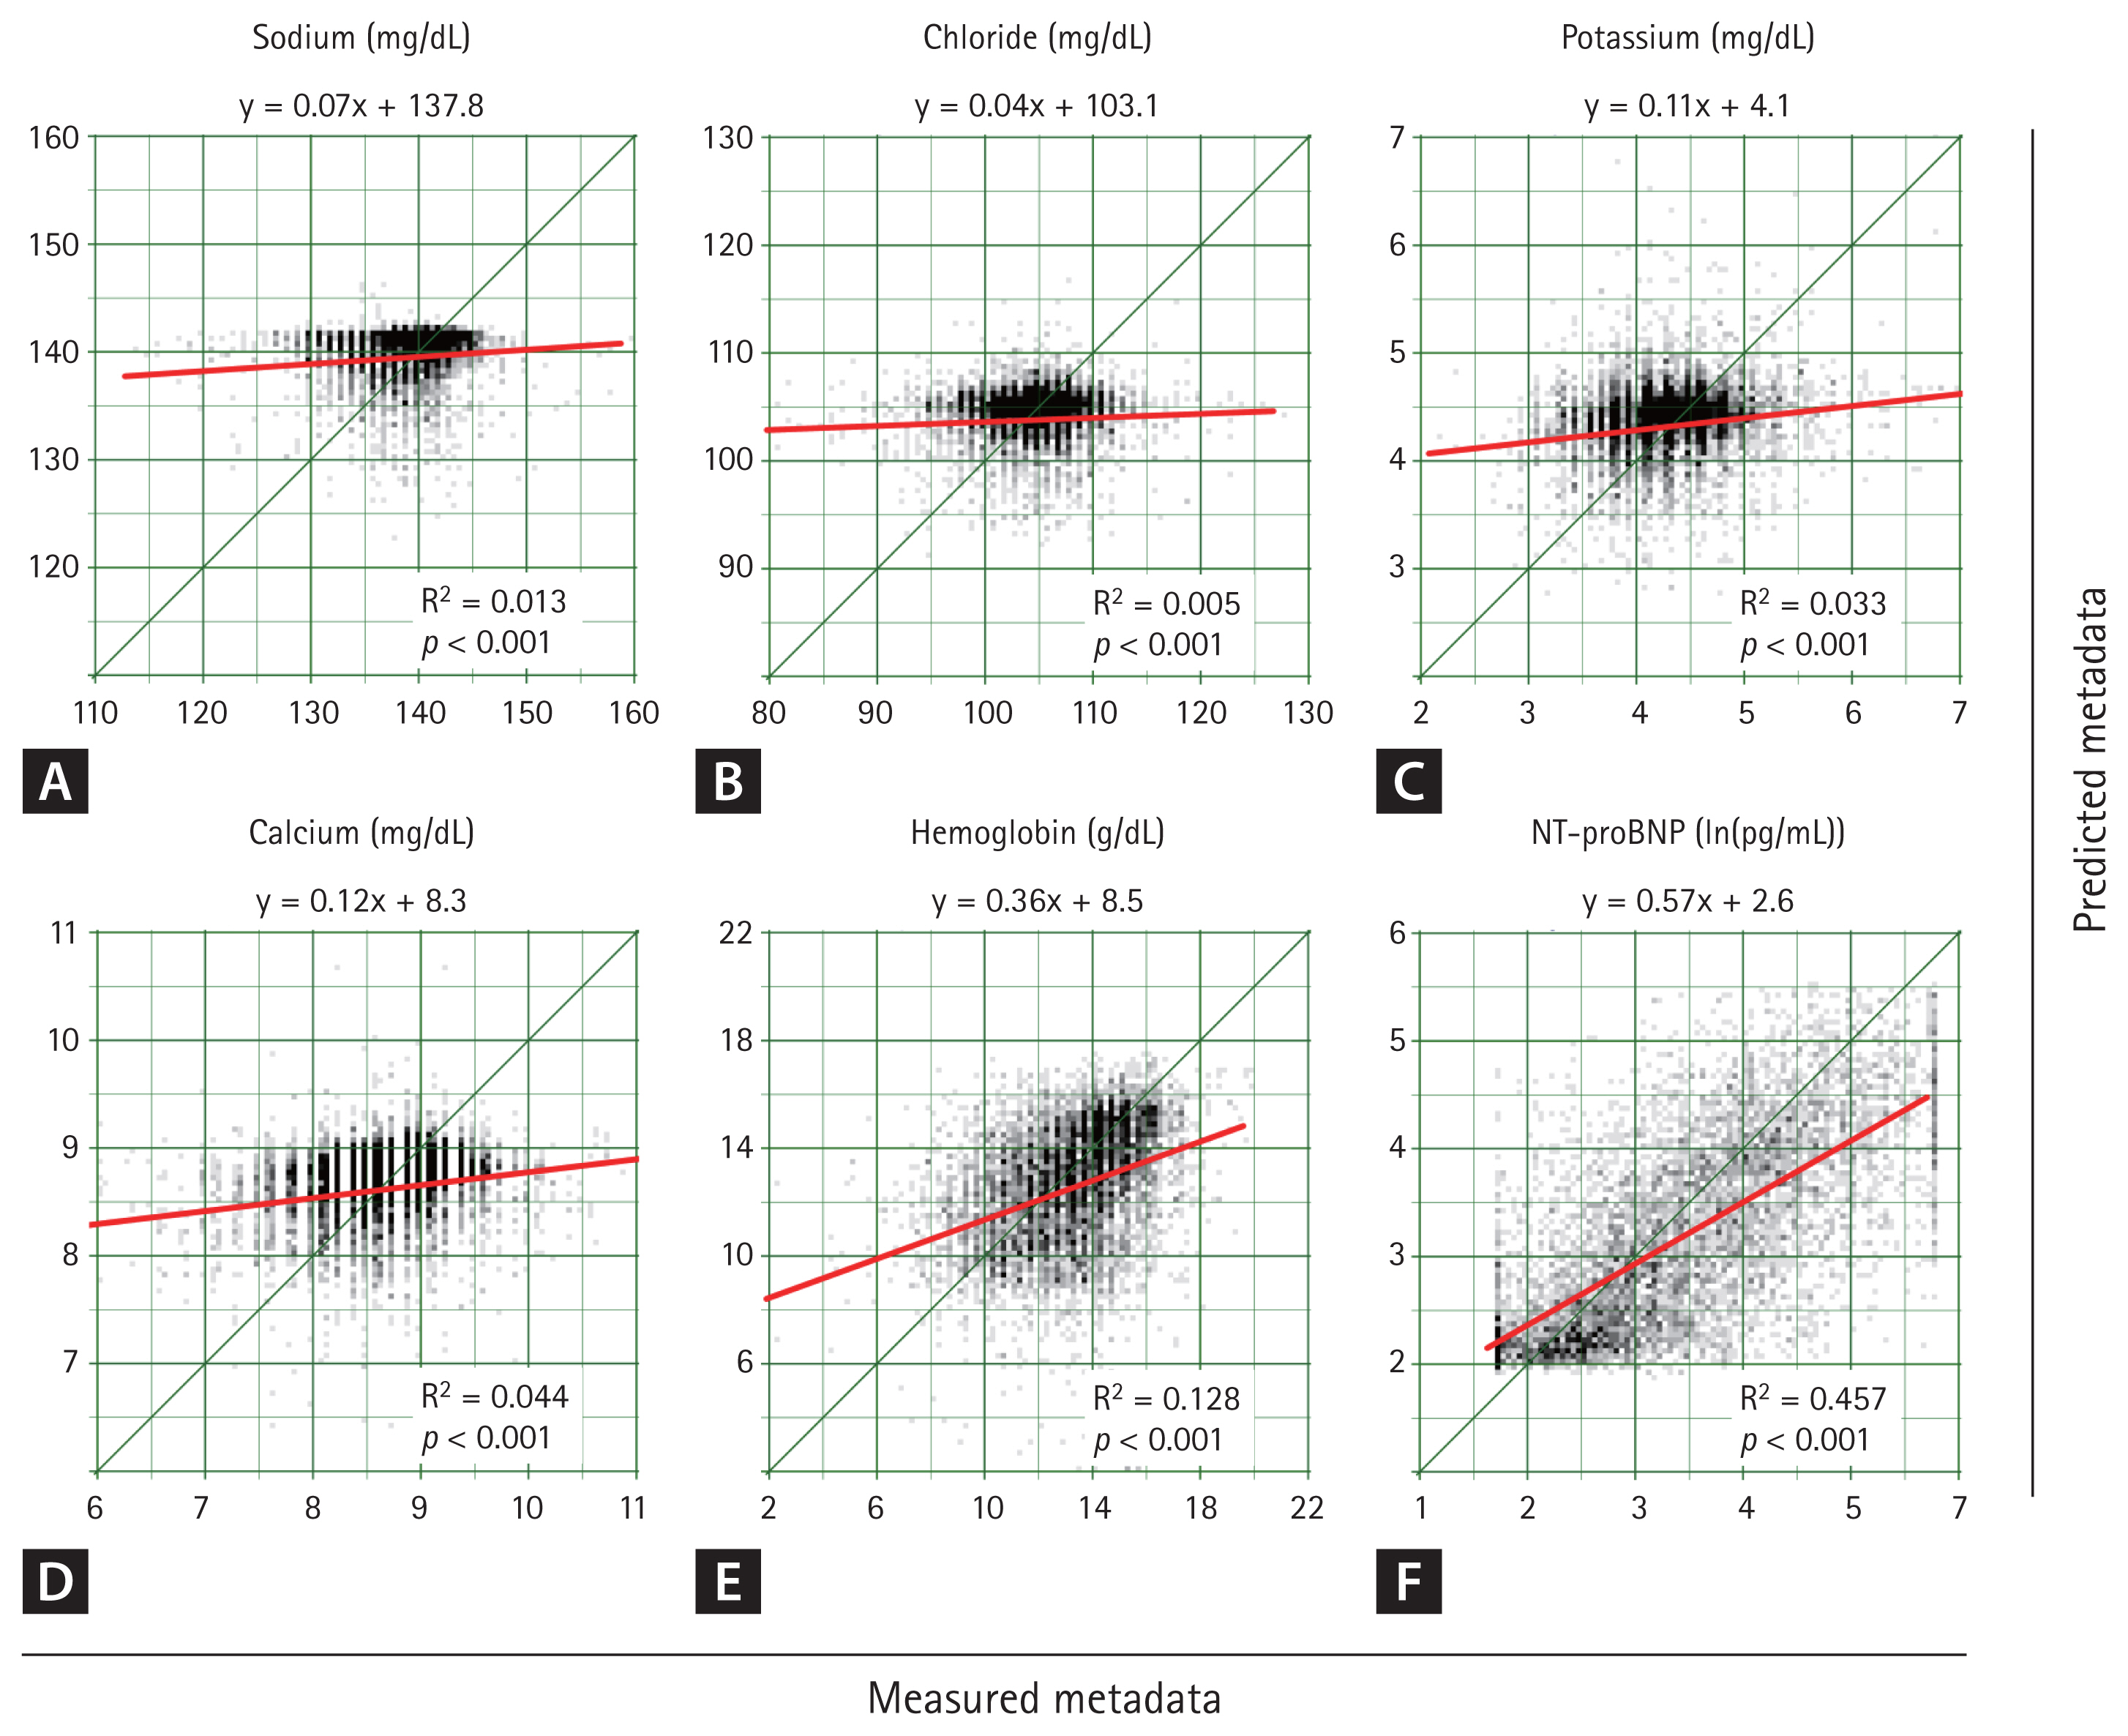
Scatter plot of metadata estimation models. The deep neural network was trained using data from Hospital A, and its predictive accuracy was evaluated using data from Hospital B. Among all the metadata variables, NT-proBNP demonstrated the highest predictive accuracy, with an R2 value of 0.457. The predictive performance progressively increased for sodium (A), cholride (B), potassium (C), calcium (D), hemoglobin (E), and NT-proBNP (F). However, for all variables, the null hypothesis of a slope equal to zero in the linear regression was significantly rejected, indicating that the ECG-based deep learning model effectively captured meaningful clinical correlations. NT-proBNP, N-terminal pro b-type natriuretic peptide; R2: coefficient of determination; ECG, electrocardiogram.
Among the variables, NT-proBNP demonstrated the highest predictive accuracy, with a coefficient of determination (R2) of 0.457. The predictive performance decreased sequentially for hemoglobin, calcium, potassium, sodium, and chloride. Notably, for all variables, the null hypothesis of a slope equal to 0 in the linear regression was significantly rejected, indicating a meaningful correlation between ECG-derived predictions and actual metadata values.
LVEF prediction using ECG and single metadata
Using ECG data alone, EfficientNet B3 and ResNet-101 achieved area under the curve (AUC) values of 0.896 and 0.900, respectively, in the detection of HFrEF. In both cases, specificity was high, while sensitivity was relatively low (Table 2). A scatter plot (Fig. 5) indicated that EfficientNet B3 had a slightly higher R2 value than ResNet-101, though the overall performance of both models was comparable. When training EfficientNet B3 using ECG data combined with single metadata, the addition of NT-proBNP resulted in the best performance with an AUC of 0.931 (R2 = 0.493, p = 0.047), indicating a statistically significant improvement.
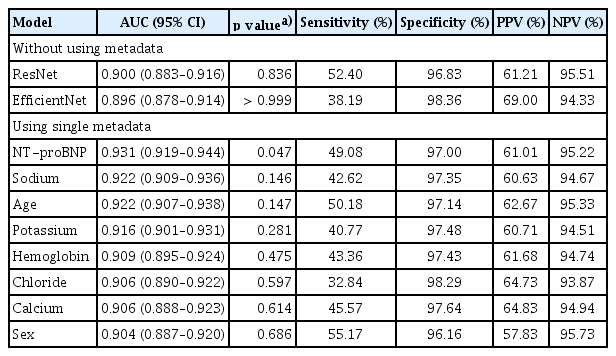
Area under the curve using single metadata
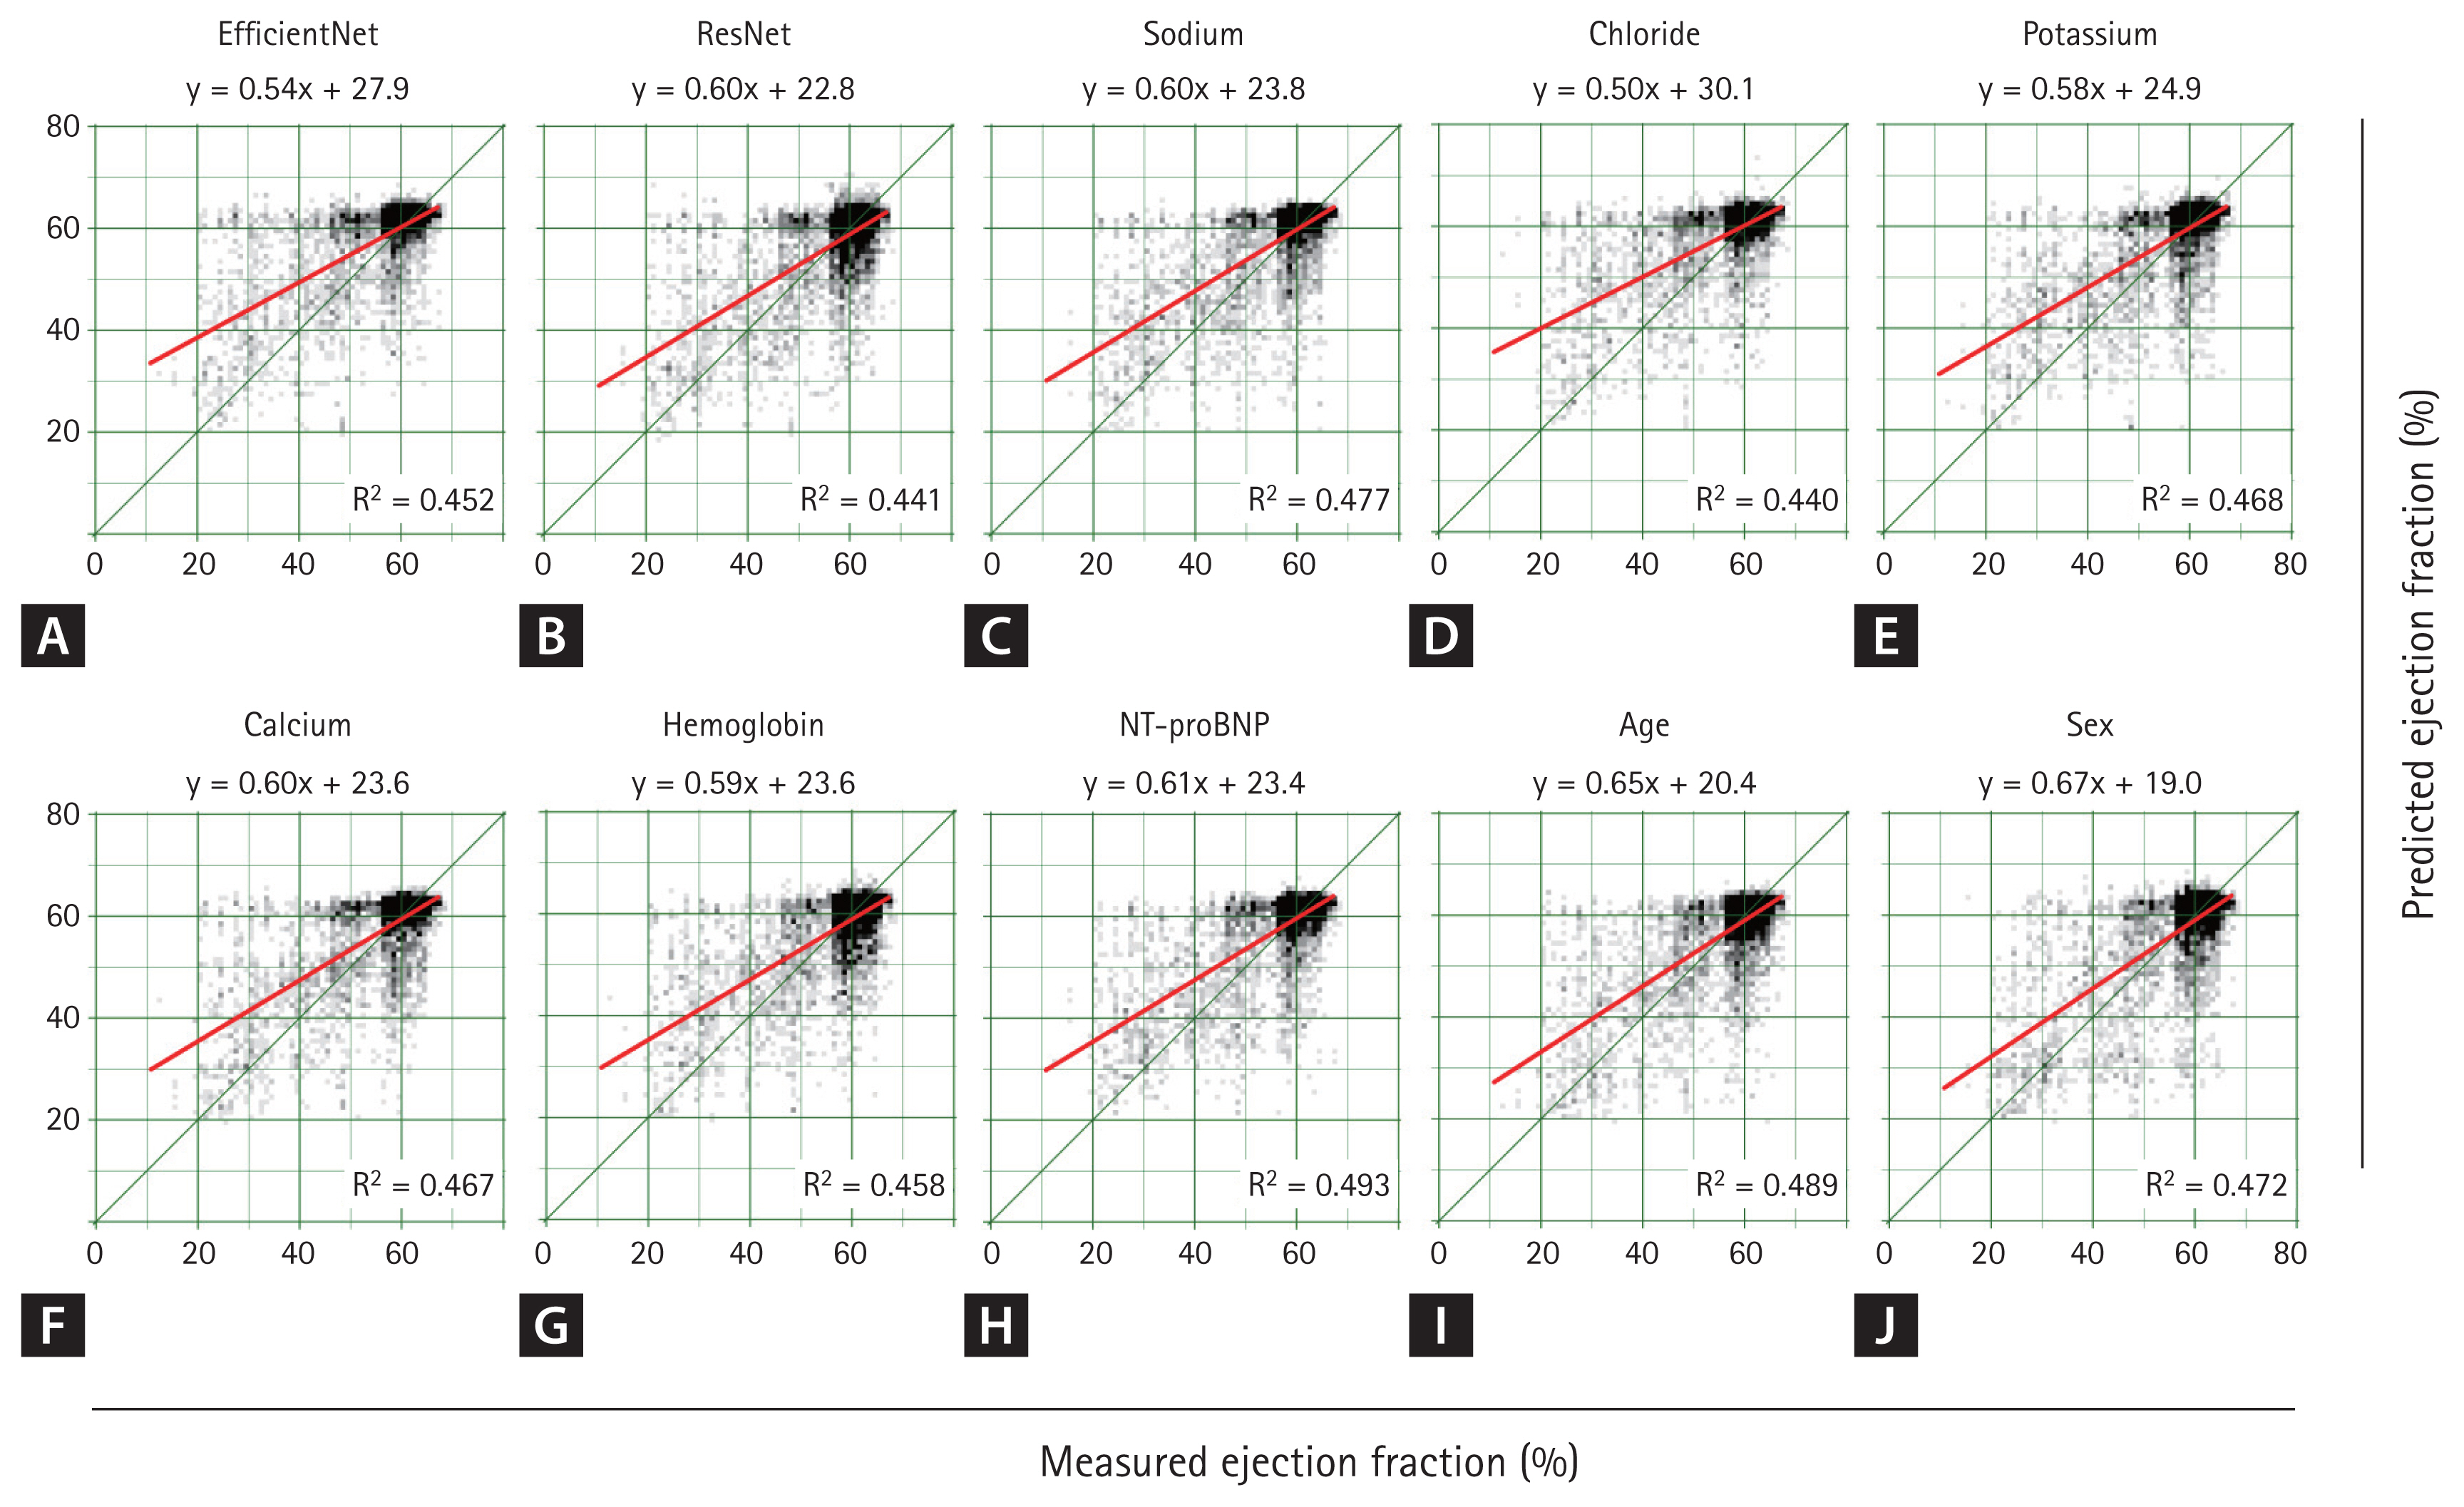
Predicted ejection fraction using ECG and single metadata. When using only ECG without metadata, EfficientNet and ResNet produced nearly identical results (A, B). When a single metadata was concatenated to the ECG and EfficientNet was trained, the overall distribution remained similar (C–J), showing a pattern comparable to that observed without metadata (A). Regarding R2, the highest value was achieved when NT-proBNP was added, followed by age and sodium. ECG, electrocardiogram; NT-proBNP, N-terminal pro B-type natriuretic peptide; R2, coefficient of determination.
Additional metadata variables, such as sodium and age, slightly enhanced the model’s predictive power (AUC = 0.922, R2 = 0.477, and AUC = 0.922, R2 = 0.489, respectively). However, these additions did result in statistically insignificant differences compared to the model without metadata. The next most influential metadata variables, ranked by their impact on performance, were potassium, hemoglobin, chloride, calcium, and sex.
Combination of multiple metadata with the ECG model
The performance of EfficientNet B3 was further assessed by incorporating multiple metadata variables into the model. Metadata were added sequentially, prioritizing those that had previously demonstrated the greatest impact on the receiver operating characteristic (ROC) curve and R2 values.
The best performance was achieved by combining age, NT-proBNP, and sodium levels, yielding an AUC of 0.95 and a statistically significant difference compared to ECG alone (p = 0.001). Interestingly, as the number of metadata variables increased beyond this optimal combination, a trend of diminishing performance was observed (Table 3).
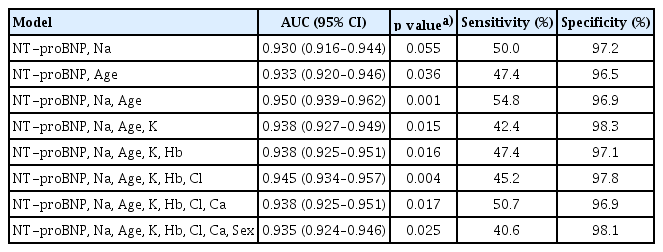
Area under the curve where multiple metadata were utilized
Comparison of ROC Curves and AUC using ECG and Metadata
The ROC curves for the test set are shown in Fig. 6. The model integrating ECG with clinical metadata (age, NT-proBNP, and serum sodium) achieved the highest discriminatory performance, with an AUC of 0.950 (95% confidence interval [CI] 0.939–0.962), significantly outperforming the ECG-only model, which had an AUC of 0.896 (95% CI 0.878–0.914). The ECG-only model also showed superior performance compared to NT-proBNP alone (AUC 0.858, 95% CI 0.846–0.870).
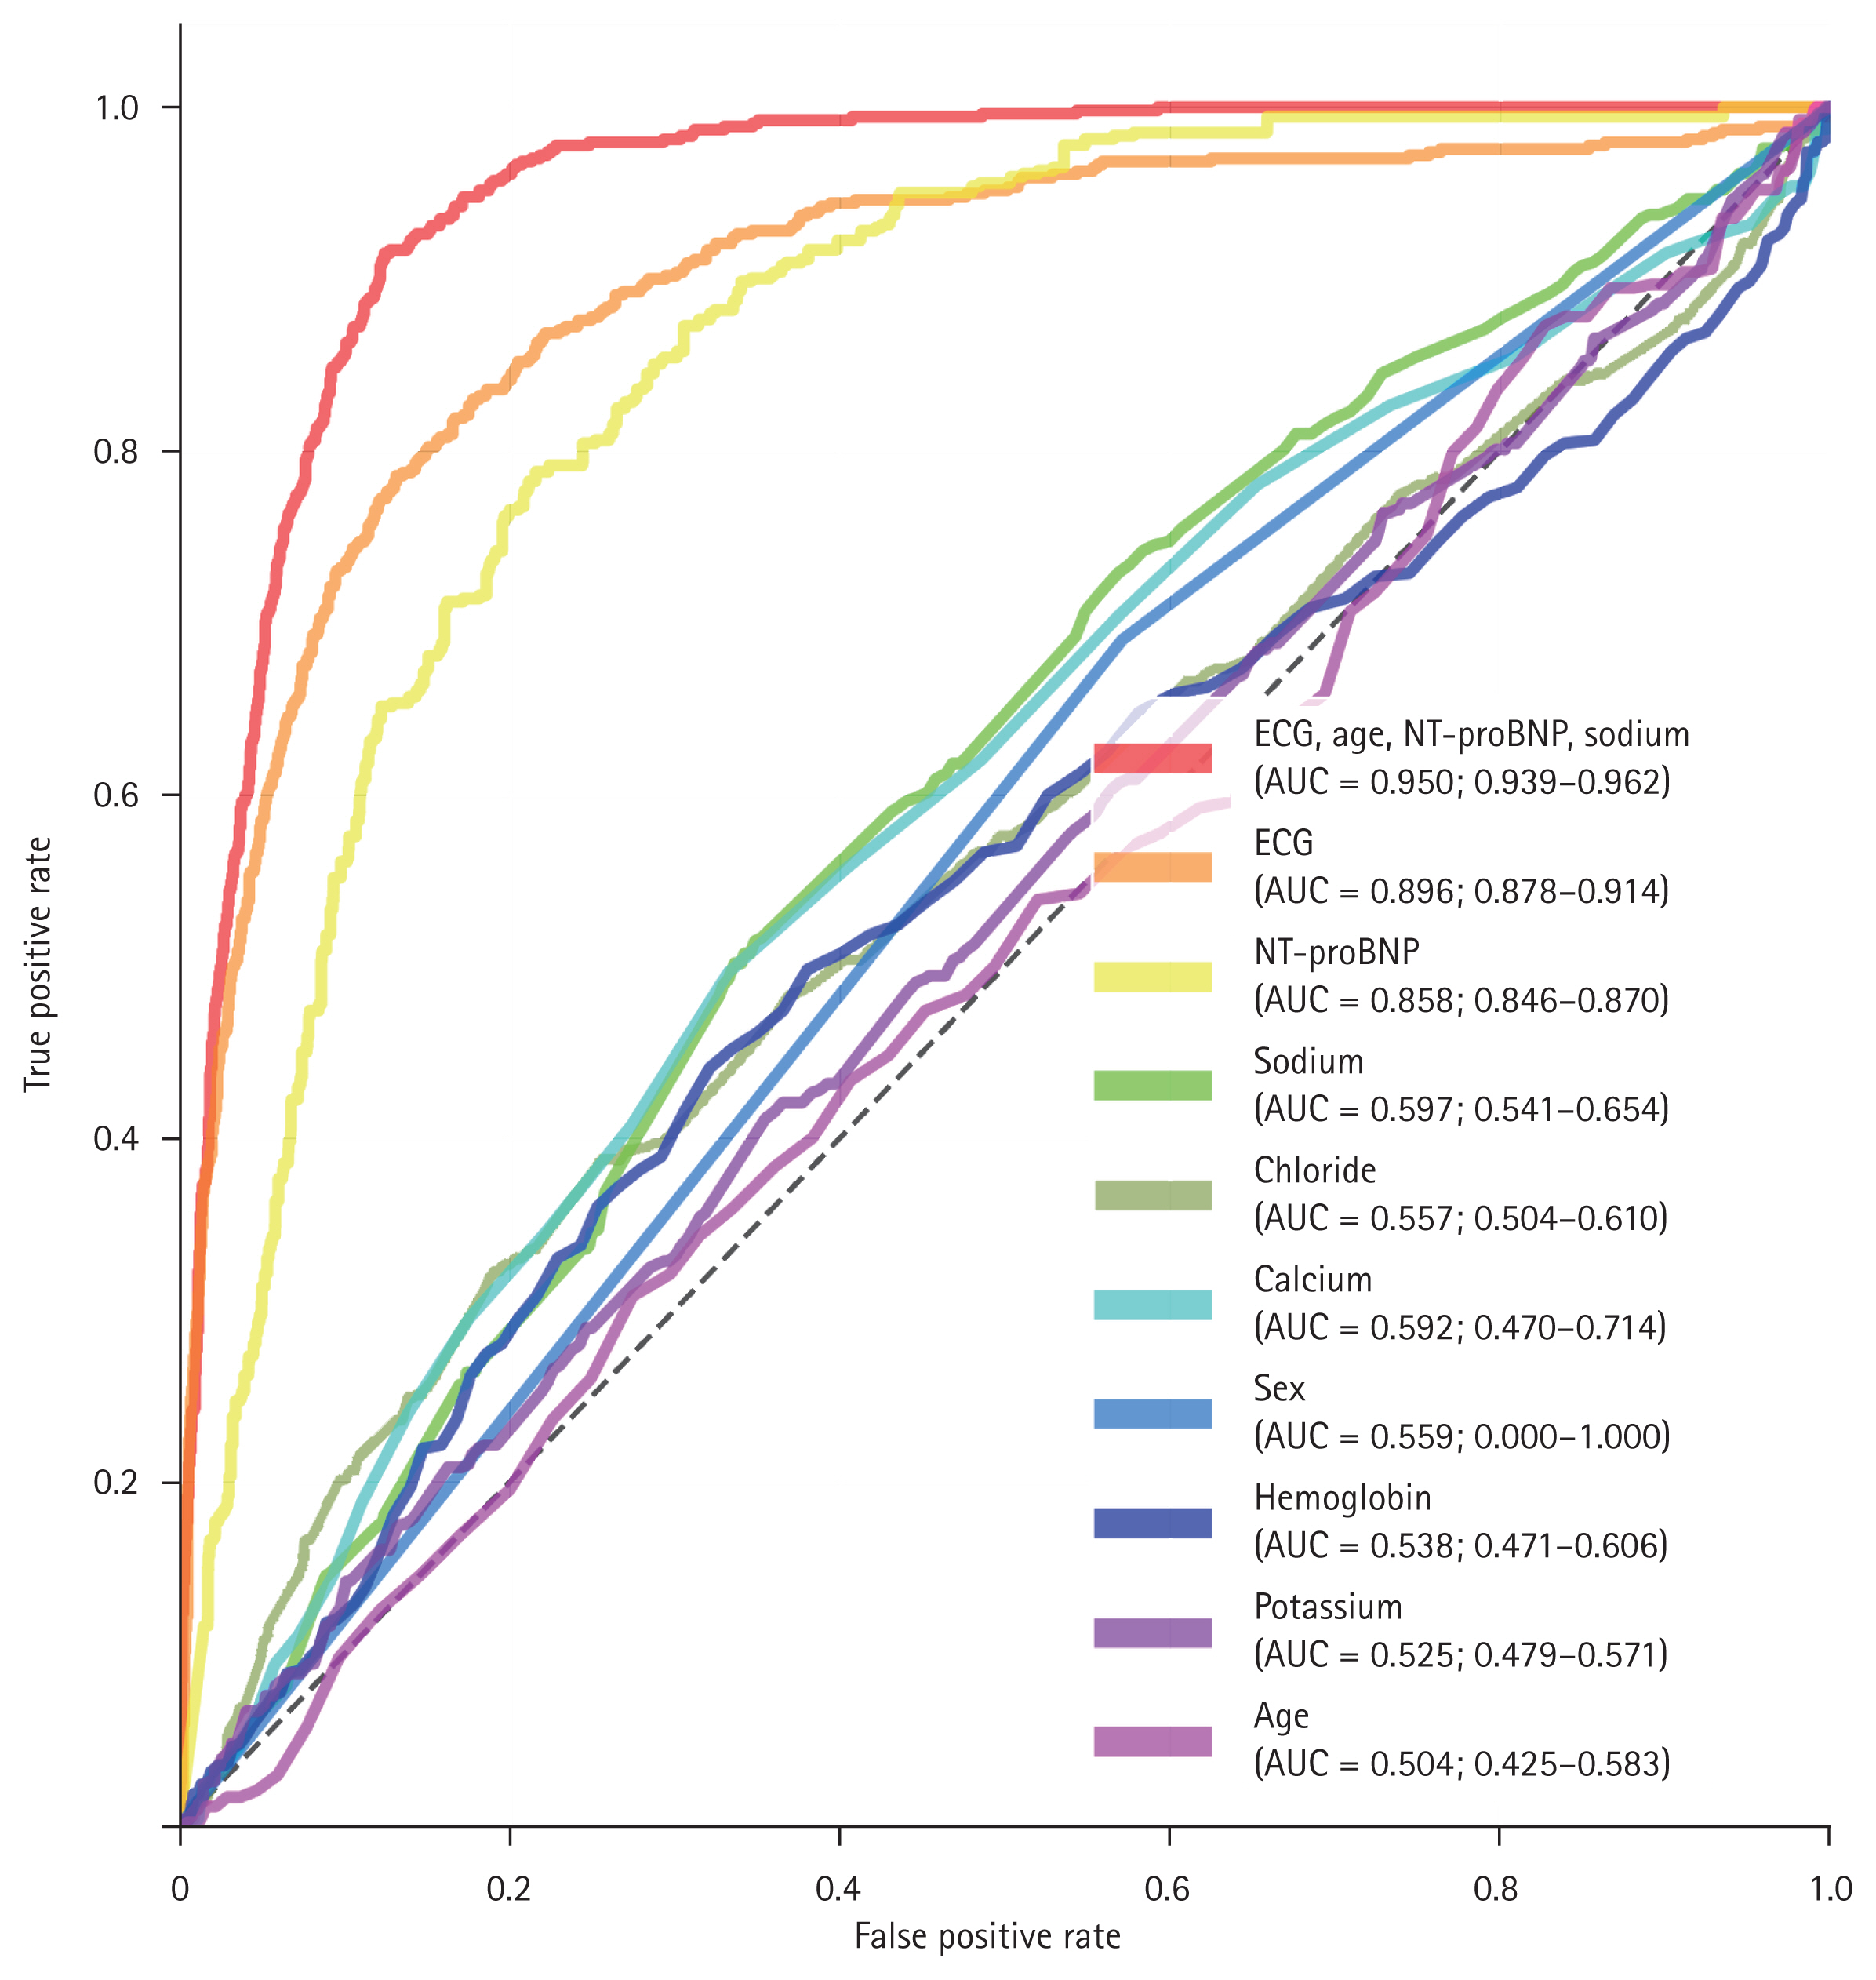
The ROC curves for ECG and metadata. The red line represents the combined CNN model using both ECG and metadata, which demonstrated the highest predictive performance with a statistically significant improvement over the ECG-only CNN model (orange line) at the 95% confidence level. The ECG-only CNN model (orange line) also outperformed NT-proBNP (yellow line) with statistical significance. NT-proBNP, sodium, chloride, calcium, sex, potassium, and age were each used individually to predict HFrEF. Among them, NT-proBNP (yellow line), sodium (green line), and chloride (olive green line) showed statistically significant predictive performance, whereas calcium, sex, hemoglobin, potassium, and age did not. ROC, receiver operating characteristic; ECG, electrocardiogram; CNN, convolutional neural network; HFrEF, heart failure with reduced ejection fraction; NT-proBNP, N-terminal pro B-type natriuretic peptide.
At a fixed sensitivity of 90%, the combined model yielded a predicted LVEF cut-off of < 54.4 with a specificity of 0.879, whereas the ECG-only model yielded a cut-off of < 60.5 with a specificity of 0.716. Among individual clinical variables, NT-proBNP, serum sodium, and chloride showed statistically significant predictive performance (AUCs 0.858, 0.597, and 0.557, respectively), while calcium, sex, hemoglobin, potassium, and age did not yield statistically meaningful discrimination (AUCs ranging from 0.504 to 0.592).
DISCUSSION
This study demonstrates the feasibility of using ECG combined with metadata to accurately predict LVEF and HFrEF. EfficientNet B3, a deep neural network model, exhibited robust performance, emphasizing the critical role of metadata—particularly age, NT-proBNP, and sodium concentrations—in enhancing the predictive capabilities of ECG-based deep learning models.
Previous studies have primarily relied on ECG alone or traditional statistical methods to predict LVEF. However, these approaches often fail to capture subtle variations in ECG signals or incorporate diverse clinical information. By integrating metadata, our proposed model addresses this gap, significantly improving LVEF prediction accuracy. This is evidenced by the highest AUC of 0.95 achieved when age, NT-proBNP, and sodium levels were combined, highlighting the potential of additional clinical data to augment the diagnostic capabilities of ECG analysis.
Studies aiming to predict LVEF using ECG data have reported AUC values ranging from 0.83 to 0.96. A literature review suggests a correlation between AUC values and the proportion of patients with HFrEF, with studies including a higher proportion of patients with HFrEF tending to report lower AUC values. For instance, reported AUCs and corresponding proportions of patients with HFrEF include: AUC 0.83, 33.6% of patients with HF [18]; AUC 0.89, 10.2% [16]; AUC 0.91, 5.4% [17]; and AUC 0.96, 4.3% [24]. In this study, 8.7% of patients in the Hospital B test set had HFrEF, yielding an AUC of 0.90 for the model without metadata—consistent with previous findings.
This trend appears to be influenced by model performance variability across different LVEF levels. As illustrated in Figure 5, the deep neural network provided relatively accurate predictions for normal-range LVEF; however, predictive accuracy declined as LVEF decreased. Consequently, overall model performance—as reflected by the AUC—tends to decrease when the proportion of low-LVEF patients increases.
Previous studies have shown that stratifying patients based on age or prior medical history results in variations in model performance, whereas sex or body mass index generally does not yield statistically significant differences [14,16]. These subgroup effects may also stem from differences in the proportion of patients with HF. For instance, when predicting LVEF in older patients, models tend to perform less effectively, likely due to the higher prevalence of HF with age. Nevertheless, adding metadata such as age may still be valuable in LVEF prediction [14,16].
Improving prediction performances with the addition of metadata
To enhance model performance in patients with HFrEF, this study incorporated various metadata variables, aiming to improve predictive capability in more challenging cases. The observed improvements in predictive accuracy—when incorporating age, NT-proBNP, and sodium levels into AI-ECG models—can be attributed to the clinical and physiological significance of these parameters. Each variable provides critical additional context that complements the information derived from ECG signals.
NT-proBNP is a widely recognized biomarker for ventricular dysfunction and HF, with elevated levels indicating increased ventricular wall stress and impaired cardiac function [25]. In this study, NT-proBNP significantly improved LVEF prediction accuracy, achieving the highest AUC when combined with ECG data, underscoring its strong correlation with LV performance. Sodium levels, which are essential for fluid balance and myocardial function, are frequently low in advanced HF (hyponatremia) and are associated with poor prognosis [26]. Age, a fundamental determinant of cardiac health, is linked to a higher risk of reduced EF and HF in older populations [27]. The integration of these metadata further enhanced model performance, demonstrating their complementary value in EF prediction.
Prior to the advent of CNNs, studies reported that ECG and NT-proBNP demonstrated comparable predictive performance for HFrEF in clinical settings [28,29]. However, ECG has shown superior predictive performance for HfrEF since the development of CNNs [30,31]. Due to the “black box” nature of CNNs, it is impossible to determine exactly which features contribute most significantly to LVEF prediction. However, features for which small transformations result in a notable decline in model performance may indicate their importance. During data augmentation, modifying the base voltage led to a marked deterioration in model performance, even with small changes. In contrast, the model remained relatively robust to transformations such as stretching along the time axis (heart rate) or scaling along the voltage axis (QRS amplitudes). This suggests that, in addition to the previously recognized importance of QRS amplitudes [32], base voltage may also play a critical role in predicting LVEF. Furthermore, as shown in Figure 6, low concentrations of sodium and chloride, as well as elevated NT-proBNP levels, may also aid in the prediction of HF.
Clinical implications
HF often presents with nonspecific symptoms such as dyspnea, fatigue, weakness, and abdominal discomfort, leading patients to visit the emergency department. In the emergency setting, rapid assessment and early differentiation of serious conditions are essential. ECG and blood tests are commonly used as initial diagnostic tools. If LVEF can be predicted early using ECG and blood tests, it may help detect HF quickly and guide triage and early treatment. Although acute-phase treatment focuses primarily on volume control, early identification of reduced LVEF (e.g., < 40%) can assist in risk stratification, guide admission decisions (ward vs. intensive care unit), and prompt timely referral to cardiologists. Therefore, if reduced LVEF can be accurately predicted using only ECG and readily available blood tests, it may help clinicians make more informed early management decisions even before echocardiography is performed.
It has profound clinical implications, particularly in resource-limited settings where access to TTE is restricted. This approach could facilitate early diagnosis and risk stratification of HF, enabling timely intervention.
Moreover, the high specificity observed in our models suggests their potential utility in ruling out severe cardiac dysfunction with minimal false positives.
Limitations
Despite these promising results, this study has certain limitations. The dataset was derived from only two institutions, which may limit the generalizability of the findings. Additionally, the study design was retrospective, and validation in real-world clinical environments is lacking. Although the study’s data augmentation techniques enhanced the model’s robustness, the impact of data heterogeneity across institutions warrants further investigation. Future studies should focus on external validation with more diverse populations and explore the integration of additional metadata, such as imaging or genetic data, to further improve prediction accuracy.
Conclusions
The combination of ECG and metadata results using AI enhances the predictive accuracy of LVEF estimation. This approach offers a scalable and noninvasive method for HF screening and risk stratification, particularly in resource-limited settings. Further validation in diverse populations is needed to confirm its clinical utility.
Future directions
Future studies should validate the model on diverse populations to confirm its clinical applicability. Additionally, including other metadata, such as pulse wave velocity, may add accuracy to the prediction, and future research should explore their integration. Beyond CNN-based models, vision transformers [19] and other deep learning architectures may benefit from metadata integration, warranting further exploration in future studies. Furthermore, future studies may incorporate radiologic data such as chest X-ray findings. Incorporating such data may improve diagnostic performance and expand the clinical utility of automated LVEF prediction tools.
KEY MESSAGE
1. Integrating clinical metadata (age, NT-proBNP, and sodium levels) with ECG significantly improves the accuracy of LVEF prediction.
2. The AI model achieved an AUC of 0.95, outperforming ECG-based prediction alone (AUC = 0.90).
3. This approach enhances the detection of HFrEF and serves as a potential screening tool with high specificity (96.90%).
4. AI-driven ECG analysis combined with metadata offers a scalable, noninvasive method for HF risk stratification, particularly in resource-limited settings.
5. Further validation in diverse populations is required to establish clinical utility.
Notes
CRedit authorship contributions
Hyun Woong Park: conceptualization, methodology, resources, investigation, data curation, formal analysis, validation, software, writing - original draft, writing - review & editing, visualization, supervision, project administration, funding acquisition; Taeseen Kang: conceptualization, methodology, resources, writing - original draft, visualization, project administration, funding acquisition; Young-Hoon Seo: investigation, data curation, formal analysis, validation, software, visualization; Jae-Hyeong Park: conceptualization, methodology, resources, investigation, data curation, formal analysis, validation, writing - original draft, writing - review & editing, visualization, supervision, project administration, funding acquisition
Conflicts of interest
The authors disclose no conflicts.
Funding
This work was supported by Chungnam National University Sejong Hospital Research Fund, 2023.