Association between diabetes duration and hyperuricemia: Korea National Health and Nutrition Examination Survey 2016 to 2021
Article information

Abstract
Background/Aims
We examined the association between diabetes duration and hyperuricemia in Korean subjects based on data from the Korea National Health and Nutrition Examination Survey (KNHANES).
Methods
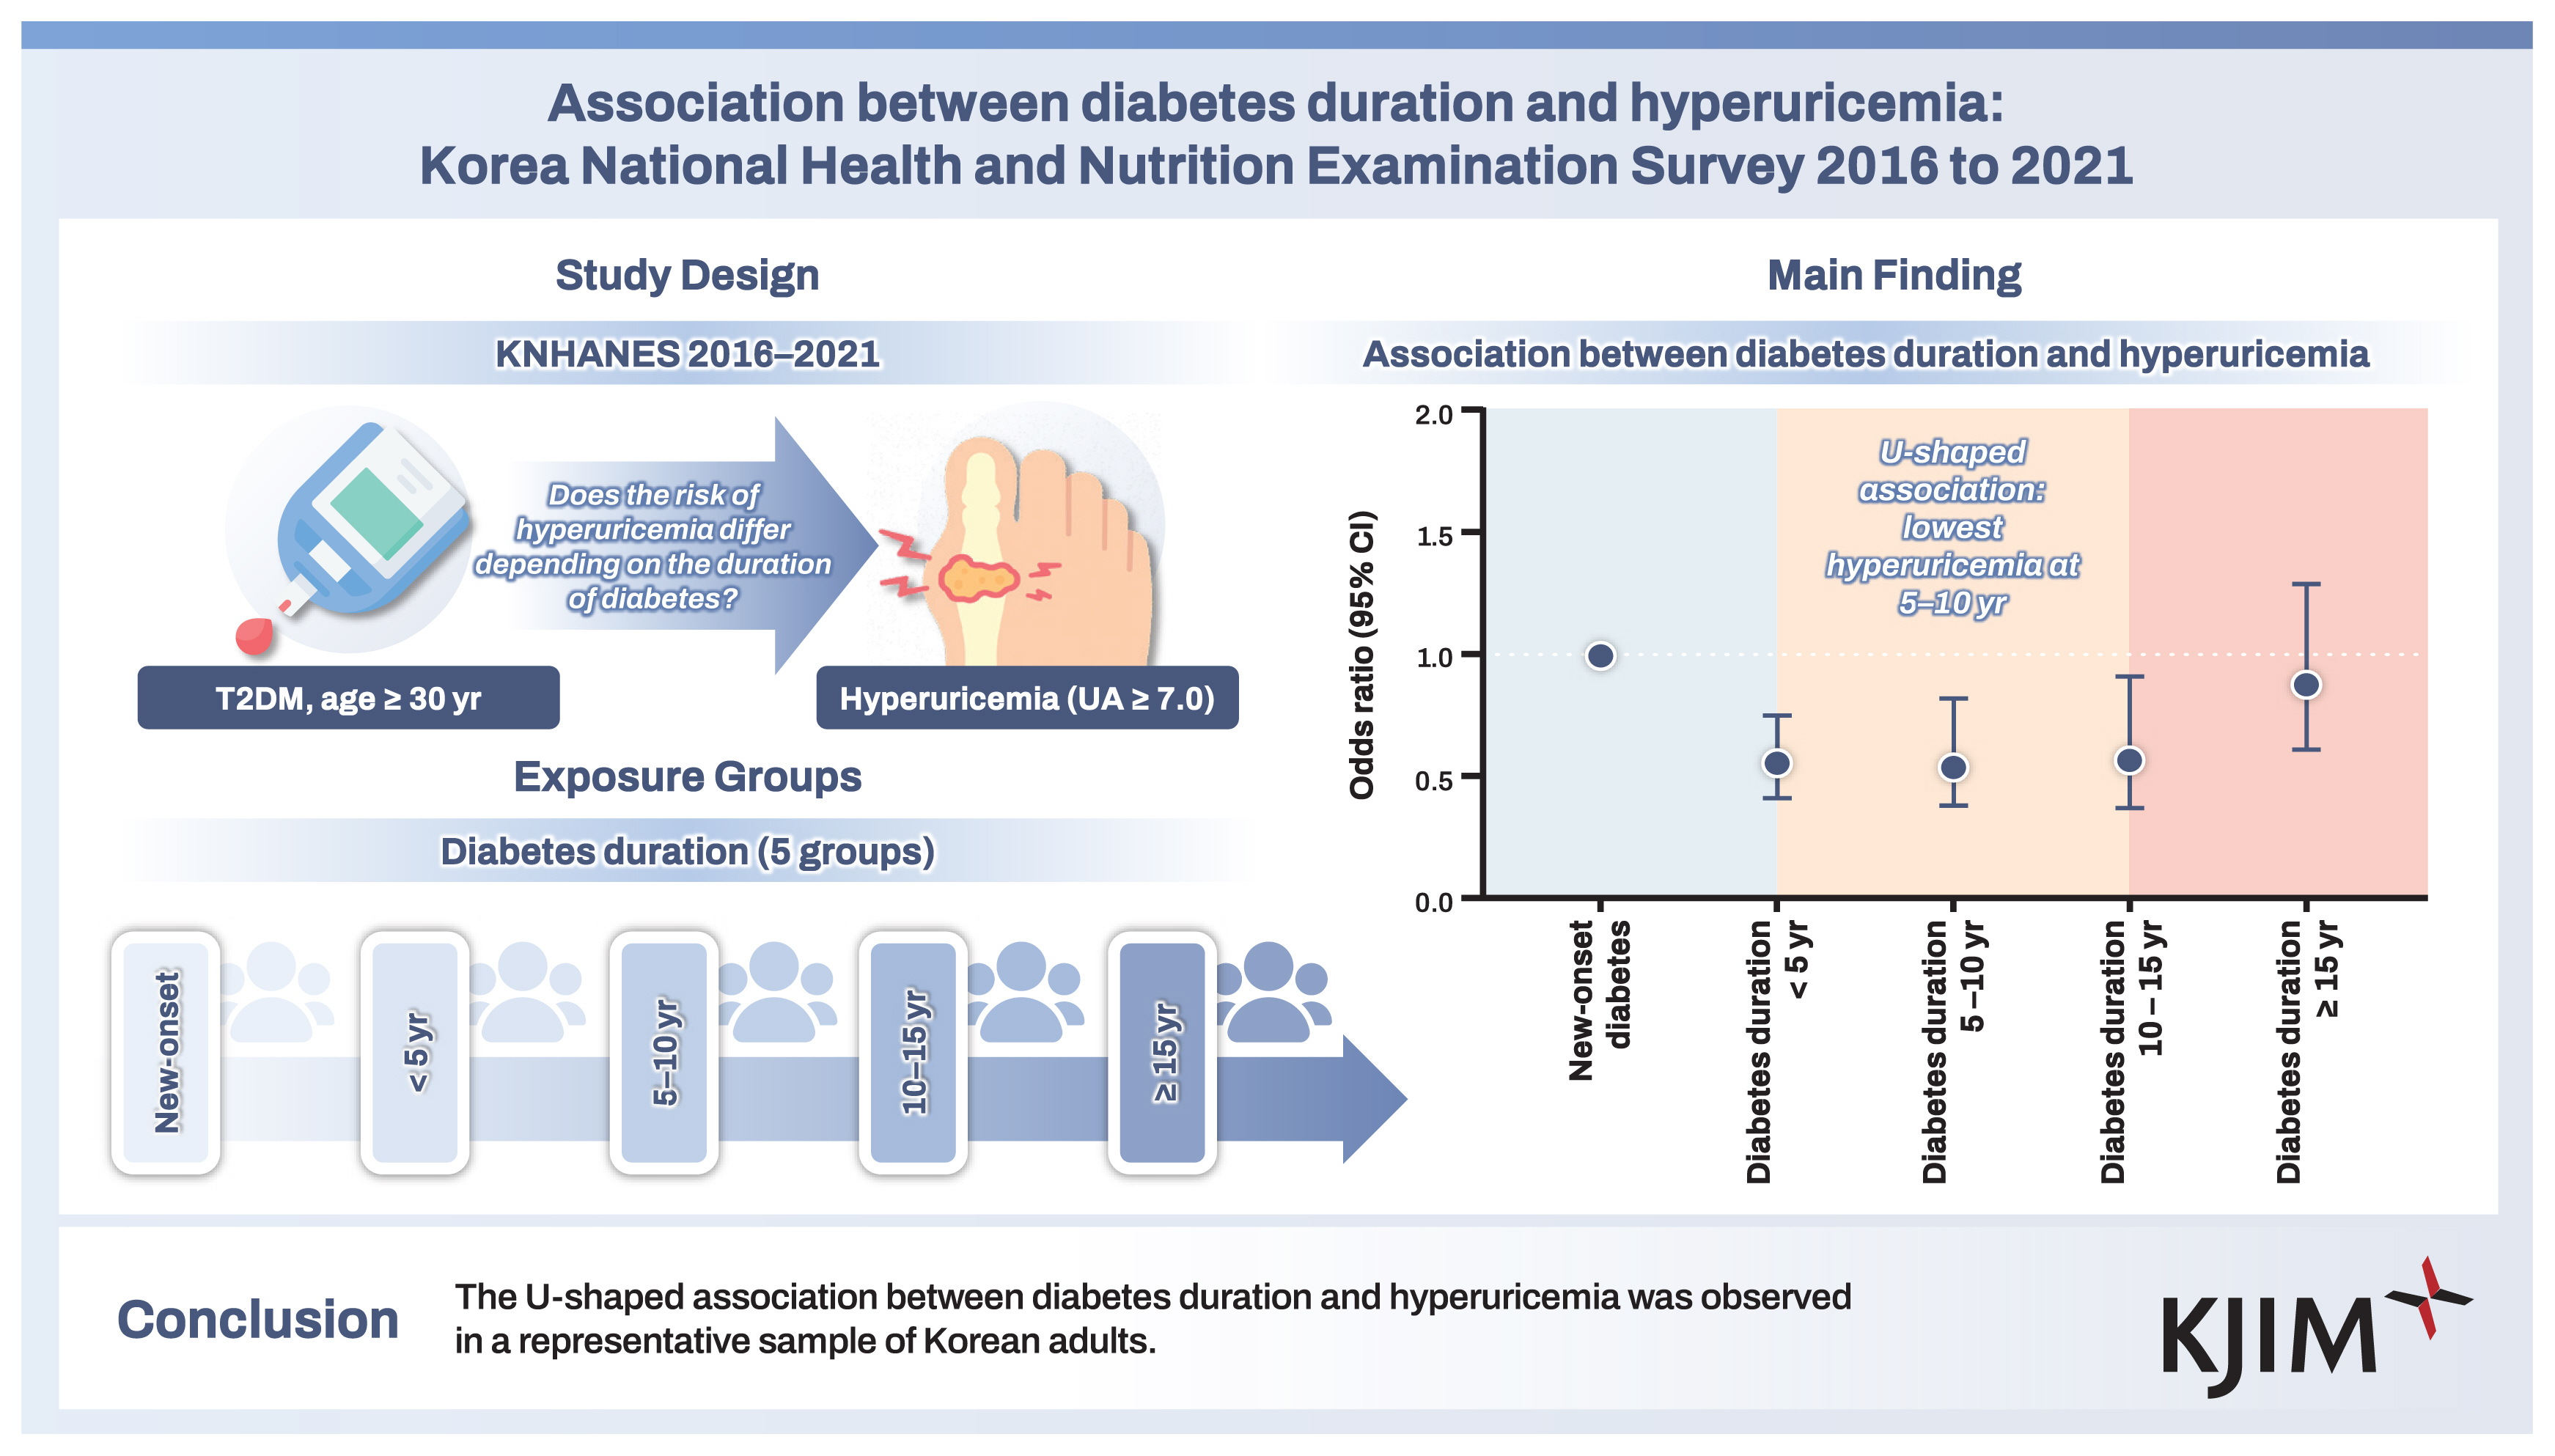
This cross-sectional study included 4,575 subjects aged 30 years and older with type 2 diabetes mellitus based on data from the KNHANES from 2016 to 2021. Hyperuricemia was defined as a serum uric acid level ≥ 7.0 mg/dL. Univariable and multivariable logistic regression models were used calculate adjusted odds ratios (ORs) and their 95% confidence intervals (CIs).
Results
The mean age of subjects was 61.0 years, 56.5% were male, and the mean body mass index (BMI) was 25.6 kg/m2. Compared to those with diabetes duration 5 to < 10 years, those with shorter or longer diabetes duration had higher serum uric acid levels and higher prevalence of hyperuricemia. In multivariable logistic regression models, a U-shaped association between diabetes duration and hyperuricemia was observed after adjusting for age, sex, income, smoking status, alcohol consumption, regular exercise, and presence of hypertension, dyslipidemia, or chronic kidney disease. Compared to those with new-onset diabetes mellitus, the adjusted OR (95% CI) for hyperuricemia was 0.55 (0.38–0.82) in those with diabetes duration 5 to < 10 years. The results were consistent in subgroup analysis according to age, sex, BMI, and chronic kidney disease.
Conclusions
The U-shaped association between diabetes duration and hyperuricemia was observed in a representative sample of Korean adults.
INTRODUCTION
Diabetes mellitus is one of the most common metabolic diseases and is characterized by insulin resistance and beta cell dysfunction [1]. The prevalence of diabetes in Korea was estimated to be 13.9% in 2020 [2]. The global prevalence of diabetes in 2021 was estimated to be 10.5% (536 million) and is predicted to increase to 12.2% (783 million) in 2045 [3]. The diabetes duration is known to be significantly associated with the risk of metabolic syndrome [4].
Serum uric acid is the metabolic end-product of the purine nucleotides. Hyperuricemia or elevated serum uric acid level results from overproduction or decreased renal excretion of serum uric acid [5]. According to the data from the Korea National Health and Nutrition Examination Survey (KNHANES), the prevalence of hyperuricemia in Korea was estimated to be 11.4% in 2016 [6]. According to the data from the National Health and Nutrition Examination Survey, the prevalence of hyperuricemia in the United States was about 20% between 2015 to 2016 [7]. Hyperuricemia is associated with multiple components of metabolic syndrome such as hyperglycemia, obesity, dyslipidemia, and hypertension [8]. In addition, several studies have shown that hyperuricemia is a risk factor for cardiovascular diseases [9–11].
Several studies have examined the association between diabetes and hyperuricemia. Some reported a positive association between diabetes and hyperuricemia [12–14], but other reported no association [15], or an inverse association [16,17]. However, the association between diabetes duration and hyperuricemia has not been well-studied.
Therefore, we aimed to investigate the association between diabetes duration and hyperuricemia in subjects with type 2 diabetes mellitus (T2DM) based on data from the KNHANES from 2016 to 2021.
METHODS
Study population
We used the KNHANES database, a population-based, cross-sectional survey consisting of health examination, health interview, and nutrition survey data. The KNHANES population comprises non-institutionalized Korean citizens residing in Korea, and the sampling follows a multi-stage clustered probability design [18]. In the present study, data from the 7th (2016–2018) and 8th phases (2019–2021) of the KNHANES were used. Of the 46,828 subjects in the 2016–2021 KNHANES, we excluded those aged < 30 years (n = 13,477), those without diabetes (n = 28,293), and those with missing data (n = 483). The remaining 4,575 subjects were included in the study (Fig. 1).
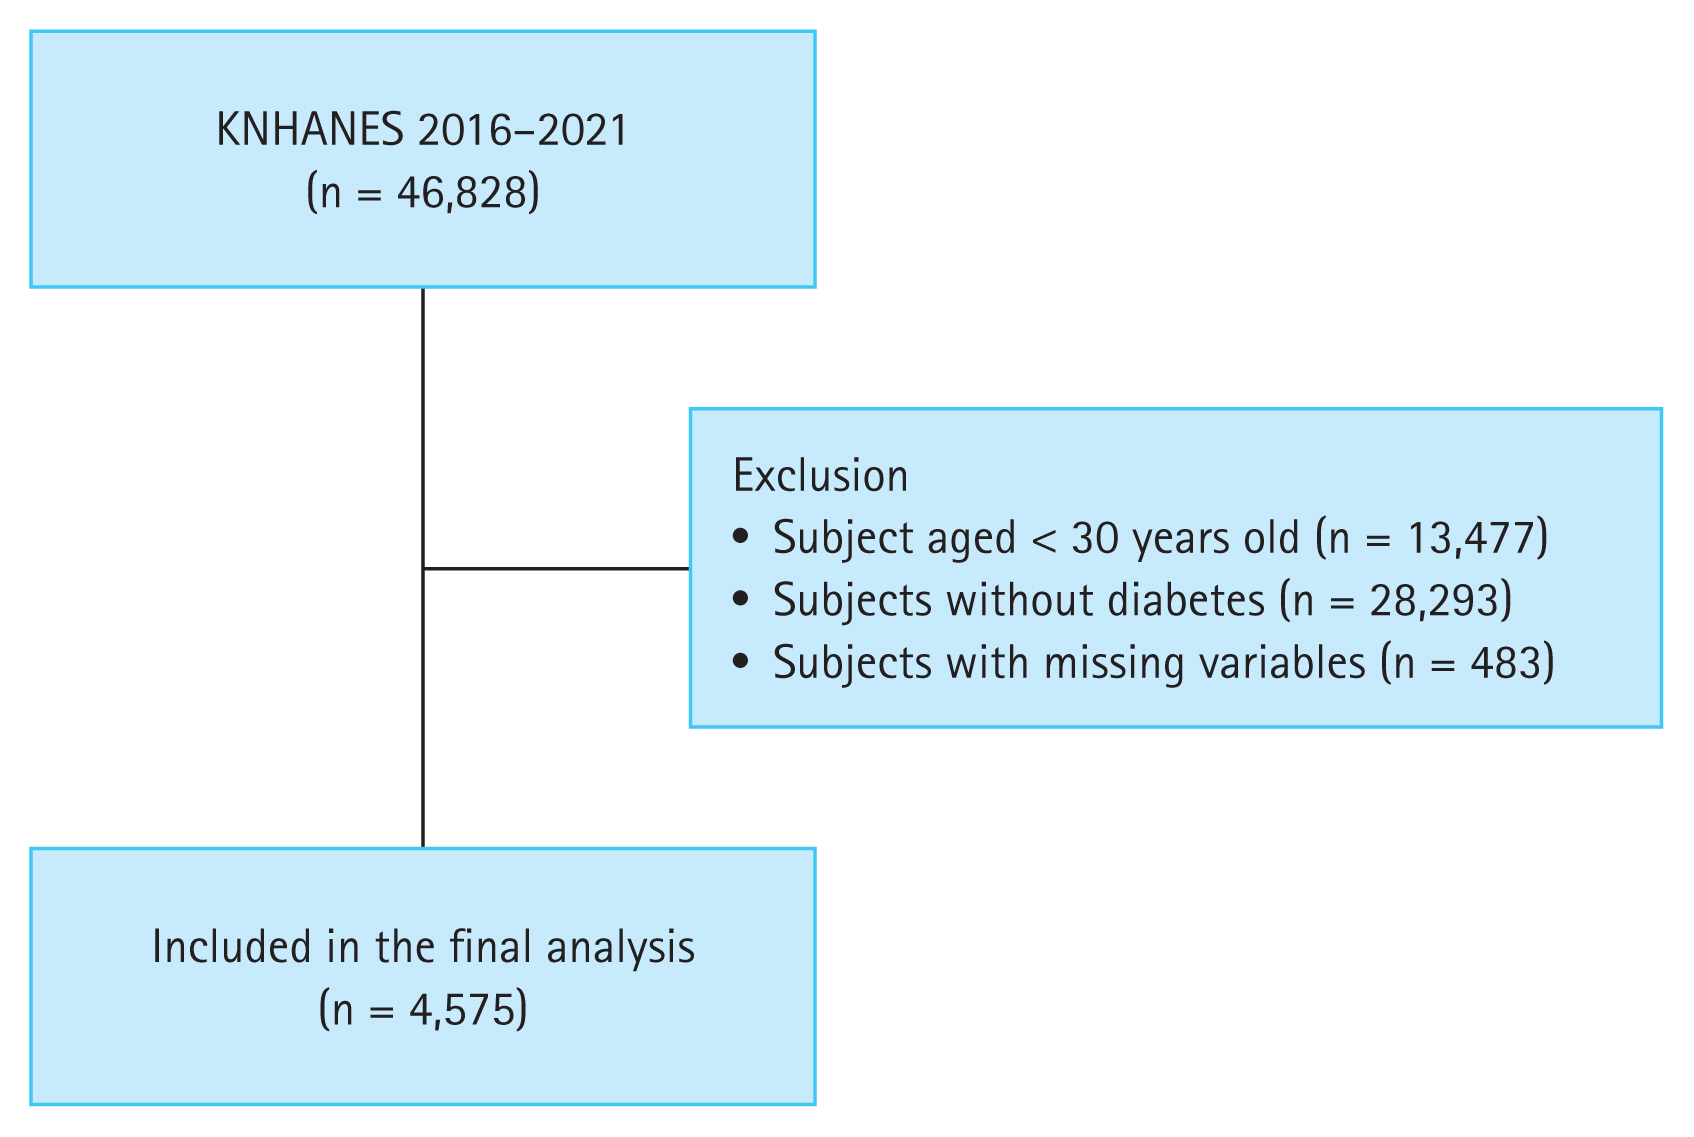
A flowchart of the study population enrollment. KNHANES, Korea National Health and Nutrition Examination Survey.
This study was approved by the Institutional Review Board of The Catholic University of Korea, St. Vincent’s Hospital (approval number: VC23ZISI0201). The requirement for informed consent was waived. The study was conducted in accordance with the principles of the Declaration of Helsinki.
Collection of data
Healthcare professionals at the survey sites measured anthropometric indices, body mass index (BMI), waist circumference, and blood pressure (BP). Information about medical conditions, smoking status, alcohol consumption, and exercise was obtained through a face-to-face interview and self-administered survey questionnaire. Laboratory tests including a lipid profile and fasting blood glucose, HbA1c, blood urea nitrogen, creatinine, and uric acid levels were performed [19].
Variables
Smoking status was categorized into non-smokers, ex-smokers, and current smokers. Alcohol consumption was categorized into non-drinker, mild drinker (< 30 g/day), and heavy drinker (≥ 30 g/day). Regular exercise was defined as > 150 minutes of moderate-intensity or > 75 minutes of vigorous-intensity physical activity, or some equivalent combination of moderate-intensity and vigorous-intensity aerobic physical activity, per week [20]. Low income (Q1) was defined as the lowest 25% income bracket of the total population based on monthly income.
T2DM was defined as fasting glucose level ≥ 126 mg/dL, previous history of T2DM, or use of antidiabetic medications or insulin. Diabetes duration was classified into five groups: new-onset diabetes, diabetes duration < 5 years, diabetes duration 5 to < 10 years, diabetes duration 10 to < 15 years, and diabetes duration ≥ 15 years. Hyperuricemia was defined as a serum uric acid level ≥ 7.0 mg/dL based on previous studies [21–23]. Hypertension was defined as systolic BP ≥ 140 mmHg or diastolic BP ≥ 90 mmHg, a previous history of hypertension, or use of antihypertensive medications. Dyslipidemia was defined as a total cholesterol level ≥ 240 mg/dL or use of antidyslipidemic medications. Chronic kidney disease (CKD) was defined as an estimated glomerular filtration rate (eGFR) < 60 mL/min/1.73 m2 as calculated by the Modification of Diet in Renal Disease formula. Homeostasis model assessment of insulin resistance (HOMA-IR) was calculated as follows: fasting insulin (μIU/mL) × fasting glucose (mg/dL)/405.
Statistical analysis
Baseline characteristics of the participants are presented as the mean ± standard deviation or number with percentage (%). Baseline characteristics were compared between groups using the chi-square test for categorical variables and ANOVA for continuous variables. Multivariable logistic regression analysis was performed to assess the association between diabetes duration and hyperuricemia. The odds ratios (ORs) and 95% confidence intervals (CIs) were estimated using unadjusted and multivariable adjusted models. Model 1 was non-adjusted. Model 2 was adjusted for age and sex. Model 3 was adjusted for Model 2 factors plus income (Q1), smoking status, alcohol consumption, and regular exercise. Model 4 was adjusted for Model 3 factors plus hypertension, dyslipidemia, and CKD. Subgroup analyses were conducted according to age, sex, BMI, and CKD. All analyses were performed using SAS software version 9.3 (SAS Institute, Cary, NC, USA). A two-sided p value < 0.05 was considered statistically significant without adjustment for multiple comparisons.
RESULTS
Baseline characteristics
The mean age of subjects was 61.0 ± 4.6 years, their mean BMI was 25.6 ± 0.8 kg/m2, and 56.5% were male. Subjects with longer diabetes duration showed a decreasing trend in BMI, waist circumference, diastolic BP, insulin levels, HOMA-IR, total cholesterol, and LDL cholesterol and an increasing trend in creatinine levels, compared to those with new-onset diabetes. The prevalence of low income (Q1), hypertension, and CKD was higher among subjects with longer diabetes duration. The prevalence of hyperuricemia was 10% for all subjects. Compared to those with diabetes duration 5 to < 10 years, those with shorter or longer durations had higher serum uric acid levels and higher prevalence of hyperuricemia (Table 1).
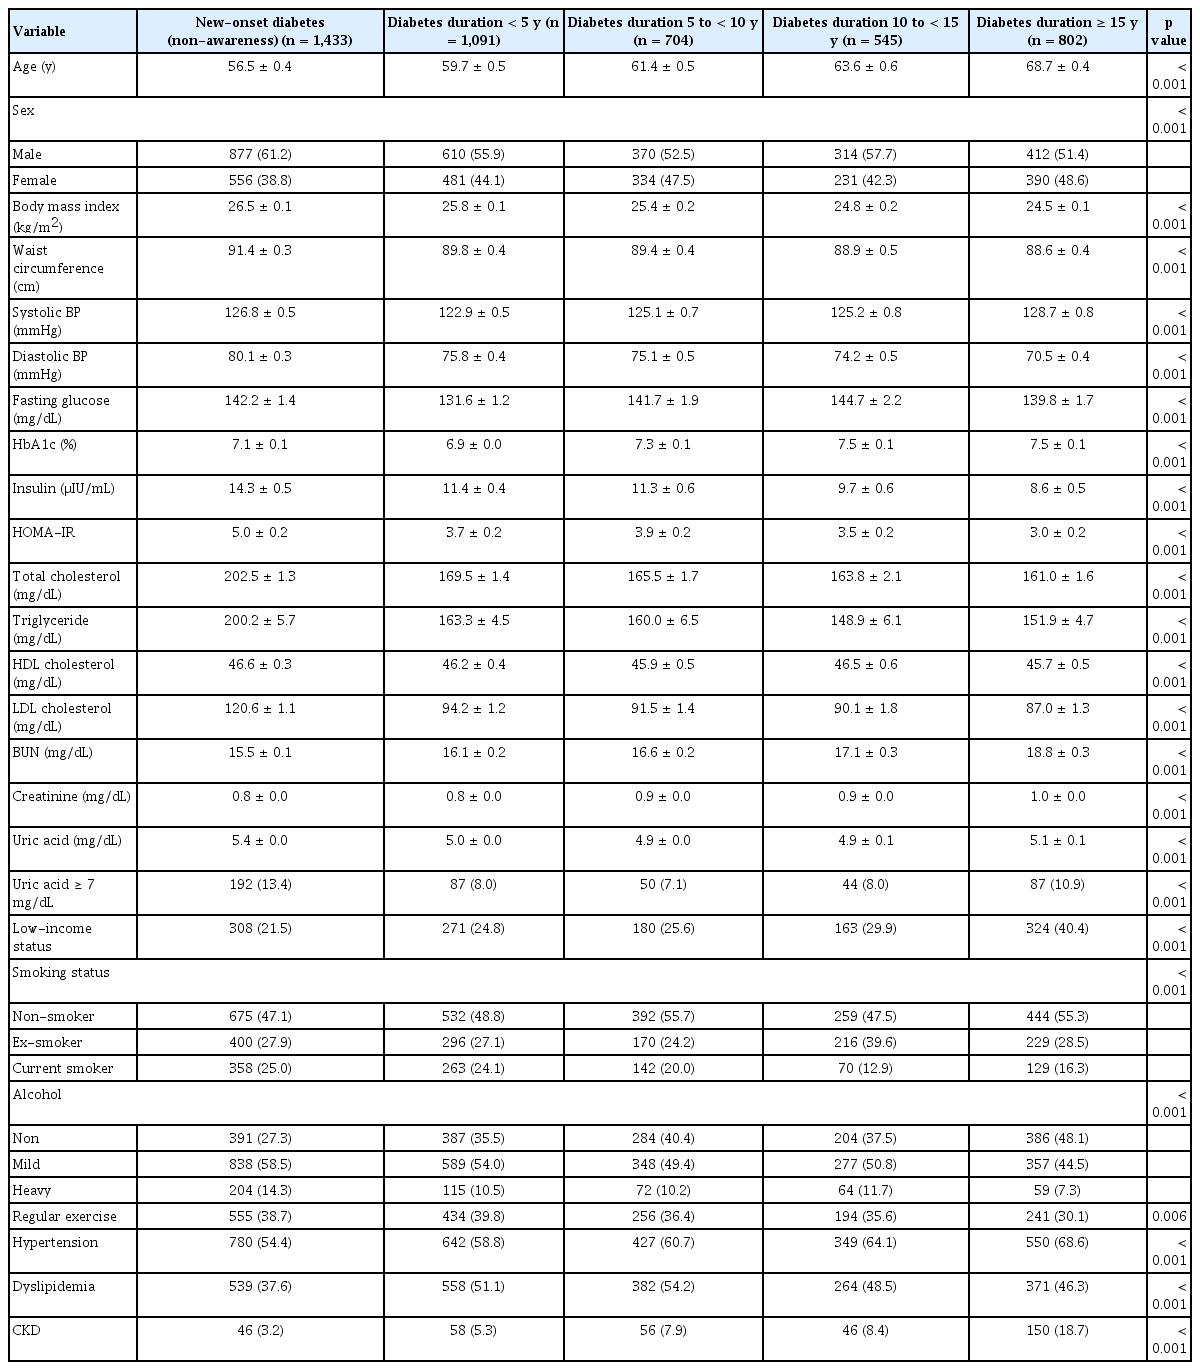
Baseline characteristics of the study population
Association between diabetes duration and hyperuricemia
The prevalence of hyperuricemia was 13.4%, 8.0%, 7.1%, 8.0%, and 10.9% in those with new-onset diabetes, diabetes duration < 5 years, diabetes duration 5 to < 10 years, diabetes duration 10 to < 15 years, and diabetes duration ≥ 15 years, respectively. In the non-adjusted model, diabetes duration < 5 years, diabetes duration 5 to < 10 years, and diabetes duration 10 to < 15 years were associated with lower prevalence of hyperuricemia. After multivariable adjustment, a U-shaped association between diabetes duration and hyperuricemia was observed (OR 0.56, 95% CI 0.41–0.75 for those with diabetes duration < 5 years; OR 0.55, 95% CI 0.38–0.82 for those with diabetes duration 5 to < 10 years; OR 0.58, 95% CI 0.37–0.91 for those with diabetes duration 10 to < 15 years; and OR 0.89, 95% CI 0.61–1.29 for those with diabetes duration ≥ 15 years) (Table 2 and Fig. 2).
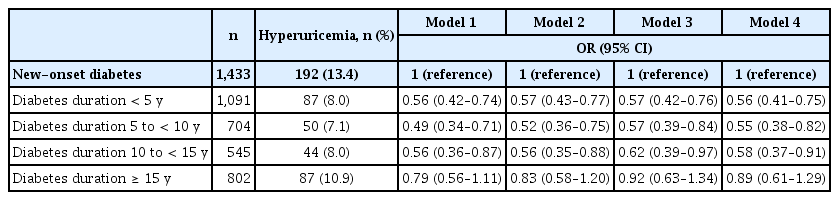
Association between diabetes duration and hyperuricemia
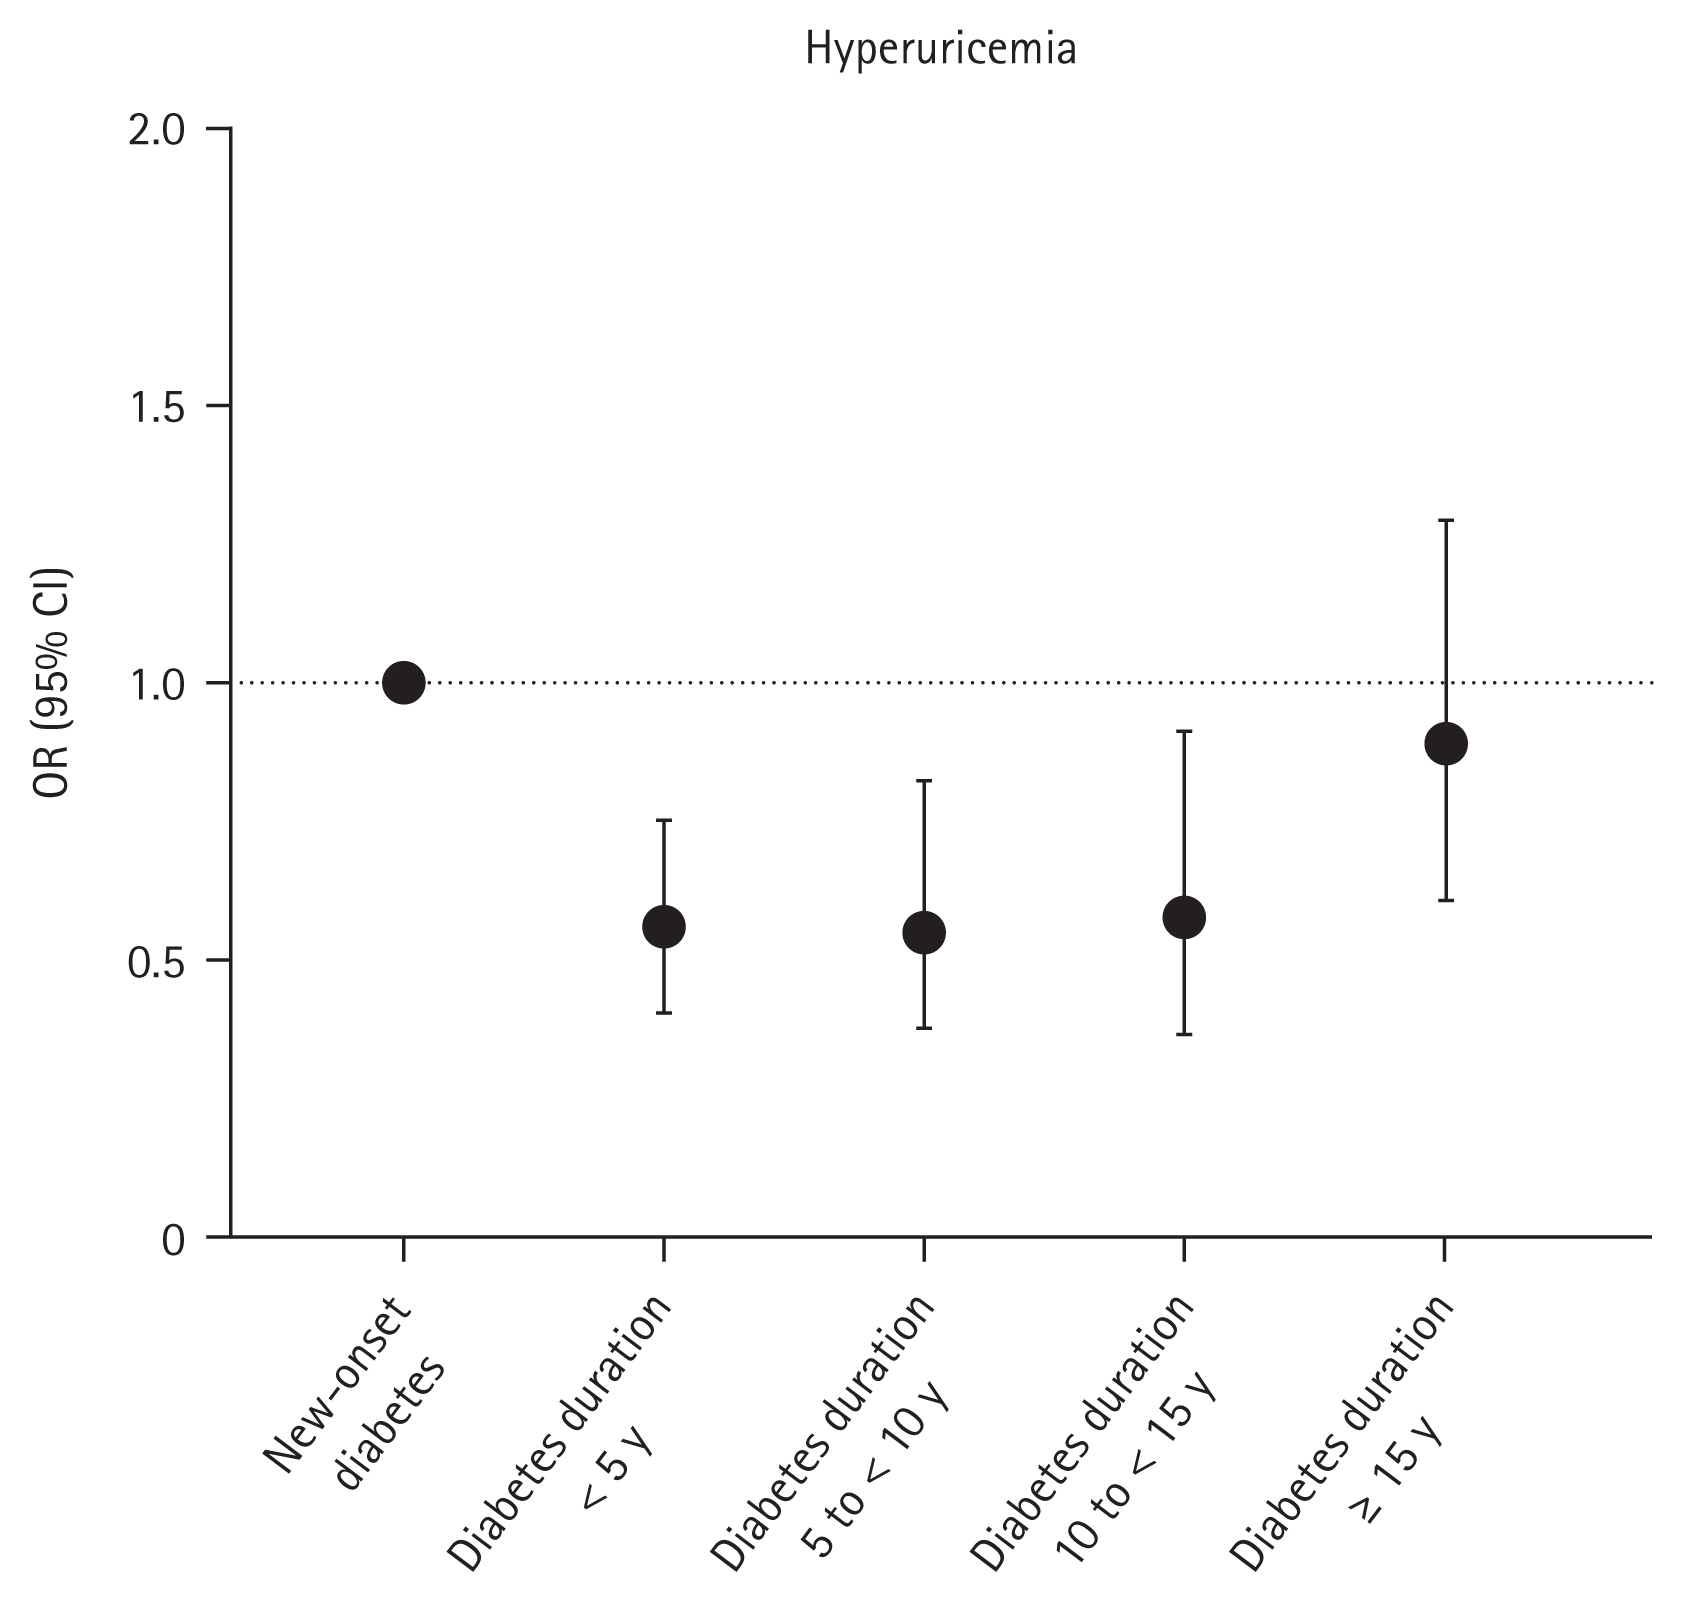
Association between diabetes duration and hyperuricemia. ORs with 95% CIs are presented as dot and whisker plots after adjusting for covariates: age, sex, income (Q1), smoking status, alcohol consumption, regular exercise, hypertension, dyslipidemia, and chronic kidney disease. OR, odds ratio; CI, confidence interval.
Subgroup analyses according to age, sex, BMI, and CKD
The relationship between diabetes duration and hyperuricemia did not demonstrate significant interactions with age, sex, BMI, or CKD, instead showing a consistent OR trend across these factors (Table 3).
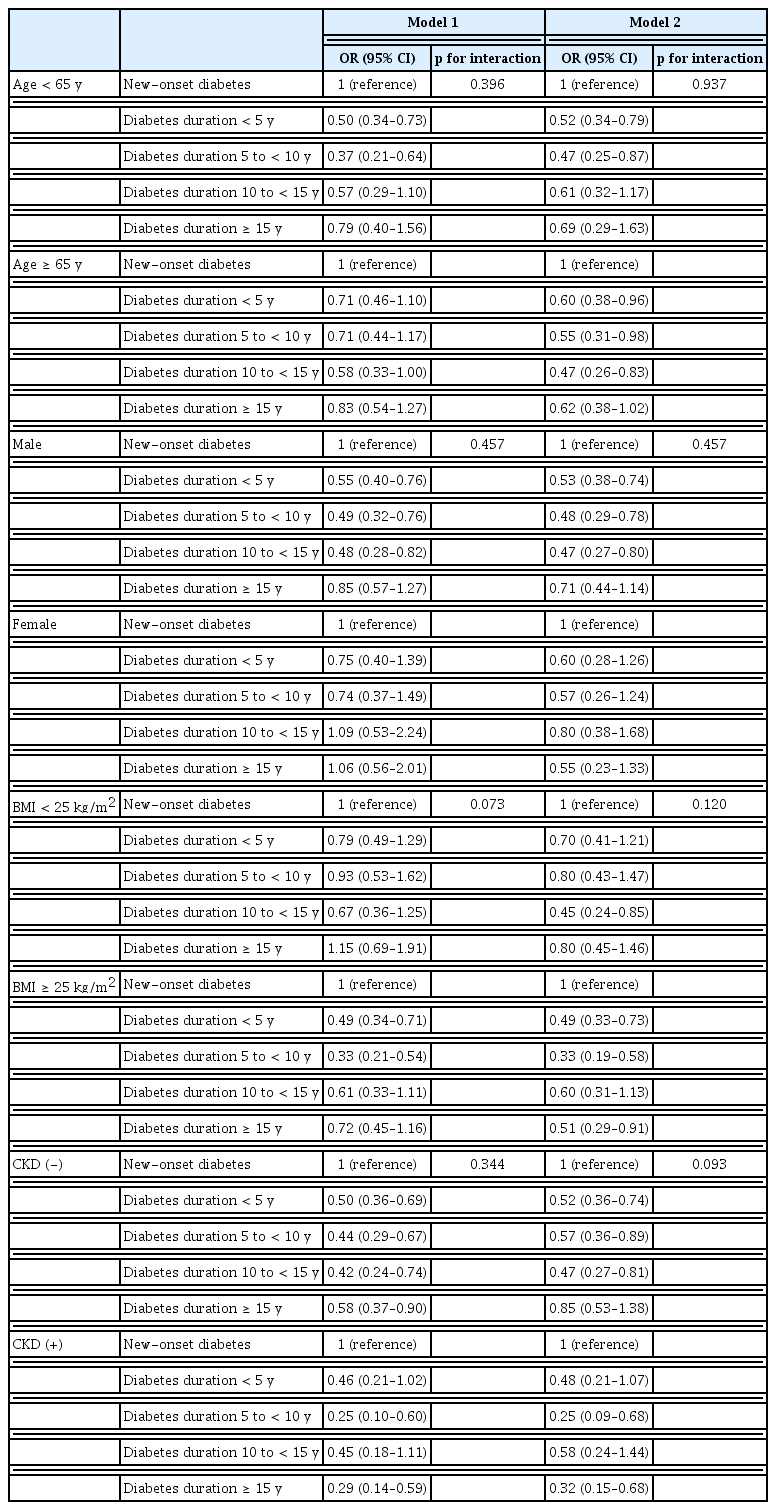
Association between diabetes duration and hyperuricemia stratified by age, sex, BMI, and CKD
DISCUSSION
In this study, we investigated the association between diabetes duration and hyperuricemia. These are the main findings. First, the prevalence of hyperuricemia was 10% in Korean adults with T2DM. Second, the U-shaped association between diabetes duration and hyperuricemia was observed, particularly in those with a diabetes duration 5 to < 10 years who showed a 45% decreased prevalence of hyperuricemia compared to those with new-onset diabetes. Third, this U-shaped association was consistently observed in subgroup analyses according to sex, age, BMI, and CKD.
In this study, hyperuricemia was defined as a serum uric acid level ≥ 7.0 mg/dL, and the prevalence of hyperuricemia in subjects with T2DM was 10%. A previous study using data from the 2016 KNHANES reported a prevalence of hyperuricemia of 13.3% in those with T2DM when hyperuricemia was defined as a serum uric acid level ≥ 7.0 mg/dL in male and ≥ 6.0 mg/dL in female [24]. Differences in the definition of hyperuricemia and duration of data collection may have caused the discrepancies in prevalence between studies.
There have been several studies that demonstrated associations between diabetes and hyperuricemia, some positive associations [12,14] and some negative [16,17]. However, the association between diabetes duration and hyperuricemia has not been well-studied. In this study, we found the U-shaped association between diabetes duration and hyperuricemia. A plausible explanation for this finding is that as diabetes duration increased, higher glucose inhibited uric acid reabsorption in the proximal tubule of the kidney [25,26]. Alternatively, metformin, the mainstay of T2DM treatment, may reduce serum uric acid levels [27,28]. Metformin activates 5’-adenosine monophosphate-activated protein kinase, inhibiting gluconeogenesis [29]. This inhibition leads to reduced fatty acid and uric acid synthesis, decreasing serum uric acid levels [30]. We found no significantly decreased resence of hyperuricemia in those with diabetes duration ≥ 15 years. Considering results from a previous study in which eGFR ≥ 60 mL/min/1.73 m2 was negatively associated with hyperuricemia [31], a higher prevalence of CKD in those with diabetes duration ≥ 15 years in this study may have affected the results. However, even after multivariable adjustment including CKD, there was no significant decreased prevalence of hyperuricemia in those with diabetes duration ≥ 15 years. Alternatively, by following the Korean Diabetes Association consensus statement that recommends discontinuation of metformin in subjects with eGFR < 30 mL/min/1.73 m2 [32], the proportion of metformin users may be decreased in those with diabetes duration ≥ 15 years. Exclusion of the uric acid lowering effect of metformin in this group may have affected the results.
In this study, we found no significant interaction of BMI in the association between diabetes duration and hyperuricemia. However, considering previous studies that have demonstrated an association between HOMA-IR and hyperuricemia [33,34], as well as the trend of decreasing HOMA- IR with increasing diabetes duration observed in our study, we cannot exclude the potential confounding effect of insulin resistance on the association between diabetes duration and hyperuricemia.
The present study has several limitations. First, because this was conducted as a cross-sectional study, a causal relationship could not be established. Second, we were unable to adjust for confounding factors that could influence serum uric acid levels, such as underlying diseases, insulin resistance, medications, or dietary intake. Third, the findings cannot be generalized to other races or ethnicities. However, despite these limitations, this study is the first to evaluate the prevalence of hyperuricemia according to diabetes duration in a representative sample of Korean adults. In addition, considering that old age, male sex, higher BMI, and renal dysfunction can increase serum uric acid levels [35–39], subgroup analyses were conducted according to age, sex, BMI, and CKD.
In conclusion, the U-shaped association was found between diabetes duration and hyperuricemia; in particular, those with diabetes duration 5 to < 10 years showed 45% decreased prevalence of hyperuricemia. This association was consistently observed regardless of age, sex, BMI, and CKD. Further studies that evaluate additional variables such as underlying diseases, insulin resistance, medications, or dietary intake are needed.
KEY MESSAGE
1. The prevalence of hyperuricemia was 10% in Korean adults with T2DM.
2. The U-shaped association between diabetes duration and hyperuricemia was observed.
Notes
CRedit authorship contributions
Kyuho Kim: conceptualization, methodology, investigation, data curation, formal analysis, validation, writing - original draft, writing - review & editing, visualization; Kyungdo Han: conceptualization, methodology, resources, investigation, data curation, formal analysis, validation, writing - original draft, writing - review & editing, visualization; In Young Kim: methodology, resources, investigation, data curation, formal analysis, validation; Kyuna Lee: methodology, resources, investigation, data curation, formal analysis, validation, visualization; Yu- Bae Ahn: methodology, resources, investigation, data curation, formal analysis, validation; Seung-Hyun Ko: methodology, resources, investigation, data curation, formal analysis, validation; Jae-Seung Yun: conceptualization, methodology, resources, investigation, formal analysis, validation, writing - original draft, writing - review & editing, supervision, project administration
Conflicts of interest
The authors disclose no conflicts.
Funding
None
Data availability
Data cannot be shared publicly due to the violation of patient privacy and the absence of informed consent for data sharing.