Hemodialysis vascular access infections: epidemiology and risk factors for treatment failure
Article information

Abstract
Background/Aims
Infection remains the second leading cause of mortality in patients with end-stage renal disease (ESRD). Despite the direct relationship between hemodialysis vascular access-related infections (HD-VARI) and both prognosis and mortality in ESRD patients, there is a paucity of research in this area.
Methods
This retrospective study was performed at a tertiary care hospital in Seoul, Korea, from 2009 to 2020. Medical records of adult patients diagnosed with HD-VARI were assessed. We analyzed the distribution of microorganisms, clinical characteristics according to vascular access type, and evaluated risk factors for treatment failure.
Results
Data from a total of 367 patients were included over the 12-year study period. Based on vascular access type, 293 (79.8%) had arteriovenous graft infections, 29 (7.9%) had arteriovenous fistula infections, and 45 (12.3%) had tunneled cuffed catheter infections. Thirty-one (8.4%) patients experienced treatment failure within 90 days. Multivariate analysis identified male sex (odds ratio [OR], 2.343; 95% confidence interval [CI], 1.041–5.274) and metastatic infection (OR, 4.297; 95% CI, 1.516–12.178) as independent predictors of 90-day infection-related treatment failure. Subtotal or total excision (removal) of the infected vascular access significantly decreased the risk of 90-day infection-related treatment failure (OR, 0.337; 95% CI, 0.129–0.876).
Conclusions
Removal of infected vascular access played a crucial role in reducing infection-related deaths or relapses within 90 days. Management of vascular access infection should be individualized based on patient-specific factors.

INTRODUCTION
The number of patients receiving hemodialysis continues to rise annually, with 110,443 hemodialysis patients registered in Korea according to the 2024 Korean Renal Data System (KORDS) [1]. Among these patients, 25.8% had been hospitalized within one year, with infection being the most frequent cause of hospitalization. Furthermore, infection was the second most common cause of death among all dialysis patients, accounting for 23% of deaths in this population. Although KORDS does not specify the cause of infection, it is recognized that hemodialysis vascular access-associated infection represents a major clinical challenge [2].
Arterio-venous (AV) access is recommended over a dialysis catheter due to its lower infection risk. Recent research indicates that the incidence of tunneled cuffed catheter (TCC) infections is five to ten times higher than that of arteriovenous fistula (AVF) or arteriovenous graft (AVG) infections [3–6]. Hospitalization and mortality rates are elevated in patients undergoing dialysis with catheters, primarily due to increased cases of bacteremia [7]. Despite the established infection risks, a considerable number of patients continue to receive dialysis using a graft or catheter. Although hemodialysis vascular access-related infections (HD-VARI) are closely associated with prognosis and mortality among patients with end-stage renal disease, there are limited studies addressing this issue. Therefore, our objective was to investigate the clinical and microbiological features, as well as the outcomes, of HD-VARI.
METHODS
Study population
We retrospectively reviewed all adult patients hospitalized due to HD-VARI at a 750-bed tertiary medical institution in Seoul, Korea, from January 1, 2009 to December 31, 2020. Medical records of patients diagnosed with HD-VARI according to the 10th edition of the International Classification of Diseases (ICD-10) code T82.7 were obtained at the time of discharge. Exclusion criteria included patients less than 19 years of age or those with a history of prior HD-VARI.
Demographic and clinical characteristics collected included age, sex, admission and discharge dates related to vascular access infection, the year hemodialysis commenced, underlying cause of kidney failure, presence of comorbidities, date of vascular access infection diagnosis, the presence of metastatic complications, vital signs and laboratory data at hospitalization, type of vascular access, access site, date of catheter insertion or creation, date of blood culture, nasal screening for methicillin-resistant Staphylococcus aureus, organisms isolated from blood or wound cultures (including material from removed vascular access, pus, aspirated perigraft fluid, or intraoperative tissue), antibiotic therapy type and duration, surgical intervention date for vascular access infection, surgical type, last follow-up date, and clinical outcomes.
Definitions
AV access infection was defined by the presence of clinical indicators such as erythema, tenderness, skin breakdown, purulent drainage, or graft exposure. For patients who developed fever or bacteremia without an identified infectious source, the infection was attributed to the AV access. Duplex ultrasonography was utilized when confirmation or determination of the extent of infection was necessary, and the presence of a peri-access fluid collection or pseudoaneurysm was considered diagnostic in those exhibiting suspected symptoms or signs of infection [8,9]. Hemodialysis catheter-related infection was identified by the occurrence of clinical evidence with a positive culture result from either blood or a catheter-related wound, including the catheter segment, in the absence of another evident source. Additionally, patients displaying hyperemia, induration, tenderness, or purulent discharge around the exit site or along the subcutaneous tunnel were classified as having catheter-related infection, even if culture results were negative [10].
Metastatic infections were characterized by the presence of a simultaneous infection at a location distant from the primary site that resulted from hematogenous dissemination [11]. Determination of whether an infection present alongside a vascular access infection represented hematogenous spread or was independent relied on clinical assessment, frequently following consultation with infectious disease specialists.
Recurrent infection was defined as the reappearance of symptoms or signs of infection at the same site, necessitating re-hospitalization for antibiotic therapy or further surgical intervention.
Infection-related death was determined as death directly attributable to infection or resulting from infectious complications, such as organ failure or septic shock. Treatment failure within 90 days was defined as either infection-related death or recurrence of infection at the same vascular access site.
Management and patient follow-up
Surgical intervention for HD-VARI was categorized into three groups: total excision (removal), partial excision, and incision and drainage (I&D). For AVG infections, both total and subtotal excision procedures were evaluated together as a single classification. Total graft excision, including anastomosis and likely arterial repair, is indicated in patients with severe sepsis or when the entire graft is bathed in pus. Subtotal graft excision involves leaving a remnant of the oversewn small cuff of prosthetic material on an underlying patent artery. Partial graft excision refers to when only a limited portion of the infected graft is removed, and a new graft is rerouted through adjacent sterile tissue to maintain the patency of the original graft [12].
Catheter removal was regarded as equivalent to total excision. The attending physicians exercised their clinical judgment when deciding upon catheter removal.
For this analysis, the term subtotal/total excision (removal) encompassed both subtotal or total excision of AVG/AVF and removal of catheters.
Statistical analysis
Statistical analyses were conducted using IBM SPSS Statistics for Windows (version 20.0; IBM Corp., Armonk, NY, USA). Categorical variables are reported as numbers (%) and continuous variables as median (interquartile range [IQR]). Chi-square or Fisher’s exact tests were applied for comparing categorical variables between two groups, as appropriate. For continuous variables, the Student’s t-test and Mann–Whitney U test were applied to compare groups with normal and non-normal distributions, respectively. For continuous variables across three or more groups with normal distributions, one-way analysis of variance was used, whereas the Kruskal-Wallis test was applied when distributions were non-normal. Distribution normality was evaluated using the Shapiro-Wilk test. Risk factors for treatment failure within 90 days were assessed by multivariate analysis using binary logistic regression models with the stepwise backward selection method. All variables with p values < 0.10 in univariate analysis, as well as antibiotic duration (< 2 weeks), were included in the multivariate logistic regression model. To avoid overfitting in multiple logistic regression, independent variables with fewer than 5 cases for each variable (septic shock, intensive care unit [ICU] care) were excluded [13]. All significance tests were two-tailed, with p values < 0.05 considered statistically significant.
Ethics statement
This study was approved by the Institutional Review Board of Soonchunhyang Seoul University Hospital (IRB No. 2020-11-03), which waived the need for informed consent owing to the retrospective study design.
RESULTS
Patient characteristics
Over the 12-year study period, 675 adult patients were evaluated for HD-VARI, resulting in 367 being included in the analysis. Of these, 308 were excluded: 265 due to prior or recurrent dialysis vascular access infections, 34 due to infections related to non-dialysis catheters, such as chemotherapy ports, and 9 due to non-infectious vascular access complications.
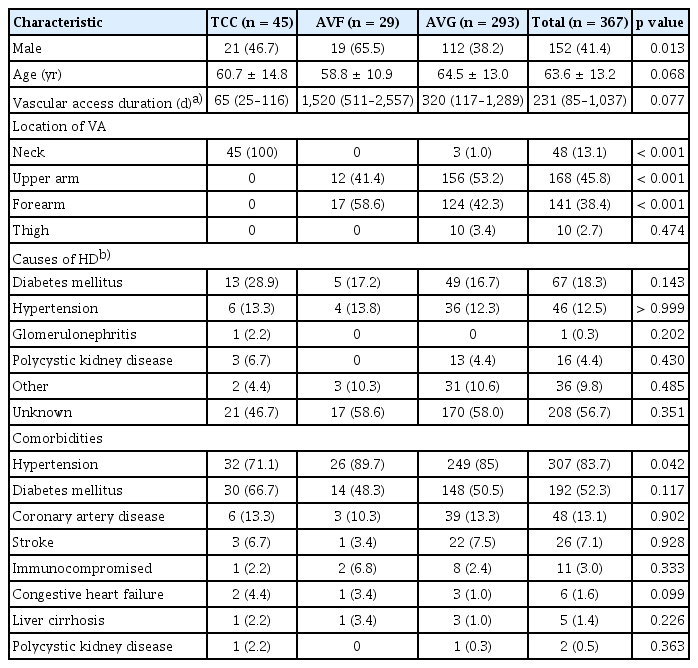
The study population had a median age of 64 years (IQR, 55–73 yr), with males comprising 41.4%. The median hospital stay was 13 days (IQR, 7–24 d). The leading cause of dialysis initiation was unknown (56.7%), followed by diabetes mellitus (18.3%) and hypertension (12.5%). The mean time from hemodialysis initiation to admission for vascular access infection was 6.6 years (standard deviation [SD], ± 6.8 yr). Hypertension was the most prevalent comorbidity (83.6%), with diabetes mellitus present in 52.3%. Five patients had received kidney transplantation, but three of these were on dialysis due to graft failure (Table 1).
Baseline characteristics of HD patients categorized by vascular access type from 2009 to 2020
Infection characteristics according to vascular access type
Among the 367 patients with HD-VARI, 45 (12.3%) had TCCs, 293 (79.8%) had AVGs, and 29 (7.9%) had AVFs. All TCCs were inserted via the internal jugular vein. AVFs were exclusively located in the upper extremities, whereas AVGs were primarily placed in the upper arm (53.2%) and forearm (42.3%), with remaining instances in the neck (1.0%) or thigh (3.4%).
Dates of vascular access placement were available for 213 of the 367 cases. Analysis of these cases showed that the median interval from vascular access placement to infection diagnosis was shortest for TCCs (65 d; IQR, 25–116 d), followed by AVGs (320 d; IQR, 117–1,289 d), and longest for AVFs (1,520 d; IQR, 511–2,557 d). Across all vascular access types, the median duration from placement to infection was 231 days (IQR, 85–1,037 d). No significant differences in underlying disease prevalence were observed across the different vascular access types.
Microbiological characteristics according to vascular access type
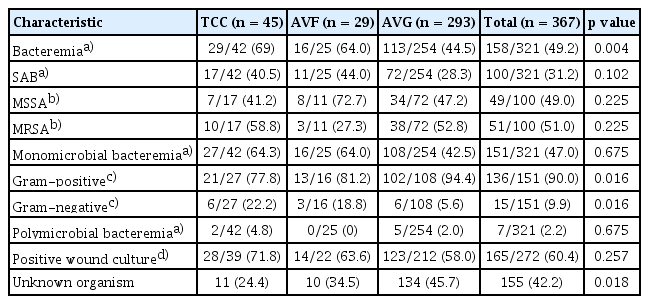
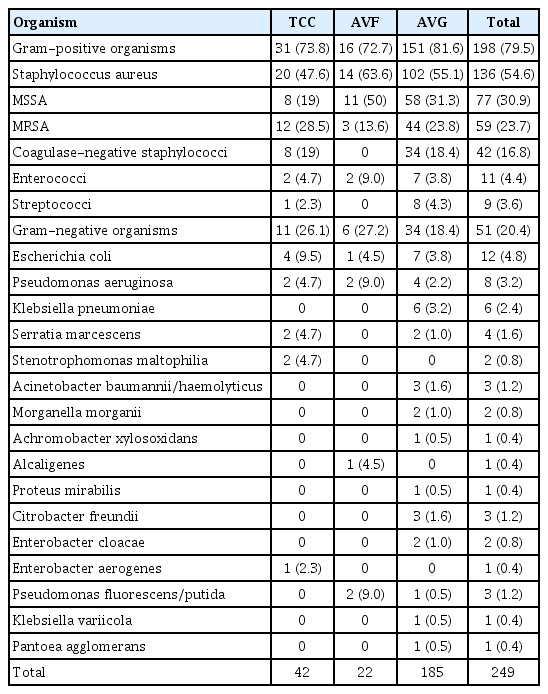
Blood cultures were obtained from 321 (87.4%) patients, with bacteremia identified in 158 (49.2%). Bacteremia was most frequently observed in patients with TCC infections (69.0%, 29/42), while the prevalence was 64.0% (16/25) in AVF infections and 44.5% (113/254) in AVGs. Of the patients with bacteremia, 151 had monomicrobial infections and seven had polymicrobial infections. Among those with monomicrobial bacteremia, 90% involved gram-positive bacteria. S. aureus was the most prevalent organism (63.3% [100/158]), with 51.0% (51/100) of these isolates demonstrating methicillin resistance. Aerobic gram-negative bacteria accounted for 15 (9.9%) cases of monomicrobial bacteremia. No cases of candidemia were identified.
Wound cultures were performed for 272 (74.1%) patients, with microorganisms detected in 165 (60.4%). The leading organism isolated was S. aureus (70.3% [116/165]), and 43.1% (50/116) of these were methicillin resistant. Coagulase-negative staphylococci (CoNS) were also frequently identified. Gram-negative bacteria were found in 25 (15.6%) patients. The most commonly isolated gram-negative species included Pseudomonas aeruginosa, Escherichia coli, and Klebsiella pneumoniae. Causative microorganisms could not be detected in 42% of the cases. Neither blood nor wound cultures were acquired for 29 patients (7.9%) (Table 2, 3).
Microbiologic characteristics according to vascular access type
Causative microorganisms according to vascular access type from 2009 to 2020
Management
All patients received antibiotic treatment. Of these, 260 (70.8%) were administered intravenous vancomycin as empiric antibiotics. Seventy-six patients (20.7%) received first-generation cephalosporin. Fluoroquinolones were administered to 12 (3.3%) patients. The median total duration of antibiotic therapy was 18 days (IQR, 12–28 d). For patients with S. aureus bacteremia (SAB) and those with metastatic infections, the median duration of antibiotic therapy was 27 days (IQR, 17–35 d) and 31 days (IQR, 20–47 d), respectively.
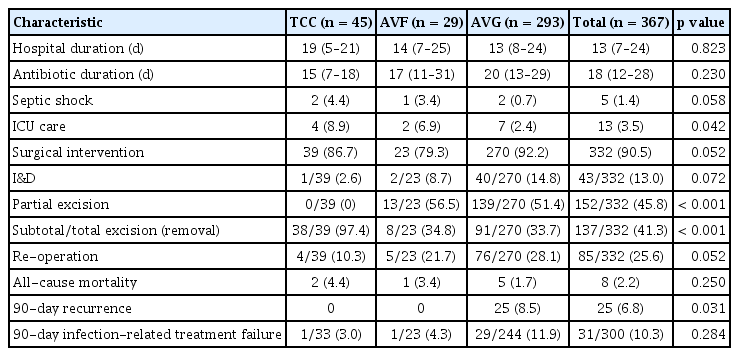
Surgical intervention was performed in 332 (90.5%) patients. Among these individuals, 13.0% underwent I&D, 45.8% received partial excision, and 41.3% underwent total or subtotal excision (removal). Additional surgical procedures were necessary for 85 (25.6%) patients. Specifically, 60.5% of those initially treated with I&D, 23.7% of those with partial excision, and 16.8% of those with subtotal or total excision (removal) required re-operation. The rate of re-operation was significantly greater among patients with AVG infections compared to those with AVF or TCC infections (p = 0.027). The median interval between the initial and subsequent procedures was 8 days (IQR, 5–12.5 d) (Table 4). Patients managed without surgery experienced shorter hospitalizations (p = 0.006) and received antibiotics for a shorter duration (p = 0.001) compared to those who underwent surgery. However, surgical intervention was not associated with all-cause in-hospital mortality (p > 0.999), 90-day recurrence (p > 0.999), or infection-related failure within 90 days (p = 0.752).
Management strategies and clinical outcomes of vascular access infection
Bacteremia and metastatic complications
The presence of bacteremia was linked to a higher risk of septic shock (p = 0.028), ICU admission (p = 0.001), and development of metastatic infection (p < 0.001). Patients with SAB experienced metastatic infections more frequently than those without SAB (21.0% vs. 8.6%; p = 0.043). Detailed comparative analyses of SAB and non-SAB groups can be found in the Supplementary Tables. Incidence of gram-negative bacteremia was notably increased in patients with TCCs (p = 0.025) and decreased in those presenting with AVG infections (p < 0.006). No significant relationship was identified between gram-negative bacteremia and 90-day treatment failure (p = 0.356) (Supplementary Table 1).
Metastatic infection was identified in 31 (8.4%) patients. Septic lung involvement occurred in 23 patients, representing the most frequent manifestation. Vertebral osteomyelitis and infective endocarditis were each recorded in 5 patients. The prevalence of metastatic infection did not significantly vary by type of vascular access (p < 0.889). Regarding microbiological findings, 21 cases were due to SAB. Including 3 additional patients with S. aureus detected in other cultures despite negative blood cultures, 77% of metastatic infections were attributable to S. aureus. Metastatic infection was documented in 21% of SAB patients, 33% of those with Enterococcus spp. bacteremia, and 12.5% of individuals with gram-negative bacteremia.
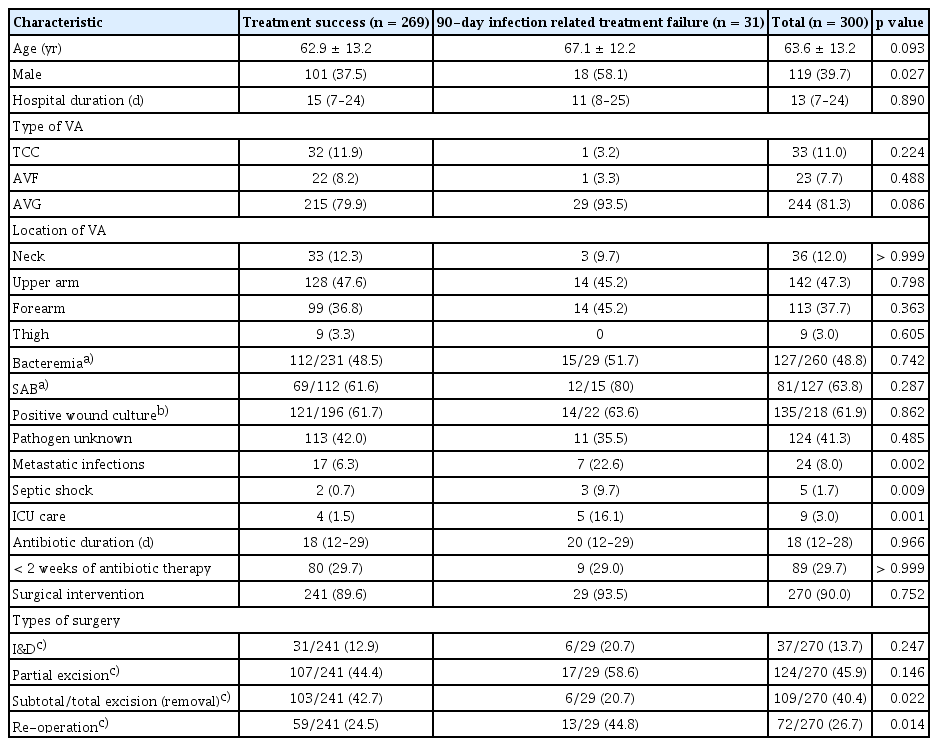
Clinical outcomes and risk factors of treatment failure
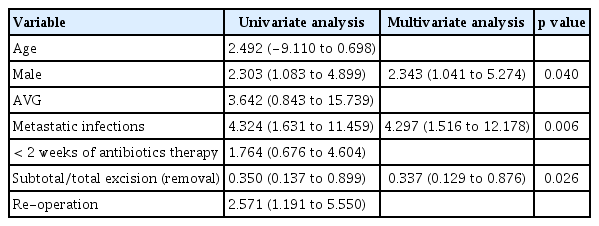
The hospital mortality rate was 2.2%, while infection-related mortality was 1.6%. Recurrent infections occurred in 25 patients within 90 days following the initiation of antibiotic therapy or surgical intervention. Patients with metastatic infections had a significantly higher 90-day treatment failure rate (p = 0.002). Failure was also associated with not receiving subtotal/total excision (removal) as the initial surgical approach (p = 0.022) and with the necessity for re-operation (p = 0.014) (Table 5). In the multivariate analysis, male sex (odds ratio [OR], 2.343; 95% confidence interval [CI], 1.041–5.274; p = 0.040) and the presence of metastatic infection (OR, 4.297; 95% CI, 1.516–12.178; p = 0.006) independently predicted 90-day infection-related treatment failure. The total or subtotal excision (removal) of infected vascular access significantly decreased the risk of infection-related treatment failure within 90 days (OR, 0.337; 95% CI, 0.129–0.876; p = 0.026) (Table 6). Antibiotic treatment for less than 2 weeks was not statistically associated with an increased risk of 90-day infection-related treatment failure. Nevertheless, subgroup analysis among bacteremic patients showed that antibiotic therapy of less than 2 weeks significantly increased the risk of 90-day infection-related treatment failure (10.7% vs 33.3%, p = 0.016) (Supplementary Table 2).
Risk factors associated with 90-day infection-related treatment failure
Univariate and multivariate analyses of risk factors for 90-day infection-related treatment failure
DISCUSSION
In this study, S. aureus was found to be the predominant pathogen in HD-VARI, with a greater frequency of bacteremia observed in TCC compared to AVF or AVG. SAB was linked to a higher risk of metastatic infection, which contributed to increased mortality and recurrence. Subtotal/total excision (removal) was independently associated with a lower risk of recurrence and infection-related death.
A prior investigation at our institution of 224 patients with vascular access infections (May 2003 to March 2010) reported 62.5% developed SAB, which was closely linked to septic pulmonary embolism. Complications related to vascular access infection occurred in 16% of that cohort, with an infection-related mortality rate of 5.4% [14]. While both studies were conducted at the same center, the present study encompasses a longer follow-up period and a larger cohort. Furthermore, the analysis extends beyond metastatic complications to evaluate risk factors for treatment failure, defined as infection-related death or recurrence at the same vascular access site.
According to surveillance data from the 2017–2020 Emerging Infections Program (EIP) in the United States, the incidence of SAB was 4.3 times higher in patients with central venous catheters compared with those with AVFs or AVGs [15]. Consistent with these previous findings, S. aureus remained the predominant pathogen in the current study.
The optimal duration of antibiotic therapy for AV access infections remains unclear. The Kidney Disease Outcomes Quality Initiative (KDOQI) recommends basing the duration on the extent of the vascular access infection and any surgical intervention performed. In cases of extensive AV access infections involving the artery and vein, a duration of 6 weeks or extended antibiotic therapy is recommended, similar to the approach for endocarditis [10].
AVF infections generally respond more favorably to antibiotics than AVG infections. The European Best Practice Guidelines (EBPG) recommend at least 2 weeks of appropriate antibiotic therapy for AVF infection if there is no fever or bacteremia. For cases presenting with fever and/or bacteremia, appropriate intravenous antibiotics should be given for 2 weeks [16]. Updated guidelines from the European Society for Vascular Surgery now recommend a 6-week antibiotic regimen for primary AVF infection, although supporting data are limited [17].
For the management of AVG infections, the EBPG recommends administering 2 weeks of appropriate intravenous antibiotics followed by an additional 4 weeks of oral antibiotics [16]. A recent review on prosthetic vascular graft infections recommends applying standardized medical treatment protocols and highlights the need for optimal surgical intervention, followed by a 6-week postoperative antibiotic regimen [18]. The use of oral antibiotics may be appropriate if agents with good bioavailability are accessible. However, no clear guidance exists on adjusting antibiotic course duration according to the extent of surgical intervention.
In our study, while the duration of antibiotic therapy was generally longer for graft infections compared to other types of vascular access, the difference did not reach statistical significance. Although a shorter course of antibiotics was used compared to those recommended in current guidelines, we observed no significant correlation between antibiotic therapy duration and infection-related 90-day treatment failure (p = 0.890).
Nonetheless, it should be noted that, owing to the retrospective study design, we could not ascertain whether patients transferred to alternative dialysis centers after hospital discharge subsequently received additional antibiotic therapy, potentially resulting in longer antibiotic courses than documented. Despite these limitations, our findings indicate it may be feasible to shorten the antibiotic duration relative to other prosthetic graft infections.
We observed a decreased risk of 90-day treatment failure following subtotal/total excision (removal). A prior meta-analysis involving eight studies demonstrated a significant increase in both the recurrent graft infection rate (OR, 0.23; 95% CI, 0.13–0.41; p < 0.00001) and re-operation rate for infection control (OR, 0.14; 95% CI, 0.03–0.58; p < 0.007) in cases where partial graft excision was performed [19]. Consistently, a separate study found that total excision in AVG infections led to fewer recurrences of infection compared to partial excision (5.9% vs. 31.2%). Nonetheless, a median of 90 days of tunneled or non-tunneled catheter use was needed after total graft excision [20].
In summary, total graft excision demonstrated effective infection control, but partial graft excision may prevent the need for temporary dialysis access and maintain existing vascular access. Consequently, it is important to tailor the surgical approach to the patient’s vascular access strategy and optimize antibiotic therapy concurrently.
Clinicians must thoroughly evaluate for metastatic infections during the management of vascular access infection, as these are linked to elevated mortality rates [11]. In this study, up to four deaths (12.9%) were documented during hospitalization among 31 patients who developed metastatic infections. Given the tendency of metastatic infections to recur, rigorous efforts are essential to detect early recurrence. Because S. aureus infection is closely associated with the development of metastatic infection [11], vigilant monitoring for new symptoms, including those in sites remote from the vascular access, is especially warranted when patients have SAB.
The retrospective nature of this study and its single-center design represent limitations, potentially restricting generalizability to other populations. Nevertheless, our considerable experience with vascular access-related infections is supported by the performance of over 3,000 vascular access procedures and surgeries annually at our institution.
In conclusion, it is crucial that clinicians rigorously assess patients for metastatic infections, with particular attention to those with SAB, to reduce treatment failure. Antibiotic duration should be tailored to the patient’s clinical status. Subtotal/total excision (removal) should be regarded as a primary intervention in patients considered at heightened risk of treatment failure. Furthermore, individuals not undergoing complete excision should be observed closely for recurrence following discharge. The management of infections in dialysis vascular access is uniquely challenging due to the inability to offer dialysis-free intervals and the occurrence of complications from repeated cannulation and interventions. For this reason, early detection and intervention in dialysis patient infections are critical. A patient-specific therapeutic strategy is necessary to limit further procedures.
KEY MESSAGE
1. S. aureus was identified as the predominant pathogen responsible for dialysis vascular access infections, demonstrating a significant correlation with metastatic complications, increased mortality, and recurrence.
2. Infection-related treatment failure within 90 days, defined as death or recurrence, occurred in 8.4% of patients.
3. Infection-related treatment failure showed an independent association with metastatic infection; however, subtotal or total excision (removal) of the infected access was associated with a significant reduction in failure rates.
Notes
CRedit authorship contributions
Shi Nae Yu: conceptualization, investigation, data curation, formal analysis, validation, writing - original draft, visualization; Eunjung Lee: conceptualization, methodology, investigation, validation, writing - review & editing, supervision, funding acquisition; Se Yoon Park: investigation, validation, writing - review & editing; Oh-Hyun Cho: validation, writing - review & editing; Sangchul Yun: investigation, writing - review & editing; Tark Kim: writing - review & editing; Min Seo Kang: writing - review & editing; Yae Jee Baek: writing - review & editing; Jongtak Jung: writing - review & editing; Tae Hyong Kim: writing - review & editing
Conflicts of interest
The authors disclose no conflicts.
Funding
This work was supported by the National Research Foundation of Korea grant funded by the Korea government (No. RS-2022-NR074472), This work was supported by the National Research Foundation of Korea grant funded by the Korea government (No. RS-2023-00219563), This work was funded by Soonchunhyang University.