Global burden of adverse effects of medical treatment from 1990 to 2021: a Global Burden of Disease Study 2021
Article information
Abstract
Background/Aims
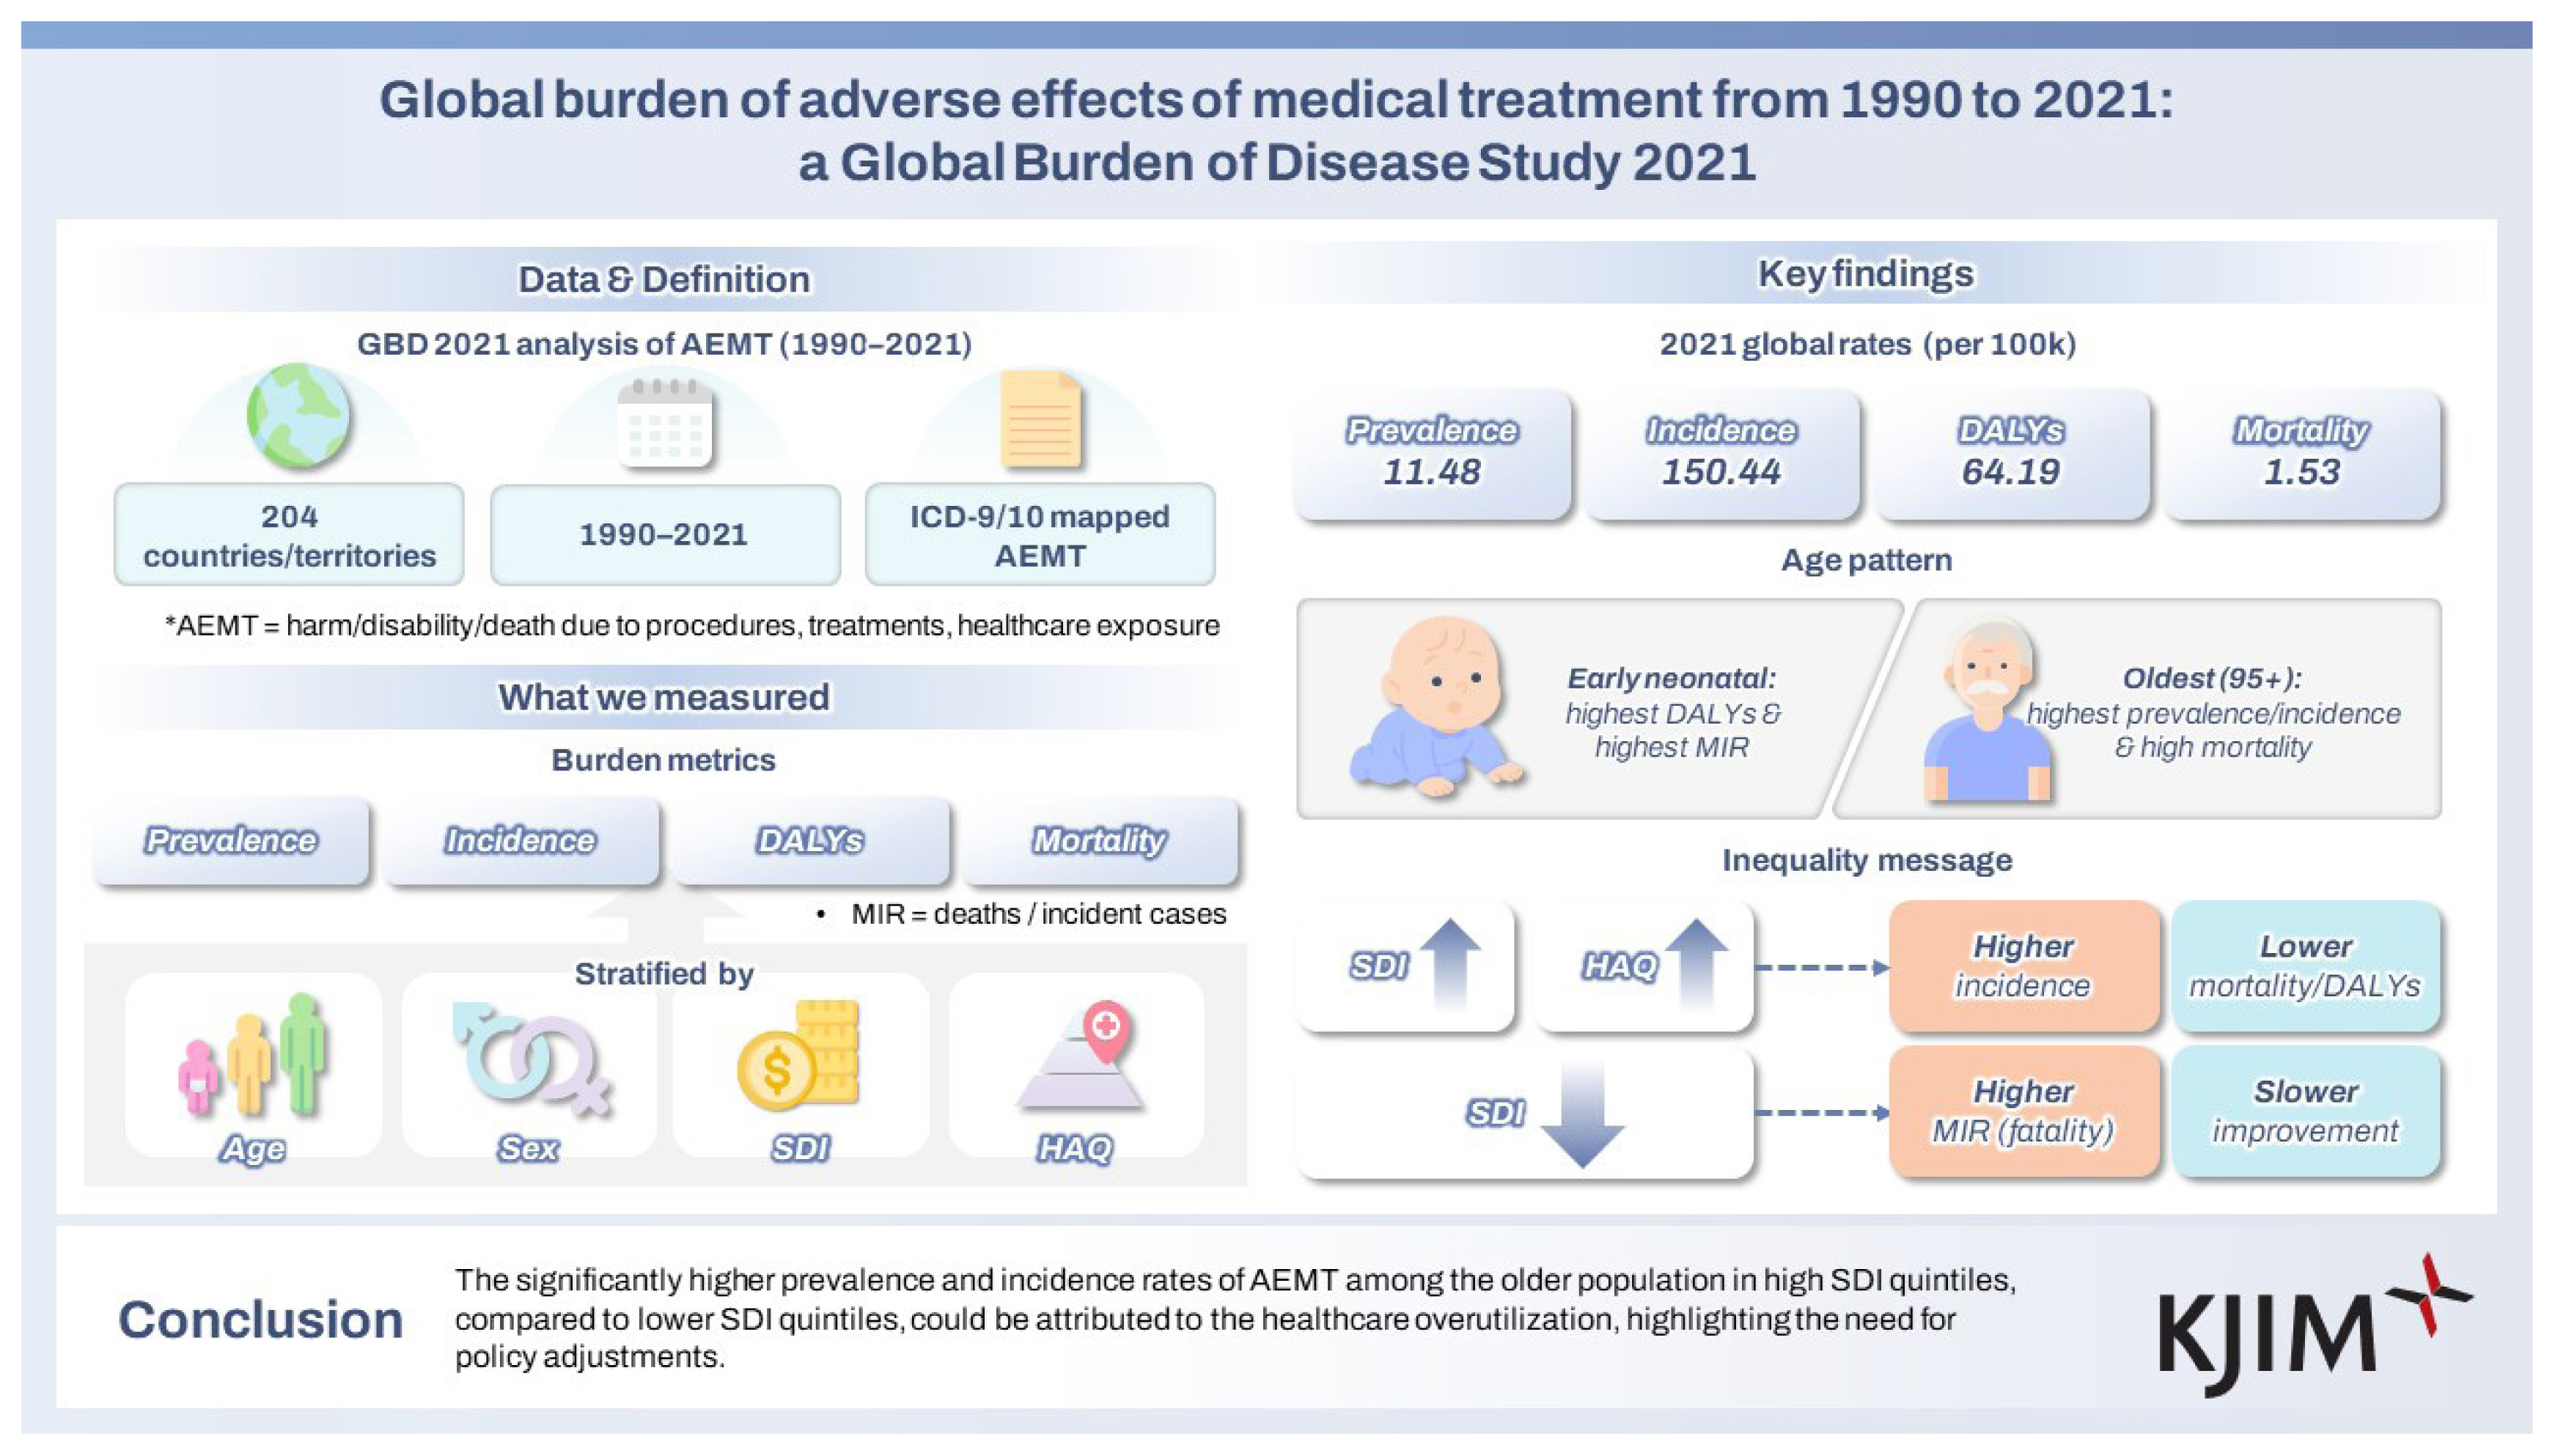
This study aims to evaluate the global burden of adverse effects of medical treatment (AEMT) using data from the Global Burden of Disease Study (GBD) 2021.
Methods
Data were extracted from the GBD 2021, covering 204 countries/territories from 1990 to 2021. AEMT was defined using ICD-9 and ICD-10 codes, encompassing complications from medical procedures, treatments, or healthcare exposures. Estimates were categorized into fatal and non-fatal outcomes and stratified by age, sex, year, and covariates, including the Socio-demographic Index (SDI). Mortality-incidence ratios (MIRs), defined as the ratio of mortality calculated by dividing the number of deaths by the total incident cases, were analyzed.
Results
In 2021, the global age-standardized prevalence, incidence, disability-adjusted life years (DALYs), and mortality rates of AEMT were 11.48 (95% uncertainty interval [UI], 8.86–14.13), 150.44 (131.19–171.81), 64.19 (51.06–73.11), and 1.53 (1.29–1.68) per 100,000 population, respectively. DALY rates were highest in the early neonatal group (4,789.47 per 100,000 population [95% UI, 3,682.00–5,963.30]), while mortality rates followed a U-shaped pattern across age groups. In 2021, MIRs were highest at both ends of the age range: the early neonatal group (0.58 [95% UI, 0.55–0.58]) and the 95+ age group (0.05 [0.04–0.06]). This pattern was consistent across all SDI quintiles, with higher MIRs observed in lower SDI quintiles.
Conclusions
The significantly higher prevalence and incidence rates of AEMT among the older population in high SDI quintiles, compared to lower SDI quintiles, could be attributed to the healthcare overutilization, highlighting the need for policy adjustments.
INTRODUCTION
The initial investigation of adverse effects of medical treatment (AEMT) commenced with the Harvard Medical Practice Study (HMPS) in 1984, with findings published in 1991 [1]. This research laid the foundation for the Institute of Medicine to release “To Err is Human: Building a Safer Health System” in 1999 [2]. This study highlighted significant patient safety challenges and prompted further research. Subsequent investigations revealed the substantial burden of AEMT, particularly in the United States, where medication errors are the third leading cause of death [3]. The economic impact of medication errors is considerable, with avoidable adverse drug effects constituting a large portion of this burden [4]. Moreover, healthcare-related patient harm accounts for approximately 10–15% of total healthcare expenditures [5].
To mitigate its economic burden and improve patient safety, the World Health Organization (WHO) initiated three Global Patient Safety Challenges: “Clean Care is Safer Care” and “Safe Surgery Saves Lives” in 2004, followed by “Medication Without Harm” in 2017 [6]. Furthermore, following the HMPS study, the medical record system was revised to identify triggers of adverse events, and the implementation of electronic health records was intended to enhance patient safety [7]. However, the lack of quantitative measures hinder the assessment of patient safety improvements, and insufficient routine documentation of adverse drug events in clinical practice further impedes the efforts to enhance patient safety [7].
AEMT remains a major contributing factor to morbidity and mortality [8]. However, no global studies have yet addressed the impact of AEMT as a worldwide burden, leading to a gap that hinders the ability to evaluate current initiatives and interventions related to AEMT. Such evaluation is critical for the insights for effectively addressing its global burden in future healthcare strategies. Therefore, this study aims to provide comprehensive estimates of the prevalence, incidence, disability-adjusted life years (DALYs), and mortality from 1990 to 2021, stratified by age, sex, geographical locations, Socio-demographic Index (SDI) levels, and Healthcare Access and Quality (HAQ) Index using data from the Global Burden of Disease, Injuries, and Risk Factors Study (GBD) 2021. This manuscript was produced as part of the GBD Collaborator Network and in accordance with the GBD Protocol.
METHODS
GBD 2021 overview
The GBD 2021 provides comprehensive estimates of global risk exposure and health losses due to risks, including AEMT. It is based on relevant indicators from 204 countries and regions, classified into 21 regions and 7 super-regions for the years 1990 to 2021. The GBD 2021 calculated the numbers and rates of prevalence, incidence, mortality, DALYs, years lived with disability (YLDs), and years of life lost (YLLs), with estimates organized according to a cause list [9]. The GBD cause list is hierarchically structured from level 1 to level 6, and for the 2021 study, it has been expanded to 371 causes. Additionally, data is provided by sex and age, covering the lifespan from birth to over 95 years, with the 2021 update further subdividing the under-5 age group into four categories, including a neonatal group. This study adheres to the Guidelines for Accurate and Transparent Health Estimates Reporting (GATHER) guidelines [10], and further details can be found in Supplementary Appendix 1.
Case definition
Within the GBD 2021 hierarchy, injuries are categorized as a Level 1 condition. AEMT is classified as a Level 3 cause under the Level 1 category of ‘injuries’ and the Level 2 category of ‘unintentional injuries’. All input data were mapped to the GBD causes through ICD mapping, specifically utilizing International Classification of Diseases, Ninth Revision (ICD-9) and International Statistical Classification of Diseases and Related Health Problems, Tenth Revision (ICD-10) codes. For AEMT, the mapping process was divided into fatal and non-fatal estimates [11], with a detailed classification of ICD-9 and ICD-10 codes for each category. The complete list of ICD codes mapped to AEMT is available in Supplementary Appendix 1, p. 64–123.
Overall, AEMT is defined as death or short-term or longterm disability sustained as the result of undergoing a procedure, treatment, or other exposure to the health-care system. These encompass adverse drug events (e.g., Reye’s syndrome), surgical and perioperative complications (e.g., postsurgical hypoinsulinemia), misadventure (e.g., accidental puncture or laceration of the dura during a procedure), adverse outcome from medical management (e.g., transfusion-related acute lung injury), and complications linked to medical or surgical devices (e.g., nervous system complications from surgically implanted devices) [12].
Fatal outcome estimation
Mortality rates were estimated using the cause of death ensemble model (CODEm), a methodology developed by the GBD study for analyzing cause-specific mortality [9]. CODEm utilizes out-of-sample predictive validity testing of statistical models and covariate permutations (Supplementary Appendix 1, p. 14–15). The mortality rates for AEMT were estimated using 3,653 data sources, including vital registration, verbal autopsies, and mortality surveillance, covering the period from 1990 to 2021. To ensure consistency across cause-specific models, the CoDcorrect algorithm was employed to derive the final burden estimates (Supplementary Appendix 1, p. 15). The generated mortality estimates include YLLs, calculated by multiplying the number of deaths by the standard life expectancy for each age group, stratified by cause, age, sex, location, and year.
Additionally, the mortality-incidence ratios (MIRs) were utilized as an indicator to specifically assess the lethality of AEMT within certain populations [13]. The MIR was calculated as the ratio of the number of deaths due to the AEMT to the total number of incident cases (Supplementary Appendix 1, p. 32–35). The MIRs for AEMT can vary significantly based on several factors, including the medical characteristics of the population, the availability and quality of healthcare services, the effectiveness of follow-up treatments, and advancements in medical technology over time [13]. To capture temporal trends, the analysis focused on the percentage change in MIRs between 1990 and 2021, stratified by age groups and countries categorized by the SDI. This approach allowed for a detailed evaluation of how MIRs evolved over time across different demographic and socioeconomic contexts.
Non-fatal outcome estimation
The non-fatal estimates generated for GBD 2021 are incidence, prevalence, and YLDs. A total of 346 sources were used, including data from hospital and emergency department records, insurance claims, and surveys, to acquire non-fatal estimates. To model healthcare access and treatment across spatial and temporal dimensions, we employed Spatiotemporal Gaussian process regression (ST-GPR) methods. This approach facilitated the estimation of treatment rates while adjusting for biases inherent in healthcare data. Additionally, we applied the meta-regression—Bayesian, regularised, trimmed (MR-BRT) modeling to adjust epidemiological data based on the proportion of individuals with access to healthcare services. This included adjustments for inpatient and outpatient care, specifically focusing on sex-specific hospitalization rates. The integration of these two methodologies allowed for the separate modeling of the AEMT for both inpatient and outpatient populations. Finally, we estimated the prevalence and incidence of AEMT using the DisMod-MR 2.1 tool. Detailed descriptions of the methods employed are provided in Supplementary Appendix 1, p. 17–25 [11].
The prevalence and incidence of AEMT were categorized into short-term and long-term estimates, considering differences in disability weights (DWs) for the calculation of YLDs. The YLDs adjusted for DWs were ultimately aggregated into total YLDs through a comorbidity correction process (Supplementary Appendix 1, p. 26–29). AEMT cases that received treatment were assigned different DWs compared to those that did not receive treatment. The proportion of treated cases was estimated using the HAQ Index. The expected duration of injuries was applied alongside DWs to generate epidemiological estimates. For non-fatal AEMT cases, the long-term excess mortality rate was assumed to be zero [11].
HAQ Index
This study examines healthcare access and quality for AEMT within defined age groups, based on the Organisation for Economic Co-operation and Development definition of the working-age population (15–64 yr) and Nolte and McKee’s avoidable mortality age limit of 74 years [14]. The HAQ Index quantifies healthcare performance on a scale from 0 to 100, where 0 represents the lowest observed performance and 100 the highest. The index standardizes the effects of cause-specific factors and risk exposures through an average weighting system to allow meaningful comparisons across age groups, years, and countries [15]. Using the HAQ Index, this study analyzed the correlations between key AEMT metrics—prevalence, incidence, DALYs, and mortality—and healthcare quality and access. Additionally, locations were stratified into five SDI groups to examine variations in healthcare access and quality. This approach provides a comprehensive perspective on the relationship between national medical quality, accessibility, and AEMT outcomes. Further methodological details are provided in Supplementary Appendix 1, p. 34–36.
Statistical analysis
All estimates derived from the GBD 2021 include a 95% uncertainty interval (UI), which was generated as the 2.5th and 97.5th percentiles. The UI was obtained through random draws of 1,000 samples, thereby reflecting the certainty of each estimate. For every estimate, the draws were aggregated by year, sex, age group, location, and SDI. As a composite measure, a location with an SDI of 0 represents the theoretical minimum level of sociodemographic development relevant to these health outcomes, whereas an SDI of 1 indicates the theoretical maximum level of sociodemographic development pertinent to these health outcomes. The SDI was calculated in accordance with the methodology outlined in the GBD 2021. Detailed methodological information can be found in Supplementary Appendix 1, p. 30–32. To examine the correlation between epidemiological measures and the HAQ, Pearson correlation coefficient analysis and linear regression analysis were conducted. The analyses were performed stratified by quantiles and by country. All analyses were conducted using Python (version 3.12.4; Python Software Foundation, Wilmington, DE, USA) and R (version 4.4.1; R Foundation, Vienna, Austria).
RESULTS
Global burden of AEMT
In 2021, the global age-standardized prevalence and incidence rates of AEMT were 11.48 per 100,000 population (95% UI, 8.86 to 14.13) and 150.44 (131.19 to 171.81), respectively. The age-standardized rates for DALYs and mortality were 64.19 per 100,000 population (95% UI, 51.06 to 73.11) and 1.53 (1.29 to 1.68), respectively. The national-level age-standardized rates of prevalence, incidence, DALYs, and mortality in 2021 are illustrated in Figure 1. Detailed counts and age-standardized rates for each measure at the national and regional level are presented in Tables 1. Age-standardized rates of YLDs and YLLs are shown in Supplementary Figure 1 and Supplementary Table 4. The annual percentage changes in age-standardized rates of prevalence, incidence, and YLDs per 100,000 population from 1990 to 2021 are depicted in Supplementary Figure 2 and Supplementary Table 5. The composition of DALYs by YLDs and YLLs over the same period is shown in Supplementary Figure 3 and Supplementary Table 6. Throughout the study period, over 97% of the total DALYs were consistently attributed to YLLs.
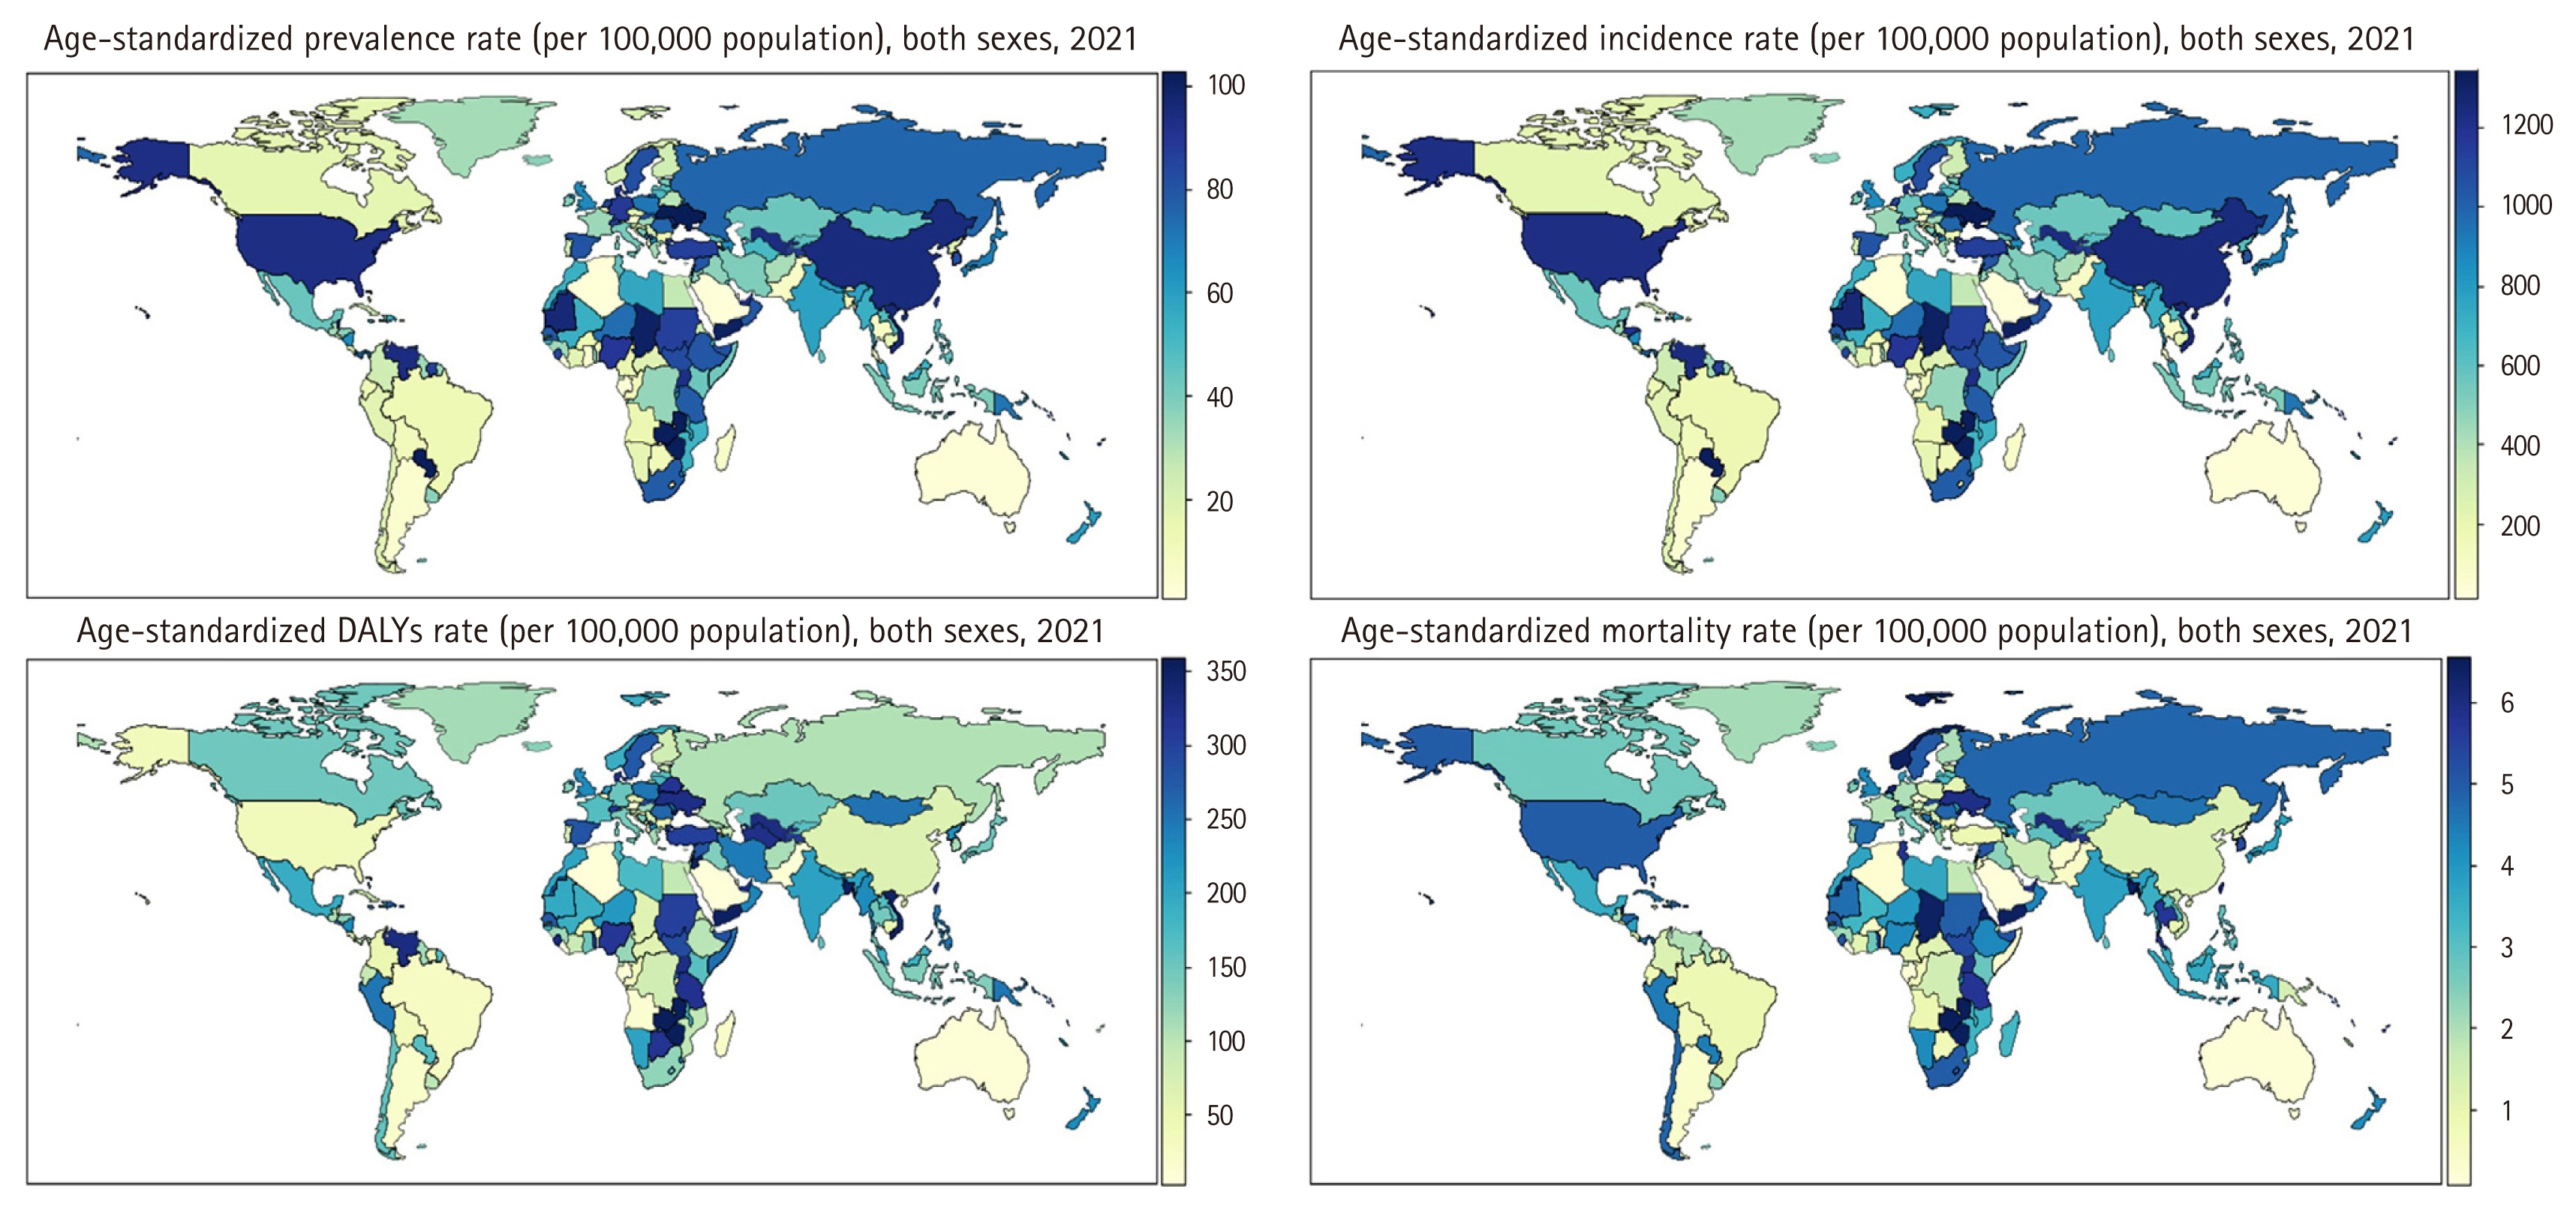
Global distribution of age-standardized prevalence, incidence, DALYs, and mortality rate (per 100,000 population) for adverse effects of medical treatments in both sexes, 2021. DALYs, disability-adjusted life years.
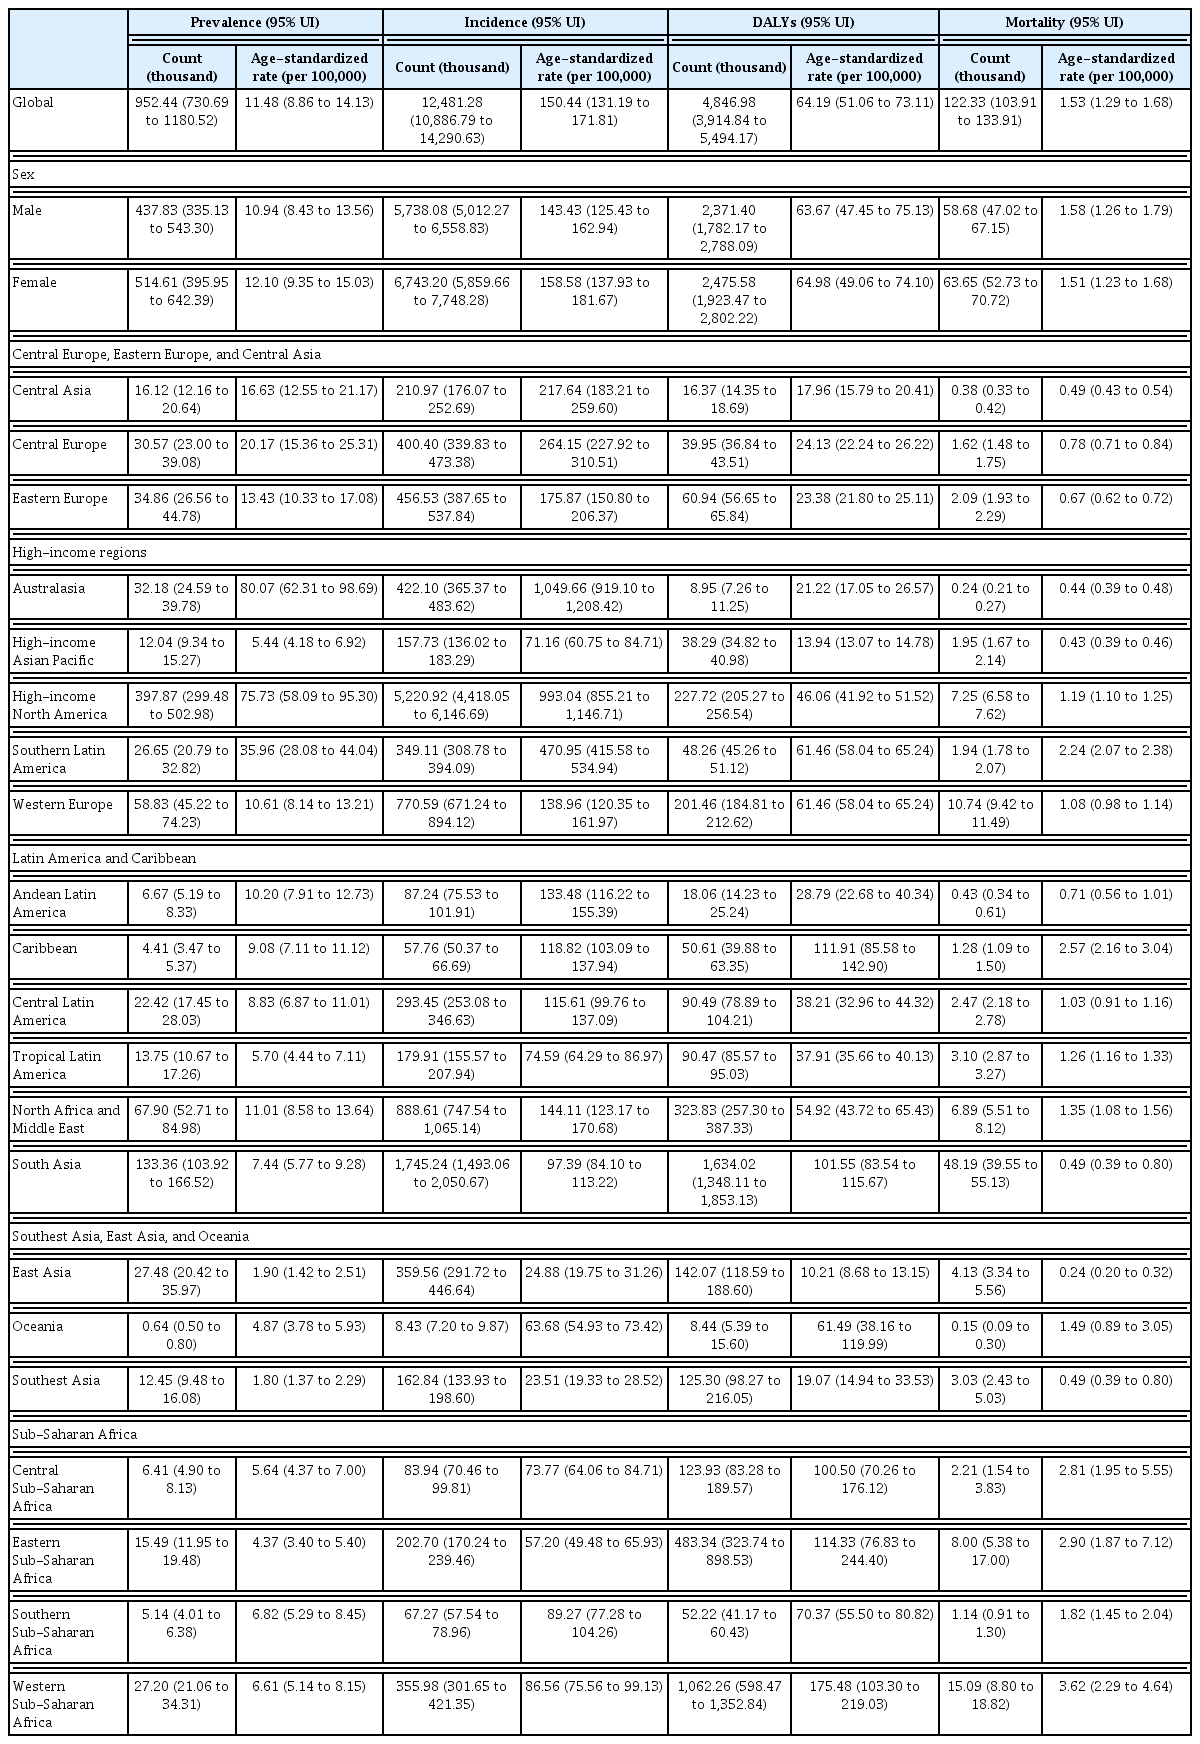
Global count and age-standardized rate (per 100,000) of prevalence, incidence, DALYs, and mortality for adverse effects of medical treatments in the both sexes in 2021
From 1990 to 2021, the total numbers of prevalence, incidence, and mortality cases increased. In 1990, the total prevalence was 565.62 thousand (95% UI, 438.03 to 701.01), incidence was 7,407.31 thousand (6,414.51 to 8,635.04), and mortality was 108.54 thousand (94.49 to 127.77). By 2021, these figures had risen to 919.07 thousand (95% UI, 706.95 to 1,139.54) for prevalence, 12,042.79 thousand (10,491.19 to 13,779.53) for incidence, and 123.66 thousand (105.79 to 136.36) for mortality. In contrast, the total number of DALYs showed a decreasing trend, declining from 5,745.00 thousand (95% UI, 4,914.84 to 6,594.17) in 1990 to 4,846.98 thousand (3,914.84 to 5,494.17) in 2021 (Supplementary Fig. 4 and Supplementary Table 7).
Despite these increases in total numbers, the age-standardized rates of prevalence, incidence, DALYs, and mortality all declined from 1990 to 2021. The age-standardized prevalence rate decreased from 12.12 per 100,000 (95% UI, 9.35 to 15.07) in 1990 to 11.48 (8.86 to 14.13) in 2021, peaking at 14.67 (11.32 to 18.22) in 2012. Similarly, the incidence rate declined from 158.83 per 100,000 (95% UI, 138.05 to 183.62) in 1990 to 150.44 (131.19 to 171.81) in 2021, also peaking at 192.39 (168.06 to 220.55) in 2012. Age-standardized DALY rates decreased from 106.49 per 100,000 (95% UI, 91.17 to 122.52) in 1990 to 64.19 (51.06 to 73.11) in 2021. Similarly, age-standardized mortality rates dropped from 2.40 per 100,000 (95% UI, 2.11 to 2.84) to 1.53 (1.29 to 1.68) over the same period (Supplementary Fig. 4 and Supplementary Table 8). Details on the total numbers and age-standardized rates of YLDs and YLLs are provided in Supplementary Figure 5 and Supplementary Table 9.
Burden of AEMT attributable to age and sex
The total counts and rates of prevalence, incidence, DALYs, and mortality, stratified by age and sex, are presented in Figure 2 and Supplementary Tables 10–13. Both prevalence and incidence rates generally increase with age. For prevalence, the lowest rate was observed in the 5–9 age group, at 4.38 per 100,000 population (95% UI, 2.61 to 7.01), while the highest rate was recorded among individuals aged 95 years and older, reaching 50.28 per 100,000 population (28.98 to 79.81). Similarly, for incidence, the lowest rate occurred in the 12–23 month age group, at 52.20 per 100,000 population (95% UI, 36.41 to 69.39), and the highest incidence rate was found among those aged 95 years and older, at 661.86 per 100,000 population (389.39 to 1,012.31).

Total case and rate (per 100,000 population) of key metrics for adverse effects of medical treatments, globally and by age groups and sex, 2021. (A) Prevalence, (B) incidence, (C) DALYs, and (D) mortality. DALYs, disability-adjusted life-years. Shaded regions indicate
DALY rates were highest in the early neonatal group, at 4,789.47 per 100,000 population (95% UI, 3,682.00 to 5,963.30). In contrast, mortality rates followed a distinct U-shaped pattern, with higher rates observed in both the neonatal and older population groups. Specifically, mortality rates in the early neonatal group were 53.22 per 100,000 population (95% UI, 40.91 to 66.27), and in the 95+ years group, they were 31.56 per 100,000 population (23.69 to 35.88). The total counts and age-specific rates of YLDs and YLLs are provided in Supplementary Figure 6 and Supplementary Tables 14–15.
The specific rates of prevalence, incidence, DALYs, and mortality according to each age group, stratified by SDI quintiles are presented in Figure 3 and Supplementary Tables 16–19. Prevalence and incidence rates are highest in all age group in high SDI quintiles compared to lower SDI quintiles. However, DALY and mortality exhibit lower rates in high SDI quintiles in all age group compared to lower SDI quintiles. The specific rates of YLD and YLL according to each age group, stratified by SDI quintiles are presented in Supplementary Figure 7 and Supplementary Tables 20–21.

Rates (per 100,000 population) of key metrics for adverse effects of medical treatments by SDI and age groups, 2021. (A) Prevalence, (B) incidence, (C) DALYs, and (D) mortality. DALYs, disability-adjusted life years; SDI, Socio-demographic Index.
MIRs of AEMT stratified by age, SDI, and year
In 2021, the MIR was highest at both ends of the age spectrum: the early neonatal group (0.576 [95% UI, 0.551 to 0.580]) and the 95+ age group (0.048 [0.035 to 0.061]). This pattern was consistent across all SDI quintiles, with higher MIRs observed in lower SDI quintiles. For example, in the early neonatal group, the MIR was 0.023 (95% UI, 0.021 to 0.027) in the high SDI quintile, 0.077 (0.071 to 0.082) in the high-middle SDI quintile, 0.402 (0.374 to 0.425) in the middle SDI quintile, 1.062 (1.003 to 1.055) in the low-middle SDI quintile, and 1.123 (0.971 to 1.344) in the low SDI quintile. In the 95+ age group, the MIR followed a similar trend: 0.027 (95% UI, 0.020 to 0.034) in the high SDI quintile, 0.229 (0.189 to 0.250) in the high-middle SDI quintile, 0.174 (0.142 to 0.207) in the middle SDI quintile, 0.286 (0.236 to 0.340) in the low-middle SDI quintile, and 0.328 (0.325 to 0.419) in the low SDI quintile (Figure 4A and Supplementary Table 22).

MIRs for adverse effects of medical treatments in both sexes. (A) By age and SDI groups, 2021. (B) Percentage change by SDI and age groups from 1990 to 2021. MIRs, mortality-incidence ratios; SDI, Socio-demographic Index.
Globally, the MIR decreased by 33.11% (95% UI, 35.21 to 36.67) from 1990 to 2021 across all age groups. While the highest MIRs persisted in the early neonatal and 95+ age groups across all SDI quintiles, the reductions were smallest in the low and low-middle SDI quintiles. In the early neonatal group, MIR decreased by 11.37% (95% UI, 12.92 to 13.45) in the low-middle SDI quintile and by 12.21% (2.95 to 12.08) in the low SDI quintile, compared to reductions of 40.10% (38.23 to 38.52) in the middle SDI quintile, 72.81% (71.32 to 72.60) in the high-middle SDI quintile, and 41.30% (37.53 to 45.97) in the high SDI quintile. In the 95+ age group, MIR increased slightly in the low-middle SDI quintile (0.64% [95% UI, −15.79 to 1.47]) and in the low SDI quintile (12.22% [−6.45 to 10.11]) (Figure 4B and Supplementary Table 23). The global trend in MIR from 1990 to 2021 is shown in Supplementary Figure 8.
Burden of AEMT correlation with HAQ index
Prevalence and incidence rates are positively correlated with HAQ Index (prevalence rate, r = 0.403, p < 0.0001; incidence rate, r = 0.403, p < 0.0001), while DALY and mortality rates are negatively correlated with HAQ Index (DALY rate, r = −0.657, p < 0.0001; mortality rate, r = −0.585, p < 0.0001) (Fig. 5). Correlation of YLD and YLL rates with HAQ Index are presented in Supplementary Figure 9. Age-stratified analysis revealed that the HAQ Index was most strongly and positively correlated with AEMT incidence rates in the 65–74-year age group, followed by the 15–64 and 0–14 age groups (Supplementary Fig. 10).
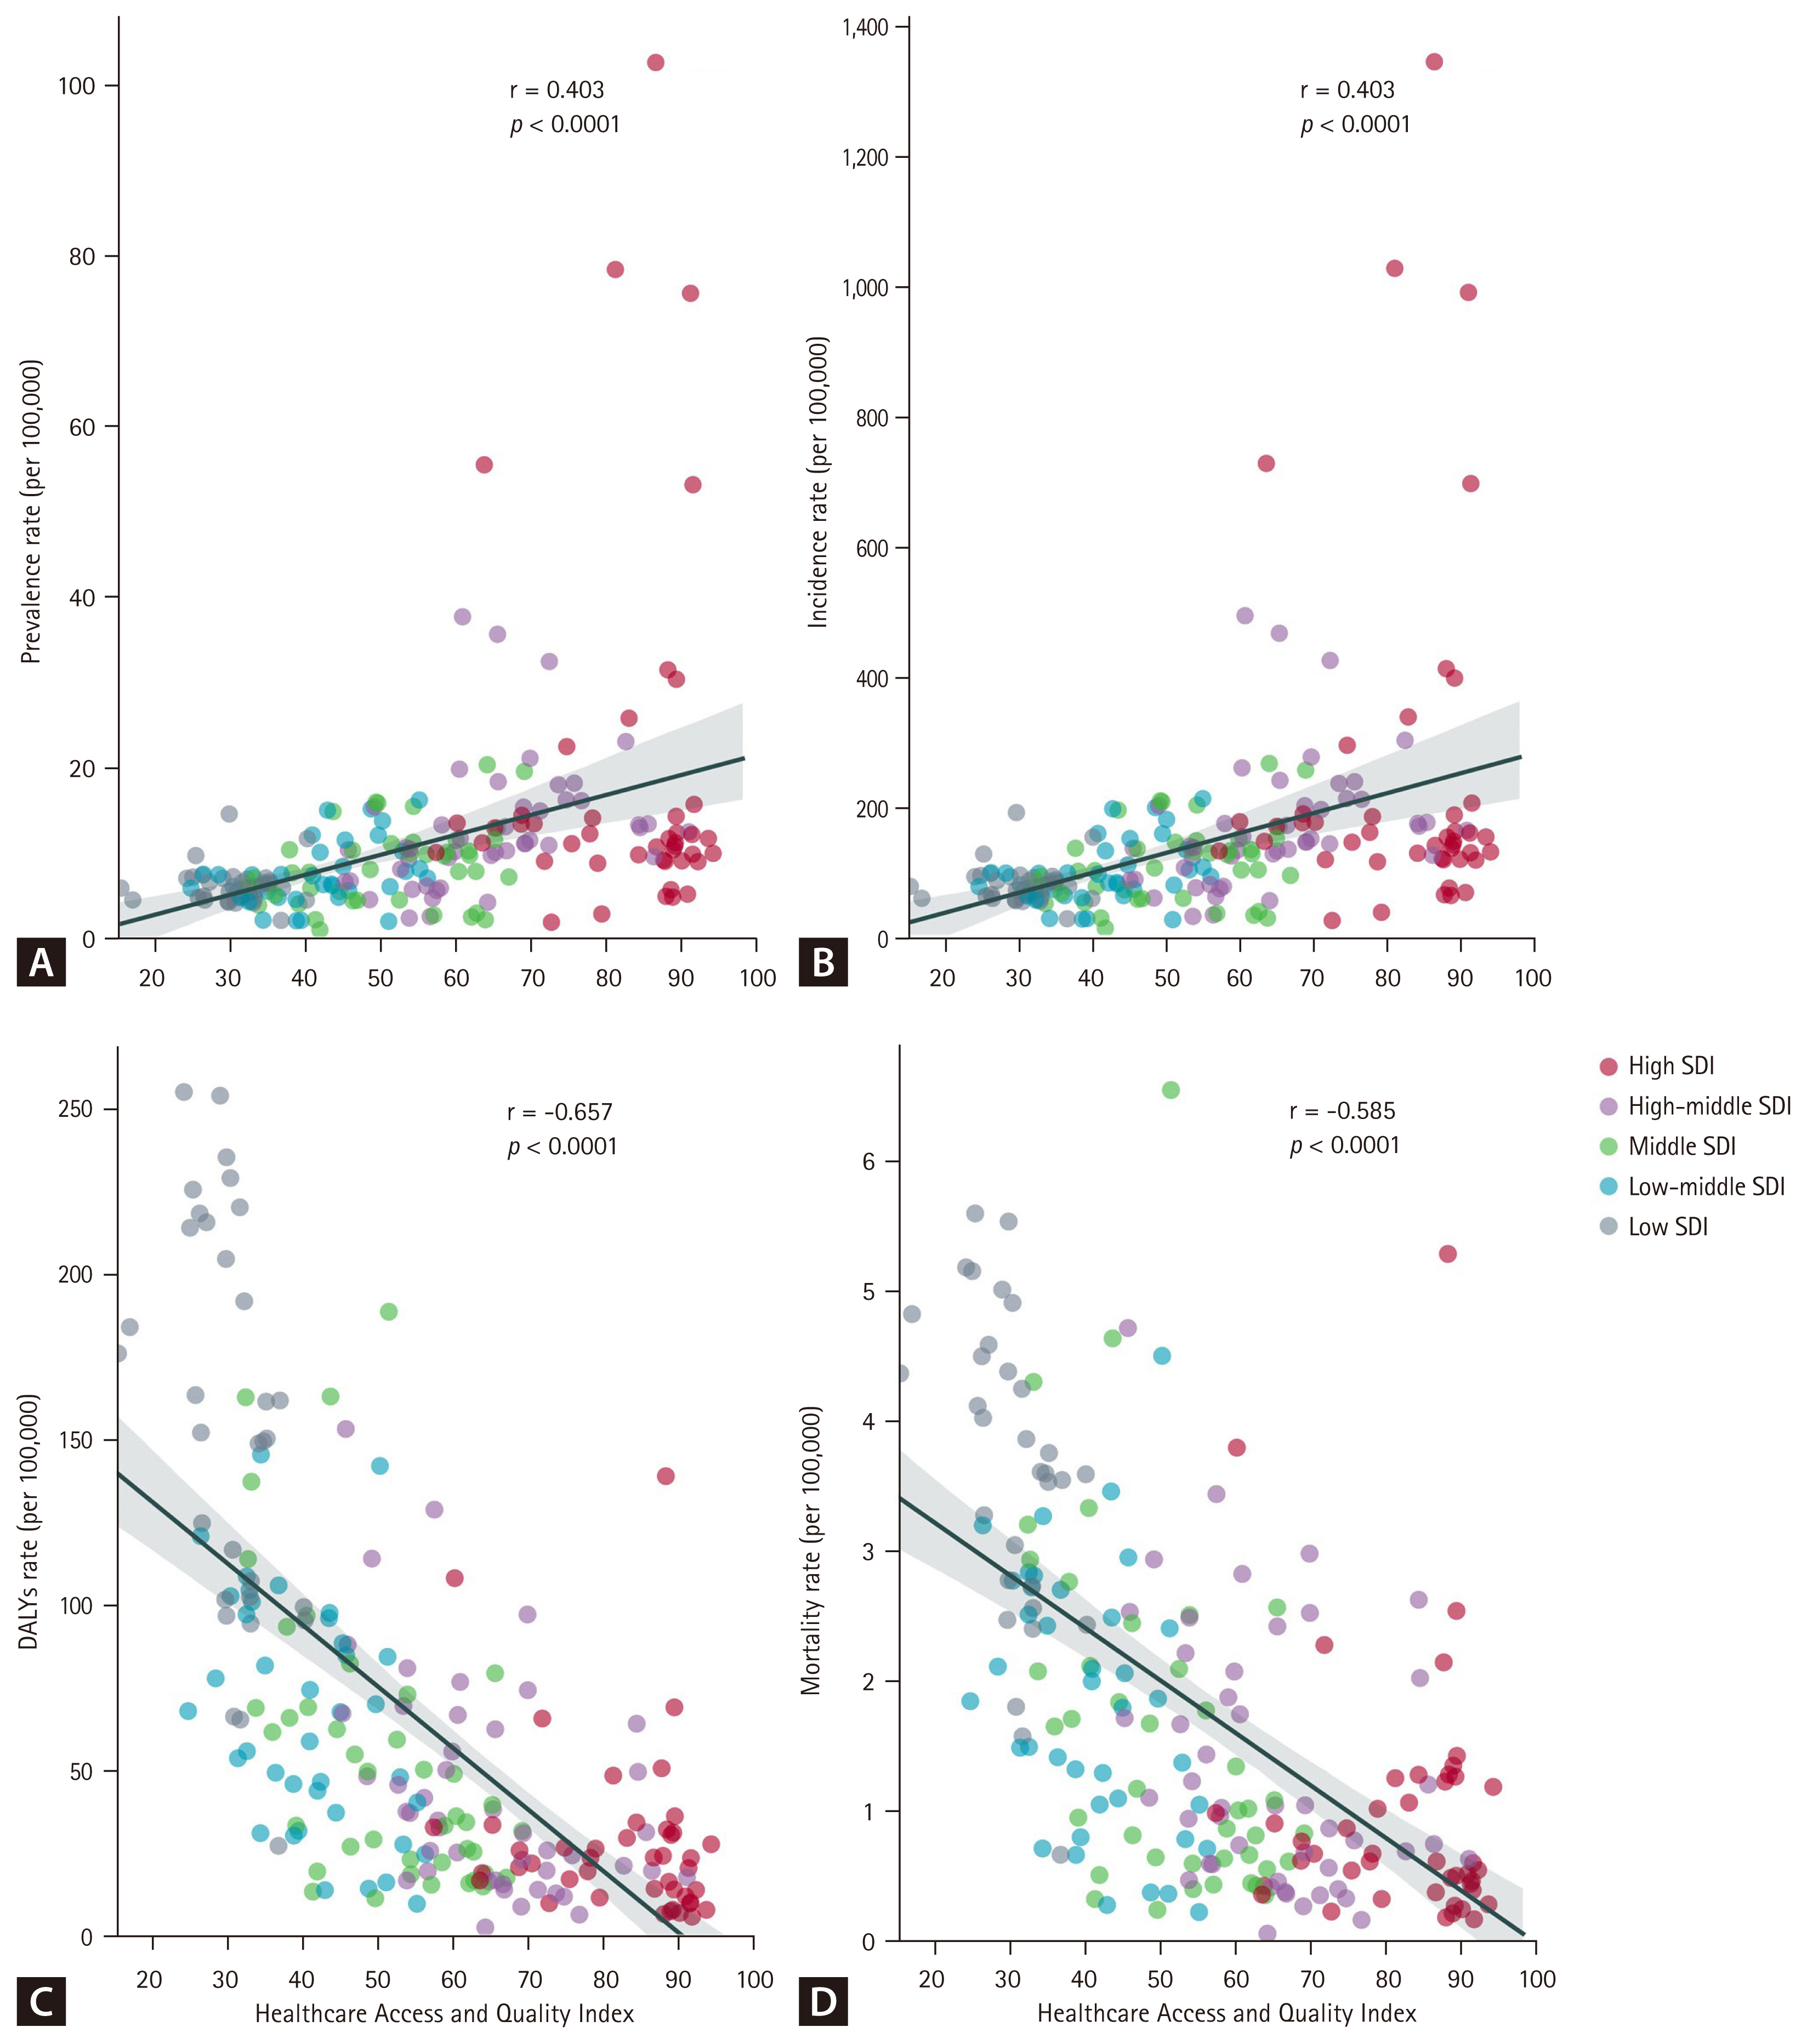
Correlation between Healthcare Access and Quality Index and key metrics for adverse effects of medical treatment, 2021. (A) Prevalence rate, (B) incidence rate, (C) DALYs rate, and (D) mortality rate. DALYs, disability-adjusted life years; SDI, Socio-demographic Index.
DISCUSSION
Key finding
From 1990 to 2021, global AEMT incidence and prevalence rates peaked in the early 2010s before declining, while DALY and mortality rates steadily decreased throughout the period. Both prevalence and incidence rates increased with age, reaching their highest levels in the older population. This trend was most pronounced in the high SDI quintile, which exhibited significantly higher prevalence and incidence rates across all age groups, particularly in the neonatal group. However, only the high SDI quintile indicated notably low MIRs in the neonatal group, while other quintiles experienced the highest MIRs during the early neonatal period. Lower SDI quintiles showed limited reductions in MIRs for the neonatal group from 1990 to 2021 compared to higher SDI quintiles, underscoring persistent disparities in AEMT outcomes by socioeconomic context.
These findings underscore the impact of excessive healthcare utilization in high SDI quintiles, particularly among the older population, and emphasize the need to reduce the burden of AEMT in children under two by improving neonatal care in lower SDI quintiles. Additionally, while prevalence and incidence rates increase with higher SDI levels, the inverse relationship between SDI and overall MIRs, DALYs, and mortality indicates that improved follow-up care for AEMT could substantially reduce mortality and DALYs, as observed in high SDI quintiles.
Plausible underlying mechanism
The elevated burden of AEMT in populations under two years and over 65 years of age can be attributed to several factors. First, older population frequently has multiple prescriptions due to a higher prevalence of comorbidities, and experience physiological changes due to aging [16]. Additionally, they generally experience reduced physical function and subsequent diminished capacity for postoperative recovery. These render old patients susceptible to the adverse effect of drugs and postsurgical complications [17]. In the pediatric population, choosing and dosing of medication require special consideration for pediatric physiology, and the complexity is inherent in pediatric surgical conditions [12]. Kaushal and colleagues also illustrated that perioperative adverse events, along with drug dosage effects, are among the primary causes of high mortality in pediatric populations [18]. Moreover, the use of off-label or unlicensed drugs in neonates and infants is frequent, because of limited studies on pharmacokinetics in neonates, further contributing to the increased DALYs and mortality rates [19].
Several factors may contribute to notably high prevalence and incidence rates of AEMT in older populations within the high SDI quintile. First, high-income countries tend to have a larger proportion of older individuals and a higher prevalence of chronic comorbidities within this age group [20]. Since AEMT occurs more prevalently in conjunction with chronic conditions [21], this could partly explain the elevated rates. Another possible factor is increased healthcare access in high SDI countries [15], which may lead to higher healthcare overuse among the older population, even in cases of non-essential care. For instance, in countries with national health insurance systems, such as South Korea, excessive healthcare use among the older population has become a recognized issue [22]. Moreover, the HAQ Index for individuals aged 65 to 74 years exhibited the strongest positive correlation with AEMT incidence rates, further suggesting that healthcare overutilization among the older population may contribute to the burden in countries with higher HAQ Index values. This finding aligns with previous research indicating a positive association between the proportion of older populations and public healthcare expenditure in high-income countries, as well as the widespread overuse of medical services observed in these settings [23].
Clinical and policy implications
The notably high prevalence and incidence rates of AEMT in older populations within high SDI quintiles are concerning. While it is expected for older individuals with healthcare needs to utilize services, in high-income countries, healthcare utilization by those without critical need may contribute to elevated rates of AEMT and place strain on healthcare systems. Studies indicate that one-fifth to one-third of patients receive unnecessary healthcare services, which may be potentially harmful [24]. Baicker and colleagues suggest that reducing overall testing by 46.8 percent, including a 62.4 percent reduction for low-risk patients, who comprise the majority, and a 15.6 percent increase in testing for high-risk groups would help alleviate the burden of adverse events [25]. Patients often seek additional healthcare services when their personal financial contribution is minimal [25]. However, this issue is not solely patient-driven; clinician incentives also play a role. Clinicians may underutilize high-value resources when compensation is insufficient and overutilize low-value resources when financial returns are higher [26]. Addressing this imbalance requires fostering clinician ethics and establishing a more equitable compensation structure. At a societal level, increasing the proportion of primary care physicians may help curb healthcare overuse [27]. Furthermore, implementing a standardized index to monitor unnecessary healthcare usage and adopting community-based case management for medical aid beneficiaries could reduce the strain of excessive healthcare utilization [28].
The global decline in MIR across all SDI quintiles indicates that the burden of AEMT can be effectively mitigated with the implementation of appropriate interventions. In this regard, it is notable that there was the greatest reduction in MIR in neonatal groups, while MIR among older populations has remained steady. This finding indicates that the observed decline in age-standardized DALY and mortality rates could be primarily attributable to improved survival rate of AEMT in neonatal groups. Additionally, MIR in neonatal groups is the highest across all SDI quintiles, except for the high SDI quintile, further emphasizing the need to reduce the burden of AEMT in neonatal populations across lower SDI quintiles. Previous study reporting many adverse events in neonatal group results in permanent harm and most of them preventable [29]. Also, the higher rates of AEMT in preterm birth, but relative lack of resources and lower quality of neonatal cares in low-income countries compared to high-income countries, emphasize the need to develop interventions of neonatal cares particularly in low-income countries [30]. Achieving outcomes similar to those seen in high SDI regions could be a key target for global policy initiatives aimed at addressing the burden of AEMT worldwide.
Despite previous safety initiatives and interventions so far, the limited impact on patient safety can be attributed to the failure to address multiple contributory factors within the healthcare system [31]. A comprehensive approach combining individual, system, and organizational-level measures is necessary [5]. At the individual level, practitioner education serves as an effective intervention [5]. System-level measures include prospective reporting, which can identify preventable adverse events, provide practical warning systems, and improve the reliability of judgements on the medical errors [32]. Additionally, implementing a dependable system for screening polypharmacy and comorbidities would further strengthen system-level interventions [33]. At the organizational level, fostering a safety culture within healthcare institutions can improve clinicians’ behaviors towards patient safety, thus reducing adverse events and mortality [34]. Furthermore, differences in healthcare systems among high-income countries may also influence the burden of AEMT. For example, variations in insurance coverage, reimbursement structures, and care delivery models could shape patterns of healthcare utilization and adverse outcomes [35]. Future comparative analyses across advanced health systems would provide valuable insights into how institutional contexts modify the risk of AEMT.
Strengths and limitation
Despite the advantages of utilizing GBD 2021 for measuring AEMT, several limitations persist. Firstly, in countries/territories with underdeveloped medical registries, AEMT cases may be underreported due to poor identification processes [36], and estimates of the national and regional burden might rely on modelling data based on neighboring countries or a limited number of organizations, potentially reducing accuracy [37]. Second, unlike prior study conducted in the United States, this analysis did not investigate each AEMT subtype separately (adverse drug events, surgical and perioperative AEs, misadventure, AEs associated with medical management, AEs associated with medical or surgical devices, others) [12]. As noted in the first limitation, compared to the United States, medical registries in non-high-income countries and territories are less developed. Consequently, the classification of AEMT subtypes may lack precision. Therefore, focusing on the overall AEMT estimate offers a more stable and reliable measure in a global context. This approach acknowledges the trade-off between achieving broad global coverage and conducting in-depth component analysis. Third, ICD codes for AEMT in the GBD 2021 may have not fully captured all AEMT cases. Healthcare providers could be reluctant to report AEMTs, as they are often perceived as ‘mistake’. This perception may drive providers to report alternative ICD codes that align more closely with the patient’s symptoms rather than the AEMT itself [38]. Moreover, certain events resulting from inpatient care issues such as nosocomial infections (ICD-10 code, Y95), falls due to inadequate hospital safeguards (W09), or decubitus ulcer and pressure area (L89) may not be classified as AEMTs in the GBD [39]. Lastly, the burden of AEMT could not be subdivided into different severities and its preventability, unlike previous study by Panagioti and colleagues [5]. Despite its limitations, this study offers unique strength. The GBD 2021 utilized a diverse range of data sources, including health registration systems, national censuses, household surveys, disease-specific registries, and published studies, providing a robust dataset for analyzing AEMT. This contrasts with many previous studies, which were often limited to data from single developed countries [12]. As a result, this study stands out as the most current and comprehensive quantitative longitudinal analysis of the global, regional, and national burden of AEMT, stratified by age, sex, and SDI.
CONCLUSION
This GBD 2021 provides a comprehensive overview of the global burden of AEMT from 1990 to 2021. The findings reveal higher prevalence and incidence rates among the older population in high SDI quintiles, likely reflecting healthcare overuse. Elevated MIRs in children under two in lower SDI quintiles, along with slower declines, compared to high SDI quintiles, underscore the need for targeted interventions. Enhancing neonatal care in lower SDI regions and ensuring consistent follow up care are essential to reducing preventable harm and global disparities in AEMT outcomes.
KEY MESSAGE
1. The higher burden of AEMT among older adults in high SDI quintiles may reflect healthcare overuse.
2. MIRs were higher in lower SDI quintiles, indicating a greater risk of fatal outcomes.
3. From 1990 to 2021, MIRs declined more gradually in lower SDI, suggesting persistent disparities in healthcare quality and access.
Notes
GBD 2021 AEMT Collaborators
Yi Deun Jeong&, Seoyoung Park&, Wonwoo Jang&, Min Seo Kim&, Bhoomadevi A, Mohammad Amin Aalipour, Mohammed Altigani Abdalla, Meriem Abdoun, Auwal Abdullahi, Toufik Abdul-Rahman, Armita Abedi, Richard Gyan Aboagye, Mohamed Abouzid, Dariush Abtahi, Bilyaminu Abubakar, Eman Abu-Gharbieh, Ahmad Y Abuhelwa, Salahdein Aburuz, Dina Abushanab, Lisa C Adams, Kamoru Ademola Adedokun, Nurudeen A Adegoke, Olumide Thomas Adeleke, Juliana Bunmi Adetunji, Temitayo Esther Adeyeoluwa, Mohd Adnan, Prince Owusu Adoma, David Adzrago, Habeeb Abiodun Afolabi, Vlad-Adrian Afrăsânie, Fatemeh Afrashteh, Saira Afzal, Williams Agyemang-Duah, Mahsa Ahadi, Bright Opoku Ahinkorah, Aqeel Ahmad, Danish Ahmad, Muayyad M Ahmad, Sajjad Ahmad, Negar Sadat Ahmadi, Ali Ahmed, Ayman Ahmed, Muktar Beshir Ahmed, Sindew Mahmud Ahmed, Syed Anees Ahmed, Yazan Al-Ajlouni, Mostafa Alam, Fahmi Y Al-Ashwal, Wafa A Aldhaleei, Shereen M Aleidi, Ali M Alfalki, Abdelazeem M Algammal, Fadwa Naji Alhalaiqa, Dari Alhuwail, Abid Ali, Bassam R Ali, Liaqat Ali, Mohammad Daud Ali, Mohammed Usman Ali, Rafat Ali, Syed Shujait Ali, Morteza Alipour, Samah W Al-Jabi, Mohamad Aljofan, Mustafa Alkhawam, Mohammed Z Allouh, Sabah Al-Marwani, Joseph Uy Almazan, Mohammad R Alqudimat, Ahmad Rajeh Al-Qudimat, Intima Alrimawi, Mohammed A Alsabri, Najim Z Alshahrani, Awais Altaf, Yaser Mohammed Al-Worafi, Mohammad Sharif Ibrahim Alyahya, Amr Amin, Alireza Amindarolzarbi, Jimoh Amzat, Filippos Anagnostakis, Catalina Liliana Andrei, Abdul-Azeez Adeyemi Anjorin, Iyadunni Adesola Anuoluwa, Saeid Anvari, Saleha Anwar, Anayochukwu Edward Anyasodor, Jalal Arabloo, Mosab Arafat, Jorge Arias de la Torre, Ghazal Arjmand, Jesu Arockiaraj, Anton A Artamonov, Ashokan Arumugam, Syed Mohammed Basheeruddin Asdaq, Mitra Ashrafi, Dereje Zewdu Assefa, Alok Atreya, Julie Alaere Atta, Martin Amogre Ayanore, Haleh Ayatollahi, Arian Azadnia, Ali Azargoonjahromi, Fahad Khan Azeez, Sadat Abdulla Aziz, Ahmed Y Azzam, Hediyeh Baghsheikhi, Ovidiu Constantin Baltatu, Maciej Banach, Hansi Bansal, Simachew Animen Bante, Mainak Bardhan, Amadou Barrow, Zarrin Basharat, Mohammad-Mahdi Bastan, Abdul-Monim Batiha, Kavita Batra, Mahdis Bayat, Nebiyou Simegnew Bayleyegn, Narasimha M Beeraka, Gokce Belge Bilgin, Abiye Assefa Berihun, Amiel Nazer C Bermudez, Akshaya Srikanth Bhagavathula, Neeraj Bhala, Nikha Bhardwaj, Pankaj Bhardwaj, Sonu Bhaskar, Priyadarshini Bhattacharjee, Rajbir Bhatti, Raluca Bievel-Radulescu, Cem Bilgin, Bruno Bizzozero-Peroni, Paria Bolourinejad, Sri Harsha Boppana, Alejandro Botero Carvajal, Norma B Bulamu, Felix Busch, Yasser Bustanji, Rose Cairns, Mehtap Çakmak Barsbay, Luis Alberto Cámera, Si Cao, Angelo Capodici, Andrea Carugno, Andre F Carvalho, Márcia Carvalho, Joao Mauricio Castaldelli-Maia, Muthia Cenderadewi, Pamela Roxana Chacón-Uscamaita, Jeffrey Shi Kai Chan, Vijay Kumar Chattu, Lam Duc Chau, Sirshendu Chaudhuri, An-Tian Chen, Haowei Chen, Qingsong Chen, Xing Chen, Patrick R Ching, Daniel Youngwhan Cho, Bryan Chong, Hitesh Chopra, Shivani Chopra, Sonali Gajanan Choudhari, Dinh-Toi Chu, Isaac Sunday Chukwu, Sunghyun Chung, Alyssa Columbus, Joao Conde, Omid Dadras, Xiaochen Dai, Mayank Dalakoti, Giovanni Damiani, Emanuele D'Amico, Endalamaw Tesfa Damtie, Anh Kim Dang, Samuel Demissie Darcho, Latefa Ali Dardas, Paul I Dargan, Emina Dervišević, Vinoth Gnana Chellaiyan Devanbu, Pradeep Kumar Devarakonda, Kuldeep Dhama, Sameer Dhingra, Jingkai Di, Diana Dias da Silva, Shirin Djalalinia, Huyen Phuc Do, Sushil Dohare, Neda Dolatkhah, Mario D'Oria, Fariba Dorostkar, Ojas Prakashbhai Doshi, Robert Kokou Dowou, Viola Savy Dsouza, Aster Dure Dumbullo, Senbagam Duraisamy, Sulagna Dutta, Abdel Rahman E’mar, Lamiaa Labieb Mahmoud Ebraheim, Ashkan Eighaei Sedeh, Michael Ekholuenetale, Muhammed Elhadi, Mohamed Hassan Elnaem, Chadi Eltaha, Abdelgawad Salah Eltahawy, Amir Emami Zeydi, Elochukwu Ezenwankwo, Heidar Fadavian, Adeniyi Francis Fagbamigbe, Ayesha Fahim, Mohammad Fareed, Sara Farina, Ali Fatehizadeh, Alireza Feizkhah, Ginenus Fekadu, Ulrich Membe Femoe, Rodrigo Fernandez-Jimenez, Pietro Ferrara, Nuno Ferreira, Florian Fischer, Federica Fogacci, Behzad Foroutan, Takeshi Fukumoto, Dominic Dormenyo Gadeka, Márió Gajdács, Dingwei Gao, Xiang Gao, David Garcia-Azorin, Rupesh K Gautam, Miglas Welay Gebregergis, Delaram J Ghadimi, Kazem Ghaffari, Arin Ghamkhar, Fariba Ghassemi, Zainab Gholami, Artyom Urievich Gil, Alem Abera Girmay, Mahaveer Golechha, Pouya Goleij, Mohsen Golkar, Melika Golmohammadi, Nelson G M Gomes, Ayman Grada, Shi-Yang Guan, Giovanni Guarducci, Damitha Asanga Gunawardane, Veer Bala Gupta, Roberth Steven Gutiérrez-Murillo, Parishma Guttoo, Najah R Hadi, Pritam Halder, Sajid Hameed, Samer Hamidi, Harrison J Hansford, Mohammad Jahid Hasan, Syed Shahzad Hasan, Md Saquib Hasnain, Amr Hassan, Muhammad Hassan, Nageeb Hassan, Mahgol Sadat Hassan Zadeh Tabatabaei, Rasmus J Havmoeller, Khezar Hayat, Khedidja Hedna, Mohammad Heidari, Mojtaba Heydari, Yuta Hiraike, Alamgir Hossain, Sorin Hostiuc, Hanno Hoven, Guoqing Hu, Junjie Huang, Xiaojie Huang, Kiavash Hushmandi, Bing-Fang Hwang, Olayinka Stephen Ilesanmi, Irena M Ilic, Milena D Ilic, Lalu Muhammad Irham, Abubakar Musa Isa, Sheikh Mohammed Shariful Islam, Nahlah Elkudssiah Ismail, Haitham Jahrami, Anmol Jain, Nityanand Jain, Vikash Jaiswal, Ruchi Jakhmola-Mani, Mihajlo Jakovljevic, Armaan Jamal, Jerin James, Amirreza Javadi Mamaghani, Ruwan Duminda Jayasinghe, Felix K Jebasingh, Gwang Hun Jeong, Seogsong Jeong, Bijay Mukesh Mukesh Jeswani, Nitin Joseph, Charity Ehimwenma Joshua, Ashish Kumar Kakkar, Ashwin Kamath, Ramat T Kamorudeen, Saddam Fuad Kanaan, Samuel Berchi Kankam, Kehinde Kazeem Kanmodi, Rami S Kantar, Sujita Kumar Kar, Samad Karkhah, Mohmed Isaqali Karobari, Tomasz M M Karpiński, Joonas H Kauppila, Ariz Keshwani, Himanshu Khajuria, Mohammad Ali Khaksar, Sumaira Khalid-Ariturk, Ajmal Khan, Muhammad Mueed Khan, Ramsha Mushtaq Khan, Yusuf Saleem Khan, Zahid Khan, Sameer Uttamaro Khasbage, Haitham Khatatbeh, Moawiah Mohammad Khatatbeh, Jagdish Khubchandani, Adnan Kisa, Ali- Asghar Kolahi, Farzad Kompani, Oleksii Korzh, Sindhura Lakshmi Koulmane Laxminarayana, Irene Akwo Kretchy, Varun Krishna, Burcu Kucuk Bicer, Mohammed Kuddus, Mukhtar Kulimbet, Dian Kusuma, Ville Kytö, Lucie Laflamme, Savita Lasrado, Duc Huy Le, Thao Thi Thu Le, Caterina Ledda, Seung Won Lee, Wei-Chen Lee, Vasileios Leivaditis, Jing Li, Virendra S Ligade, Liangquan Lin, Xiaofeng Liu, Xuefeng Liu, Erand Llanaj, Platon D Lopukhov, Jailos Lubinda, Giancarlo Lucchetti, Raimundas Lunevicius, Peng Luo, Ellina Lytvyak, Kevin Sheng-Kai Ma, Seyed Ataollah Madinezad, Aurea Marilia Madureira-Carvalho, Sasikumar Mahalingam, Mehrdad Mahalleh, Samatar Abshir Mahamed, Nozad Hussein Mahmood, Farhad Mahmoudi, Venkatesh Maled, Ahmad Azam Malik, Kamaruddeen Mannethodi, Shaista Manzoor, Roy Rillera Marzo, Sammer Marzouk, Yasith Mathangasinghe, Fernanda Penido Matozinhos, Khurshid A Mattoo, Steven M McPhail, Rishi P Mediratta, Vini Mehta, Hadush Negash Meles, Ritesh G Menezes, Alexios- Fotios A Mentis, Atte Meretoja, Tuomo J Meretoja, Tomislav Mestrovic, Chamila Dinushi Kukulege Mettananda, Sachith Mettananda, GK Mini, Chaitanya Mittal, Natansh Deepak Modi, Yidnek Mogessie, Heba M Mohamed, Hebatalla Mohamed, Jama Mohamed, Mona Gamal Mohamed, Nouh Saad Mohamed, Khabab Abbasher Hussien Mohamed Ahmed, Taj Mohammad, Abdollah Mohammadian-Hafshejani, Shafiu Mohammed, Syam Mohan, Ali H Mokdad, Amirabbas Mollaei, Mohammad Ali Moni, Francis Nanda Prakash Monteiro, Anthony Kwame Morgan, Mahmoud M Morsy, Seyed Ahmad Mousavi, Seyed Mohamad Sadegh Mousavi Kiasary, Kimia Mozahheb Yousefi, Sumaira Mubarik, Sumoni Mukherjee, Yanjinlkham Munkhsaikhan, Ghulam Mustafa, Mubarak Taiwo Mustapha, Sathish Muthu, Muhammad Muzaffar, Ahamarshan Jayaraman Nagarajan, Amirhossein Naghibzadeh, Ganesh R Naik, Hiten Naik, Firzan Nainu, Gopal Nambi, Shumaila Nargus, Mahmoud Nassar, Zuhair S Natto, Nawsherwan NA, Biswa Prakash Nayak, Athare Nazri-Panjaki, Abigia Ashenafi Negash, Ionut Negoi, Henok Biresaw Netsere, Cuong Tat Nguyen, Long Nguyen, Nhien Ngoc Y Nguyen, Trang Nguyen, Van Thanh Nguyen, Ali Nikoobar, Chisom Adaobi Nri-Ezedi, Ogochukwu Janet Nzoputam, Bogdan Oancea, Ramez M Odat, Oluwaseun Adeolu Ogundijo, Olusegun Olatunji Ojedoyin, Hassan Okati-Aliabad, Sylvester Reuben Okeke, Oluwaseyi Isaiah Olabisi, Andrew T Olagunju, Abdulhakeem Abayomi Olorukooba, Folorunsho Bright Omage, Marcel Opitz, Atakan Orscelik, Augustus Osborne, Elham H Othman, Amel Ouyahia, Irene Amoakoh Owusu, Kolapo Oyebola, Yeganeh Pakbaz, Tamás Palicz, Ioannis Pantazopoulos, Giovanni Paolino, Shahina Pardhan, Amrita Parida, Ava Pashaei, Roberto Passera, Shiv Patel, Shankargouda Patil, Shrikant Pawar, Shubhadarshini Pawar, Hamidreza Pazoki Toroudi, Mario F P Peres, Anil K Philip, Zahra Zahid Piracha, Edoardo Pirera, Evgenii Plotnikov, Roman V Polibin, Ville T Ponkilainen, Sajjad Pourasghary, Farzad Pourghazi, Mohsen Poursadeqiyan, Akram Pourshams, Nameer Hashim Qasim, Ibrahim Qattea, Xiang Qi, Zhipeng Qi, Jia-Yong Qiu, Venkatraman Radhakrishnan, Maja R Radojčić, Pankaja Raghav, Fakher Rahim, Vafa Rahimi-Movaghar, Fryad Majeed Rahman, Mohammad Hifz Ur Rahman, Mosiur Rahman, Muhammad Aziz Rahman, Adarsh Raja, Mahmoud Mohammed Ramadan, Shakthi Kumaran Ramasamy, Sheena Ramazanu, Nemanja Rancic, Devarajan Rathish, David Laith Rawaf, Salman Rawaf, Andre M N Renzaho, Mina Rezaei, Nazila Rezaei, Mohsen Rezaeian, Abanoub Riad, João Rocha Rocha-Gomes, Jefferson Antonio Buendia Rodriguez, Leonardo Roever, Moustaq Karim Khan Rony, Himanshu Sekhar Rout, Chandan S N, Aly M A Saad, Cameron John Sabet, Mohd Saeed, Umar Saeed, Mehdi Safari, Morteza Saki, Afeez Abolarinwa Salami, Zikria Saleem, Mohamed A Saleh, Dauda Salihu, Yoseph Leonardo Samodra, Abdallah M Samy, Milena M Santric-Milicevic, Aswini Saravanan, Mohammad Sarmadi, Gargi Sachin Sarode, Sachin C Sarode, Brijesh Sathian, Mukesh Kumar Sathya Narayanan, Maheswar Satpathy, Monika Sawhney, Christophe Schinckus, Mohammad H Semreen, Pallav Sengupta, Subramanian Senthilkumaran, Yashendra Sethi, Allen Seylani, Moyad Jamal Shahwan, Masood Ali Shaikh, Muhammad Aaqib Shamim, Anas Shamsi, Alfiya Shamsutdinova, Dan Shan, Amin Sharifan, Javad Sharifi Rad, Shamee Shastry, Ramzi Shawahna, Rahim Ali Sheikhi, Samendra P Sherchan, B Suresh Kumar Shetty, Pavanchand H Shetty, Premalatha K Shetty, Md Monir Hossain Shimul, Nebiyu Aniley Shitaye, Aminu Shittu, Sina Shool, Sunil Shrestha, Emmanuel Edwar Siddig, Ayesha Siddiqua, Baljinder Singh, Harmanjit Singh, Puneetpal Singh, Surjit Singh, Valentin Yurievich Skryabin, Anna Aleksandrovna Skryabina, Farrukh Sobia, Balamrit Singh Sokhal, Prashant Sood, Soroush Soraneh, Michael Spartalis, Bahadar S Srichawla, Manikandan Srinivasan, Devin Bailey Srivastava, Andy Stergachis, Omer Subasi, Aravindkumar Subramanian, Vetriselvan Subramaniyan, Thanigaivel Sundaram, Chandan Kumar Swain, Lukasz Szarpak, Fatemeh Sadat Tabatabaei, Seyed Shahaboddin Tabatabaei, Celine Tabche, Mohammad Tabish, Yasaman Taheri Abkenar, Saba Tariq, Razieh Tavakoli Oliaee, Rahele Tavakoly, Mohamad-Hani Temsah, Wegen Beyene Tesfamariam, Hadiza Theyra- Enias, Jansje Henny Vera Ticoalu, Tenaw Yimer Tiruye, Madi Tleshev, Sojit Tomo, Marcos Roberto Tovani-Palone, An Thien Tran, Tam Quoc Minh Tran, Nguyen Tran Minh Duc, Domenico Trico, Evangelia Eirini Tsermpini, Lorainne Tudor Car, Aniefiok John Udoakang, Atta Ullah, Himayat Ullah, Hauwa Onozasi Umar, Lawan Umar, Era Upadhyay, Jibrin Sammani Usman, Hande Uzunçıbuk, Asokan Govindaraj Vaithinathan, Balachandar Vellingiri, Qingzhi Wang, Wei Wang, Yanzhong Wang, Fei-Long Wei, Anggi Lukman Wicaksana, Nuwan Darshana Wickramasinghe, Samuel Wiebe, Marcin W Wojewodzic, Zenghong Wu, Lishun Xiao, Wanqing Xie, Mahnaz Yadollahi, Haibo Yang, Renjulal Yesodharan, Dehui Yin, Malede Berihun Yismaw, Naohiro Yonemoto, Chuanhua Yu, Deniz Yuce, Aurora Zanghì, Michael Zastrozhin, Mohammed Zawiah, Mohammed G M Zeariya, Sebastian Zensen, Tiansong Zhan, Xiaoyi Zhang, Zhongyi Zhao, Claire Chenwen Zhong, Abzal Zhumagaliuly, Sa'ed H Zyoud, Jae Il Shin*, Dong Keon Yon*, Lee Smithll
&Contributed equally as first authors.
*Contributed equally as corresponding authors.
llSenior author.
Affiliations
For list of collaborator affiliations see Supplementary Authorship (p. 4–18).
CRedit authorship contributions
Please see Supplementary Appendix (p. 35–45) for more detailed information about individual author contributions to the research, divided into the following categories: providing data or critical feedback on data sources; developing methods or computational machinery; providing critical feedback on methods or results; drafting the manuscript or revising it critically for important intellectual content; and managing the estimation or publications process. Members of the core research team for this topic area had full access to the underlying data used to generate estimates presented in this study. All other authors had access to and reviewed estimates as part of the research evaluation process, which includes additional stages of formal review. Yi Deun Jeong, Seoyoung Park, Wonwoo Jang, and Min Seo Kim contributed equally as first authors. Jae Il Shin and Dong Keon Yon contributed equally as corresponding authors. Lee Smith is the senior author. The corresponding author (Jae Il Shin and Dong Keon Yon) had full access to the data in the study and had final responsibility for the decision to submit for publication.
Conflicts of interest
Jae Il Shin reports other financial or non-financial interests with the Yonsei Fellowship, funded by Youn Jae Lee (JIS) outside the submitted work. Competing interests for the GBD 2021 AEMT Collaborators are listed in Supplementary Appendix (p. 46–52).
Funding
This study was funded by the Gates Foundation, Australian National Health and Medical Research Council, and Queensland Department of Health, Australia. This work was supported by the Yonsei Fellowship, funded by Lee Youn Jae (to JIS). This research was supported by the Ministry of Science and ICT (RS-2024-00509257 and IITP-2024-RS-2024-00438239 to DKY) and the Ministry of Health & Welfare (RS-2025-02220492 to DKY), Republic of Korea. The funder of the study had no role in study design, data collection, data analysis, data interpretation, or writing of the report. All authors had full access to the study data and had final responsibility for the decision to submit for publication.
Ethical statement
The GBD 2021 protocol has been approved by the research ethics board at the University of Washington. The GBD shall be conducted in full compliance with University of Washington policies and procedures, as well as applicable federal, state, and local laws.
Data availability
The findings from this study were produced using data available in public online repositories or in the published literature, data that are publicly available on request from the data provider, and data that are not publicly available due to restrictions by the data provider and which were used under license for the current study. Details on data sources can be found on the GHDx website, including information about the data provider and links to where the data can be accessed or requested (where available). To download the data used in these analyses, please visit the Global Health Data Exchange GBD 2021 website at https://ghdx.healthdata.org/gbd-2021.