Does physical activity reduce cardiovascular risk associated with knee osteoarthritis in type 2 diabetes? A nationwide cohort study
Article information

Abstract
Background/Aims
Knee osteoarthritis (OA), type 2 diabetes mellitus (T2DM), and cardiovascular disease (CVD) share overlapping mechanisms but are often managed independently. We evaluated whether knee OA increases CVD risk in Korean T2DM patients and whether physical activity (PA) modifies this risk.
Methods
We conducted a nationwide cohort study using data from the Korean National Health Insurance Service. A total of 1,068,215 adults with T2DM screened between 2009–2012 were followed until CVD events or end of follow-up in 2018. Knee OA was identified by ICD-10 codes and radiographic imaging. PA was classified as none, intermittent (≥ 1 session/week), or regular (≥ 3 sessions/week). Cox models were used to estimate hazard ratios (HRs) for myocardial infarction (MI), stroke, heart failure (HF), and cardiovascular mortality, adjusting for demographics, BMI, eGFR, lifestyle factors, hypertension, dyslipidemia, insulin use, and antidiabetic medication.
Results
Knee OA independently increased risks for overall CVD (HR 1.13, 95% CI 1.11–1.16), MI (1.07, 1.02–1.13), stroke (1.14, 1.10–1.18), and HF (1.13, 1.09–1.17). Cardiovascular mortality was not significantly increased (HR 0.99, 95% CI 0.92–1.07). The association was stronger among non-insulin users and patients with diabetes duration < 5 years. Even intermittent PA significantly reduced cardiovascular mortality among OA patients (HR 0.69, 95% CI 0.61–0.78).
Conclusions
Knee OA substantially elevates CVD risk in Korean T2DM patients, particularly early in disease progression. Even modest PA confers meaningful cardiovascular protection. Early cardiovascular assessment and tailored PA recommendations are essential for comprehensive diabetes management in patients with OA.

INTRODUCTION
Knee osteoarthritis (OA), type 2 diabetes mellitus (T2DM), and cardiovascular disease (CVD) are among the most prevalent chronic conditions globally [1,2]. They frequently coexist, compounding health burdens and increasing mutual risk through shared pathophysiological mechanisms [3].
Although the pathophysiological link between OA and diabetes remains incompletely understood, numerous studies have shown a higher prevalence of OA—particularly in weight-bearing joints such as the knee—among individuals with T2DM [4,5]. Moreover, several studies have reported an increased risk of CVD among individuals with OA [6–8]. These conditions also share common biological mechanisms—namely chronic inflammation, insulin resistance, and metabolic dysfunction—which may underlie their frequent coexistence and reciprocal risk amplification [9,10].
Physical activity plays a central role in T2DM management and CVD prevention [11]. However, knee OA frequently limits mobility, leading to reduced activity levels [12]. Despite this, even modest levels of exercise may offer cardiometabolic benefits for patients with both conditions, emphasizing its value as a modifiable risk factor. Thus, understanding the relationship between knee OA, T2DM, and CVD and the impact of exercise behavior on these conditions is of great importance.
While earlier nationwide studies have examined the link between knee OA and CVD in general populations, evidence in patients with T2DM remains scarce. Our study addresses this gap by analyzing a large T2DM cohort with long-term follow-up, evaluating physical activity as a potential effect modifier, exploring subgroup differences by diabetes status, and assessing a comprehensive range of cardiovascular (CV) outcomes, including mortality. Most previous studies were conducted in general populations without accounting for the presence of diabetes—a well-established CV risk enhancer [6, 13]. Those that considered T2DM often failed to assess functional limitations from OA, despite its role in reducing physical activity, a key modifiable risk factor [13]. In contrast, our study is the first to comprehensively evaluate these associations using a large-scale, nationwide population-based cohort, and to demonstrate that physical activity may mitigate CVD risk in this high-risk group. Using National Health Insurance Service (NHIS) data, we investigated the risk of CVD—including myocardial infarction (MI), stroke, heart failure (HF), and CV mortality—in individuals with knee OA and T2DM, and evaluated the potential impact of exercise behavior on CVD development.
METHODS
Data for the present study were obtained from the NHIS claim database between January 1, 2009 and December 31, 2012, which is a unified insurance provider that covers approximately 97% of the South Korean population [14]. This database was linked to the health examination database established by the NHIS.
The NHIS database contains medical claims information, including diagnoses and prescriptions, coded according to the International Classification of Diseases, 10th Revision (ICD-10) [15,16], and also includes self-reported data on demographic details and health-related behaviors such as exercise, smoking, and alcohol consumption obtained from general health examinations conducted every two years. The reliability of NHIS cohorts has been verified in previous studies [17,18].
Study population
The cohort for this study consisted of 2,746,079 individuals diagnosed with T2DM during comprehensive health examinations from January 1, 2009 to December 31, 2012. To minimize potential reverse causality, individuals who had been diagnosed with knee OA or had experienced any CVD—defined as MI, stroke, or HF—prior to the index year, or who developed CVD within one year thereafter, were excluded. Furthermore, individuals below the age of 50 years were excluded, as most cases of OA occur after this age [19]. After excluding missing values, the final analysis included 1,068,215 subjects (Fig. 1).

Flow chart of the cohort selection. MI, myocardial infarction; HF, heart failure; OA, osteoarthritis.
Ascertainment of T2DM, knee OA, outcomes, and follow-up
To be considered as having T2DM in this study, patients must have had ICD-10-CM codes E11–E14 present, along with either claims for at least one oral anti-diabetic agent or insulin at baseline, or a fasting glucose level ≥ 126 mg/dL [20]. As previously validated [21] and used in previous studies [22,23], knee OA was identified using the ICD-10 code for knee OA (M17) or any site OA code (M15 for polyarthrosis or M19 for other arthrosis) along with a procedure code for a knee X-ray within the same claim.
The primary endpoint of this study was the diagnosis of MI (ICD-10 codes I21, I22), stroke (ICD-10 codes I63, I64), or HF (ICD-10 codes I50), as determined by specific ICD-10 codes. MI and HF were defined as one or more codes accompanied by hospitalization, whereas stroke was defined as a corresponding ICD-10 code for diagnoses during hospitalization as assessed by brain imaging. These definitions have been previously validated in relevant studies, ensuring their reliability [24,25]. CVD onset was defined as the diagnosis of MI, stroke, or HF. Participants were followed up from the index date until CVD diagnosis or December 31, 2018, whichever came first. To minimize reverse causation and surveillance bias, participants who experienced a CVD event within 1 year after OA ascertainment were excluded, applying this washout period equally to both OA and non-OA groups. CV mortality was defined as death with a primary cause coded under ICD-10 I00–I99 in the national death registry linked to NHIS. Cause-of-death ascertainment in this linkage has been validated previously [25]. Follow-up for CV mortality continued until death or December 31, 2018. Non-CVD deaths were treated as censored events, representing a cause-specific hazard approach.
Assessment of sociodemographic, lifestyle, and clinical variables
Sociodemographic variables included income status, which was categorized into quintiles based on the monthly health insurance premium to the NHIS and used as a proxy for socioeconomic status in this study.
Lifestyle-related factors, such as smoking, alcohol consumption, and physical activity, were assessed using standardized self-administered questionnaires. Participants were classified as never, former, or current smokers. Drinking status was categorized as none, moderate (1–30 g/day), and heavy (≥ 30 g/day). Exercise behavior was stratified into intermittent and regular exercise based on frequency, intensity, and duration. Specifically, intermittent exercise was defined as (1) moderate physical activity for more than 30 minutes, at least once a week, or (2) vigorous physical activity for more than 20 minutes, at least once a week. Regular exercise was defined as (1) moderate physical activity for more than 30 minutes, at least five times a week, or (2) vigorous physical activity for more than 20 minutes, at least three times a week [26]. Physical activity categories were defined clearly, aligning with standardized national health examination protocols used in Korea. The questionnaire follows the International Physical Activity Questionnaires (IPAQ) framework and has shown good repeatability (ρ ≈ 0.8) and moderate validity in international [27] and Korean [28] studies.
Clinical variables included comorbidities, laboratory data, and antidiabetic medications. We used a validated methodology [29] to define hypertension and dyslipidemia, based on ICD-10 codes, prescription claims, or clinical measurements from health check-ups. Supplementary Table 1 provides detailed definitions of these comorbidities. Participants fasted for at least eight hours from midnight before undergoing blood collection to measure fasting glucose, creatinine, and lipid profiles. Chronic kidney disease was defined as an estimated glomerular filtration rate (eGFR) < 60 mL/min/1.73 m2.
We categorized glucose lowering agents into seven distinct groups, namely insulin, sulfonylurea, metformin, meglitinide, thiazolidinedione, dipeptidyl peptidase 4 inhibitors, and alpha-glucosidase inhibitors [30]. We collected information on medication types to classify antidiabetic drug classes and to identify participants who were prescribed three or more classes of oral agents.
Ethical considerations
This study adhered to the ethical principles outlined in the Declaration of Helsinki. It was approved by both the KNHIS (IRB No. SSU-202003-HR-201-01) and the IRB of the Catholic University of Korea (IRB No. VC23ZISI0068), and the need for informed consent was waived by the IRB due to the retrospective nature of the study and the anonymized nature of the data.
Statistical analysis
Continuous variables were expressed as mean ± standard deviation, while categorical variables were presented as numbers and percentages. We used a Student’s t-test to compare continuous variables and a chi-square test to compare categorical variables between cohorts. Incidence rates of CVD, MI, stroke, HF, and CV mortality were reported per 1,000 person-years. The cumulative probability of developing CVD, MI, stroke, HF, and CV mortality were depicted in Kaplan–Meier curves and compared using the log-rank test.
We utilized a multivariable Cox proportional hazards regression model to estimate hazard ratios (HRs) and 95% confidence intervals (CIs) to assess the associations between knee OA, CVD, and CV mortality. We assessed the proportional hazards assumption using Schoenfeld residuals with the logarithm of the cumulative hazards function and found no significant departures from proportionality over time. We identified potential confounders and effect modifiers based on a priori knowledge from a literature review. The following covariates were included in the multivariable-adjusted models at baseline: age, sex, income status, hypertension, dyslipidemia, smoking, alcohol consumption, exercise, body mass index (BMI), eGFR, insulin use, number of oral antidiabetic medications, and duration of diabetes.
To evaluate effect modification, interaction terms between knee OA and each potential modifier (age, sex, insulin use, number of oral antidiabetic medications, and diabetes duration) were included in the multivariable Cox regression models. Statistical significance of interaction was assessed using likelihood ratio tests comparing models with and without the interaction terms. The modifiers were categorized as follows: age (< 65 yr vs. ≥ 65 yr), number of oral antidiabetic drugs used (< 3 vs. ≥ 3), and duration of diabetes (< 5 yr vs. ≥ 5 yr). This cut-off was chosen to distinguish early from more established disease and to maintain adequate subgroup sizes for interaction analyses. We also performed an additional analysis according to exercise behavior. All subgroup and interaction analyses were exploratory in nature, and thus require multiplicity-aware interpretation. Detailed subgroup results are provided in the Supplementary materials. The p values provided are two-sided, with the level of significance at 0.05. All statistical analysis procedures were performed with SAS version 9.4 (SAS Institute, Cary, NC, USA).
RESULTS
Baseline characteristics
Table 1 summarizes the baseline characteristics of participants with T2DM according to the presence of knee OA. Among 1,068,215 participants, 48,561 (4.45%) were classified as having knee OA. Participants with knee OA were older (62.49 ± 8.11 yr vs. 59.58 ± 7.77 yr, p < 0.0001) and included a lower proportion of males (45.7% vs. 69.3%, p < 0.0001). The OA group had a higher prevalence of hypertension (61.7% vs. 56.7%) and dyslipidemia (44.9% vs. 39.6%) (both p < 0.0001). Additionally, those with knee OA had a higher BMI (25.11 ± 3.27 kg/m2 vs. 24.62 ± 3.07 kg/m2, p < 0.0001), were more likely to belong to the lowest income quintile (23.1% vs. 21.9%, p < 0.0001), and were less likely to smoke (current smoking: 16.5% vs. 26.8%, p < 0.0001) or consume alcohol (heavy drinking: 7.7% vs. 11.4%, p < 0.0001). The OA group also reported lower rates of regular exercise (22.3% vs. 23.8%, p < 0.0001).

Baseline characteristics of study participants according to knee osteoarthritis
Incidence and risk of CVD and CV mortality in T2DM with knee OA
The incidence rates of CV outcomes were higher in patients with knee OA than in those without, as shown in Table 2 and Figure 2. Specifically, per 1,000 person-years, incidence rates were 23.25 vs. 18.23 for CVD, 4.38 vs. 3.86 for MI, 11.70 vs. 8.97 for stroke, 10.62 vs. 8.19 for HF, and 2.26 vs. 1.91 for CV mortality. All differences were statistically significant (log-rank p < 0.0001).

Risk of cardiovascular events, MI, stroke, HF, and cardiovascular mortality between diabetics with and without knee OA

Comparison of (A) cardiovascular events, (B) myocardial infarction, (C) stroke, (D) heart failure, and (E) cardiovascular mortality between diabetics with and without knee osteoarthritis using a log-rank p value. OA, osteoarthritis.
After adjusting for sociodemographic (age, sex, income), lifestyle (smoking status, alcohol consumption, physical activity), clinical (hypertension, dyslipidemia, BMI, eGFR), and diabetes-related factors (insulin use, number of oral antidiabetic medications, duration of diabetes), knee OA remained significantly associated with increased risk of CVD (HR 1.13, 95% CI 1.11–1.16), MI (HR 1.07, 95% CI 1.02–1.13), stroke (HR 1.14, 95% CI 1.10–1.18), and HF (HR 1.13, 95% CI 1.09–1.17). However, no significant association was found for CV mortality (HR 0.99, 95% CI 0.92–1.07).
Effect modification by insulin use and diabetes duration
Figure 3 and Supplementary Table 2 present the stratified analyses assessing effect modification. Age and sex did not significantly modify the association between knee OA and CVD risk. However, significant interactions were observed for insulin use (p for interaction = 0.006 for CVD; 0.001 for HF) and diabetes duration (p for interaction = 0.001 for CVD; 0.004 for stroke; 0.019 for HF).

Forest plot for subgroup analysis of association between knee osteoarthritis and the risk of (A) cardiovascular events, (B) myocardial infarction, (C) stroke, (D) heart failure, and (E) cardiovascular mortality. DM, diabetes mellitus.
Among non-insulin users, the adjusted HRs for knee OA were higher compared to insulin users for both CVD (HR 1.13, 95% CI 1.10–1.16 vs. HR 1.04, 95% CI 0.98–1.10) and HF (HR 1.14, 95% CI 1.10–1.19 vs. HR 0.98, 95% CI 0.90–1.06). Similarly, the association between knee OA and CV outcomes was more pronounced in patients with a shorter duration of diabetes (< 5 yr), who exhibited higher relative risks than those with longer disease duration (≥ 5 yr), despite having lower absolute incidence rates. Although absolute CVD incidence was highest in insulin users and those with longer diabetes duration, the relative association was greater in lower baseline-risk subgroups. These subgroup analyses were exploratory and not prespecified. The absolute incidence difference for CVD was approximately +5 events per 1,000 person-years among OA patients, providing additional clinical context beyond relative measures.
Impact of exercise behavior on CV outcomes
Given the known impact of OA on physical activity, we investigated whether exercise behavior modified the association between knee OA and CV outcomes (Table 3). Among T2DM patients with knee OA, those who did not engage in either intermittent or regular exercise had significantly higher risks of CVD compared to physically inactive patients without knee OA (HR 1.10, 95% CI 1.07–1.13 for intermittent; HR 1.11, 95% CI 1.08–1.14 for regular). In particular, non-exercising knee OA patients showed increased risks of stroke and HF (HR 1.12 and 1.08, respectively for intermittent; HR 1.11 and 1.10 for regular) compared to their non-OA counterparts.
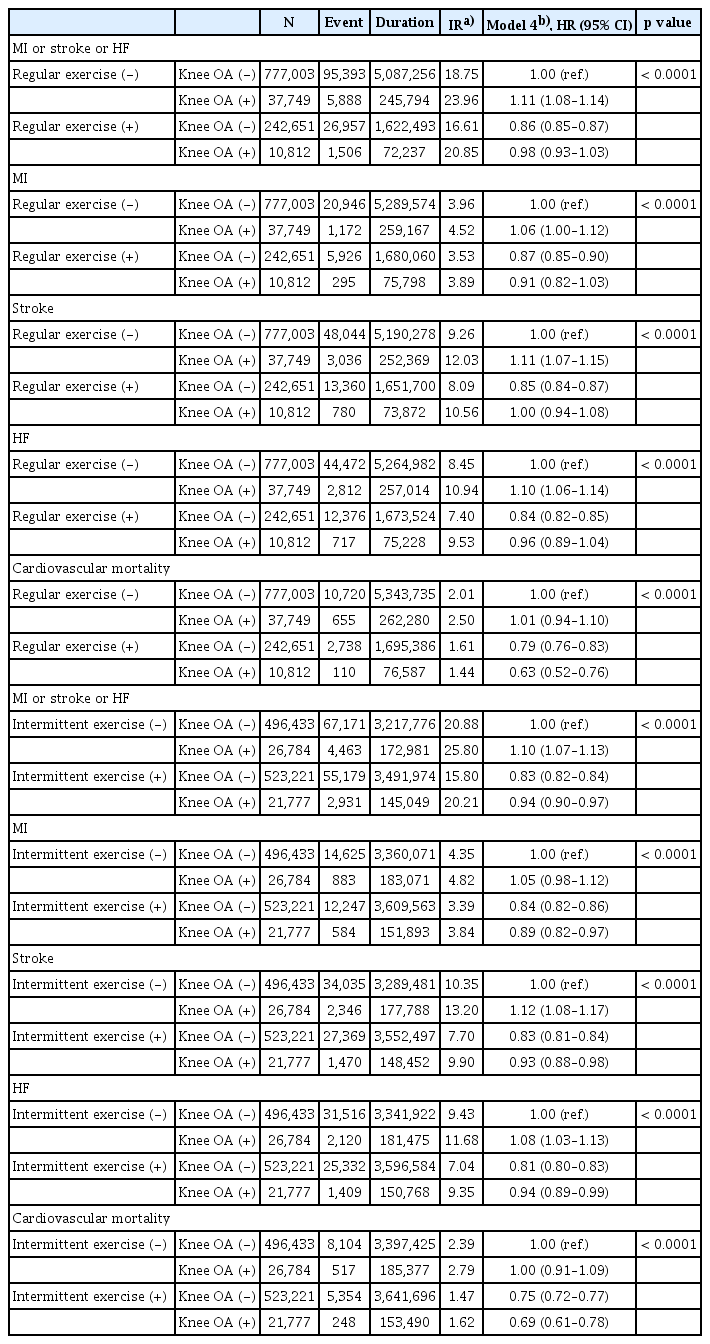
The risk of cardiovascular events, MI, stroke, HF, and cardiovascular mortality according to the knee OA and exercise behavior
In contrast, even modest levels of physical activity were associated with reduced CV risks in the OA group. For example, engaging in intermittent exercise at least once per week was associated with decreased risks of CVD (HR 0.94, 95% CI 0.90–0.97), MI (HR 0.89, 95% CI 0.82–0.97), stroke (HR 0.93, 95% CI 0.88–0.98), HF (HR 0.94, 95% CI 0.89–0.99), and CV mortality (HR 0.69, 95% CI 0.61–0.78).
A similar protective effect was observed with regular exercise. CV mortality was significantly lower among those with knee OA who performed regular (HR 0.63, 95% CI 0.52–0.76) or intermittent exercise (HR 0.69, 95% CI 0.61–0.78), compared to those who remained inactive.
DISCUSSION
To our knowledge, this is the first large-scale, population-based cohort study to examine the CV impact of knee OA in patients with T2DM.
Our findings yield three key insights. First, knee OA was independently associated with increased CVD risk after adjustment for sociodemographic, clinical, and diabetes-related factors. Second, this association was more pronounced among non-insulin users and those with a diabetes duration of less than 5 years, indicating greater vulnerability in earlier or less intensively managed stages of the disease. Third, both regular and intermittent physical activity were linked to significantly lower risks of CVD, MI, stroke, HF, and CV mortality—the greatest reduction observed for mortality. These findings underscore the protective effect of even modest exercise in this high-risk population.
T2DM, knee OA, and CVD are prevalent chronic conditions with substantial individual and societal burden. Their coexistence may exacerbate adverse outcomes, underscoring the importance of understanding their interrelationships to guide prevention strategies [4].
T2DM is a well-established risk factor for CVD, leading to complications such as MI, stroke, and HF. This heightened risk stems from hyperglycemia, insulin resistance, systemic inflammation, and coexisting hypertension or dyslipidemia [31–33]. Although the OA–CVD relationship remains debated, multiple studies suggest an increased CVD risk among individuals with knee OA [13, 34]. OA and CVD share common risk factors—hypertension, diabetes, dyslipidemia, and obesity—as supported by epidemiological evidence [35,36]. OA is also recognized as a chronic low-grade inflammatory condition contributing to endothelial dysfunction, insulin resistance, and atherogenesis [37]. These mechanisms may underlie the amplified CVD risk when OA coexists with T2DM. Additionally, knee OA often limits physical activity—a modifiable CVD risk factor—due to associated muscle weakness and disability [38,39].
Our study found that T2DM patients with knee OA had a 27% higher risk of CVD compared to those without knee OA in the unadjusted analysis, suggesting that knee OA is a potential risk factor for CVD in individuals with T2DM. However, after adjusting for potential confounding factors, including comorbidities such as hypertension and dyslipidemia, the increased risk of CVD was attenuated but still remained significantly elevated at 11%. This indicates that knee OA is independently associated with an increased occurrence of CVD in T2DM patients, even after accounting for the higher baseline prevalence of comorbidities in the knee OA group.
Importantly, these adjusted estimates represent the direct effect of knee OA on CVD after accounting for physical activity and BMI. Because both may lie on the causal pathway, the total effect of OA could have been underestimated. To assess robustness, we calculated E-values (1.46–1.54 for CVD and stroke), suggesting that only moderately strong unmeasured confounding would suffice to fully explain the observed associations. Notably, baseline differences in exercise participation and BMI between OA and non-OA groups were modest in our cohort, suggesting that these mediators may account for part but not all of the observed association. Despite these considerations, the overall body of evidence—including meta-analyses—supports a robust association between OA and CV outcomes.
A growing body of evidence supports an association between OA and CVD. A meta-analysis of 49 studies reported that hip and knee OA were associated with increased risks of subclinical atherosclerosis (OR 1.15, 95% CI 1.01–1.31) and CVD (OR 1.13, 95% CI 1.05–1.22), but not with CV mortality (OR 1.08, 95% CI 0.99–1.19) [40]. Another study synthesizing five meta-analyses from 3,847 articles found that knee OA significantly increased the risk of CV mortality, falls, and conditions linked to subclinical atherosclerosis [41]. These findings, combined with the known CV risks of T2DM, suggest that individuals with both conditions may face a compounded risk of CVD.
Interestingly, while knee OA was associated with increased CVD events in T2DM patients, our study did not find a significant difference in CV mortality (HR 0.99, 95% CI 0.92–1.07). This apparent paradox may reflect survival bias, as OA patients may receive more frequent medical attention and earlier CV interventions, improving survival despite higher event rates. Differences in healthcare access and treatment intensity may also play a role. Further studies with longer follow-up and mechanistic analyses are needed to clarify these relationships.
We observed significant effect modification by insulin use (p for interaction = 0.006) and diabetes duration (p for interaction = 0.001) in the association between knee OA and CVD among patients with T2DM. Although absolute CVD incidence was higher in insulin users and those with longer diabetes duration, the relative risk increase associated with knee OA was more pronounced in non-insulin users and those with diabetes duration < 5 years. This suggests that knee OA may confer greater additional CV risk in earlier or less intensively treated stages of T2DM. These findings underscore the need for early risk assessment and CVD prevention strategies in patients with knee OA—even when diabetes appears mild or well-controlled. Similar trends have been reported in previous studies, where shorter diabetes duration paradoxically correlated with higher relative CVD risk [42,43]. This pattern likely reflects a baseline-risk or “ceiling” effect, where an equivalent absolute increase in CVD risk from OA produces a smaller relative effect in high-risk groups and a larger relative effect in lower-risk groups. Absolute CVD risk, however, remained highest in insulin users and those with longer diabetes duration. The < 5-year threshold reflects an early-phase vs. established-phase distinction commonly used in cohort studies and allowed balanced subgroup sizes for effect-modification testing. These findings should be interpreted cautiously, as the subgroup analyses were exploratory and not adjusted for multiplicity.
The increased CVD risk among non-insulin users with knee OA may reflect several factors. These individuals may have lower treatment adherence, resulting in suboptimal control of both glycemic and CV risk profiles. Additionally, lack of insulin therapy could signal less intensive disease management, potentially amplifying inflammatory pathways shared by OA and atherosclerosis. Finally, disparities in healthcare utilization may delay diagnosis and intervention for CVD in this group.
A similar pattern was observed in patients with shorter diabetes duration (< 5 yr). In long-standing T2DM, the cumulative burden of metabolic dysfunction may overshadow the relative impact of OA on CVD risk. Survival bias may also play a role, as patients who survive longer or receive intensive treatment may represent a lower-risk subgroup. In contrast, early-stage diabetes often features heightened systemic inflammation, potentially amplifying OA-related CV risk. Furthermore, patients with longer disease duration typically receive more aggressive CV risk management and accumulate comorbidities such as obesity, hypertension, and dyslipidemia—factors that may dilute or obscure the additional risk conferred by OA.
These findings have important clinical implications. In patients with T2DM, knee OA should not be regarded merely as a musculoskeletal issue causing functional limitation. Rather, it may contribute to CV vulnerability through shared inflammatory and metabolic mechanisms. Given the additive risk observed, OA status may warrant inclusion in CVD risk stratification—particularly in patients with shorter diabetes duration or those managed without insulin.
Previous studies suggest that this elevated CVD risk in OA populations may be partly mediated by reduced physical activity [44]. A large meta-analysis reported that OA was associated with a 24% higher CVD risk, partly explained by lower activity levels. In a nationwide Korean cohort, knee OA patients who did not engage in regular exercise had a significantly higher CVD risk (HR 1.25), whereas those exercising at least once per week showed no significant excess risk compared with individuals without OA [23]. Similar findings from other population-based studies consistently link higher physical activity levels with lower CVD incidence in OA patients [27]. Collectively, this evidence reinforces the role of exercise as a modifiable factor that can mitigate CV risk in OA.
To mitigate this risk, healthcare providers should promote regular physical activity and comprehensive CVD risk monitoring in T2DM patients with knee OA. Even modest exercise was associated with substantial reductions in CV events and mortality in our cohort. Early intervention may be particularly beneficial for patients not yet requiring insulin. An integrated approach addressing both musculoskeletal and cardiometabolic factors could help improve long-term outcomes in this vulnerable population.
Knee OA can increase CVD risk by limiting physical activity and leading to a sedentary lifestyle [45]. However, regular exercise has been shown to reduce CVD risk factors such as obesity, T2DM, and hypertension [46–48]. Despite concerns that exercise may worsen OA symptoms, growing evidence suggests it can reduce pain and disability and is not the cause of OA unless injured, particularly in knee OA [49–51].
The present study found that T2DM patients with knee OA who exercised had a lower risk of CVD compared to those with poor exercise habits. Even as little as 20–30 minutes of exercise once a week was shown to reduce the risk of CVD. These findings demonstrate the effectiveness of exercise in preventing CVD in T2DM patients with knee OA and emphasize the potential CVD risk in non-exercising patients.
While our study demonstrated significant CV benefits from both intermittent and regular exercise, we did not assess the effects of specific exercise types or intensities. Existing evidence suggests that aerobic and resistance training offer distinct CV benefits in this population. Aerobic activities improve endothelial function and insulin sensitivity with minimal joint stress, while resistance training enhances glycemic control, muscle strength, and reduces inflammation. Low-intensity exercise may also benefit those with mobility limitations, potentially explaining the observed risk reduction even in our intermittently active group.
Our findings highlight that even low-frequency physical activity (once per week) confers meaningful CV benefits in T2DM patients with knee OA, likely through improved endothelial function, insulin sensitivity, and reduced systemic inflammation [23, 52]. Notably, the observed reduction in CV mortality exceeded that for overall CVD risk—an encouraging finding for patients with mobility limitations.
Different types of exercise may exert distinct benefits: aerobic activities (e.g., walking, cycling) enhance endothelial function and glycemic control with minimal joint stress, while resistance training strengthens periarticular muscles, improves glucose metabolism, and reduces inflammation. These differential effects may explain why even intermittent activity was associated with significant CV protection in our study.
Future research should further clarify the comparative impact of exercise modalities and intensities on both OA symptoms and CV outcomes. Until such data become available, any regular physical activity should be strongly encouraged to reduce both CV risk and mortality in this high-risk population.
Several limitations should be considered when interpreting our findings. Firstly, the use of NHIS claims data may introduce misclassification bias; however, we minimized this risk by applying validated operational definitions. Secondly, the retrospective observational design limits causal inference. While we identified a significant association between knee OA and CVD in T2DM patients, causality cannot be established. Future prospective studies with longer follow-up and mechanistic investigations are needed to clarify underlying inflammatory and metabolic pathways connecting these conditions. Thirdly, we could not assess knee OA severity or functional impairment due to data limitations. CV risk may vary based on radiological severity (e.g., Kellgren-Lawrence Grade), pain levels, and mobility restrictions. In addition, glycemic control status, such as HbA1c levels, was not available in the dataset, limiting our ability to evaluate the influence of diabetes severity on CV outcomes. Fourthly, knee OA status and physical activity were assessed only at baseline, although both may change during follow-up. This could have led to exposure misclassification and prevented us from evaluating persistence, lagged effects, or activity trajectories. Advanced approaches such as extended Cox models, inverse probability of treatment weighting (IPTW) marginal structural models, or landmark analyses were not feasible due to the biennial nature of NHIS examinations and the risk of attrition bias. Fifthly, the self-reported exercise data may be subject to recall bias. While self-reported activity may be overestimated, the IPAQ-based NHIS tool is validated, and any non-differential error would likely bias results toward the null. Moreover, our analysis only categorized exercise by frequency (intermittent vs. regular), without accounting for exercise type or intensity. Future research should focus on distinguishing the specific effects of aerobic, resistance, and flexibility training on CV outcomes in patients with knee OA and T2DM, as well as determining optimal intensity, duration, and progression protocols for different patient subgroups. Longitudinal studies tracking both adherence and physiological adaptations could provide valuable insights for developing evidence-based exercise prescriptions. Sixthly, we could not estimate class-specific HRs for individual antidiabetic drugs; instead, our models adjusted for insulin use and the number of oral drug classes to account for treatment intensity and disease severity. We also did not perform Fine–Gray competing risk analyses or incorporate time-varying medication exposures, due to data constraints. We were also unable to generate unadjusted total-effect estimates or conduct formal mediation analyses to quantify the role of physical activity and adiposity, which remain important directions for future research once renewed data access becomes available. Lastly, generalizability may be limited, as our cohort was derived from a Korean population. Additional research in diverse populations with varied genetic backgrounds, dietary patterns, and healthcare systems is necessary to confirm the broader applicability of our findings and identify population-specific risk factors or protective mechanisms. We acknowledge this as a limitation and highlight it as a priority for future research.
T2DM and knee OA are prevalent conditions that contribute to a significant medical, social, and economic burden, particularly when accompanied by CVD. Encouraging healthy exercise behaviors among T2DM patients with knee OA can effectively reduce the risk of CVD, regardless of disease duration or treatment modality. Future studies should investigate optimal exercise methods and intensities to further improve CVD and mortality outcomes in this patient population.
In conclusions, in this large-scale cohort study, knee OA was independently associated with increased CVD risk in patients with T2DM, especially among non-insulin users and those with shorter diabetes duration. Even modest physical activity was linked to lower CVD incidence and CV mortality.
These findings underscore the value of incorporating tailored exercise strategies into diabetes care, particularly for patients with mobility limitations due to OA. Early, individualized interventions may offer a pragmatic approach to reducing cardiometabolic risk in this high-risk population.
Although causality cannot be inferred from this observational study, the consistency of associations across multiple outcomes and subgroups strengthens confidence in the findings. Future research should focus on refining exercise prescriptions—addressing type, intensity, and adherence—and identifying patient subgroups most likely to benefit. These insights support integrated care approaches for managing multimorbidity in chronic disease populations.
KEY MESSAGE
1. Knee OA independently increased the risks of CVD, MI, stroke, and HF in patients with T2DM.
2. This relative excess CV risk was more evident in non-insulin users and in those with a diabetes duration of less than 5 years.
3. Even intermittent physical activity was associated with lower risks of CV events and CV mortality in patients with knee OA.
Notes
Acknowledgments
The authors thank the participants of the Korean National Health Insurance Service-Health Screening program.
The authors used ChatGPT (OpenAI) to support language editing and structural refinement during the manuscript preparation. All scientific content and interpretations were developed and verified by the authors. The final manuscript was reviewed in full to ensure its accuracy and originality.
CRedit authorship contributions
Dojoon Park: conceptualization, investigation, writing - original draft, visualization; Kyuho Kim: conceptualization, writing - review & editing, supervision; Hae-Seok Koh: writing - review & editing, supervision; Kyungdo Han: methodology, resources, investigation, data curation, formal analysis, visualization; Youn-Ho Choi: conceptualization, investigation, writing - review & editing, supervision
Conflicts of interest
The authors disclose no conflicts.
Funding
This research was supported by the Catholic Medical Center Research Foundation (2024) and the Research Institute of Medical Science, St. Vincent’s Hospital, The Catholic University of Korea (Grant No. VC23ZISI0068). The funders had no role in study design, data collection, analysis, decision to publish, or preparation of the manuscript. This research received no external funding.
Availability of data and materials
The data used in this study are owned by the Korean National Health Insurance Service (NHIS) and are not publicly available due to national data protection regulations. Access to the data is only possible through application and approval from the NHIS for research purposes. Further information is available at https://nhiss.nhis.or.kr.