Association between remnant cholesterol and colorectal cancer risk in Korea: a nationwide population-based study
Article information

Abstract
Background/Aims
Remnant cholesterol (RC) has emerged as a novel lipid marker with potential implications in cardiovascular and metabolic diseases. However, its association with colorectal cancer (CRC) remains unclear.
Methods
We conducted a retrospective cohort study using data from 364,626 Korean adults who underwent a national health screening between 2012 and 2013. RC and other lipid parameters were categorized into quartiles. Participants were followed up until CRC diagnosis, death, or December 31, 2019. Cox proportional hazards models were used to estimate the adjusted hazard ratios (HRs) and 95% confidence intervals (CIs) after controlling for demographic, clinical, and lifestyle factors.
Results
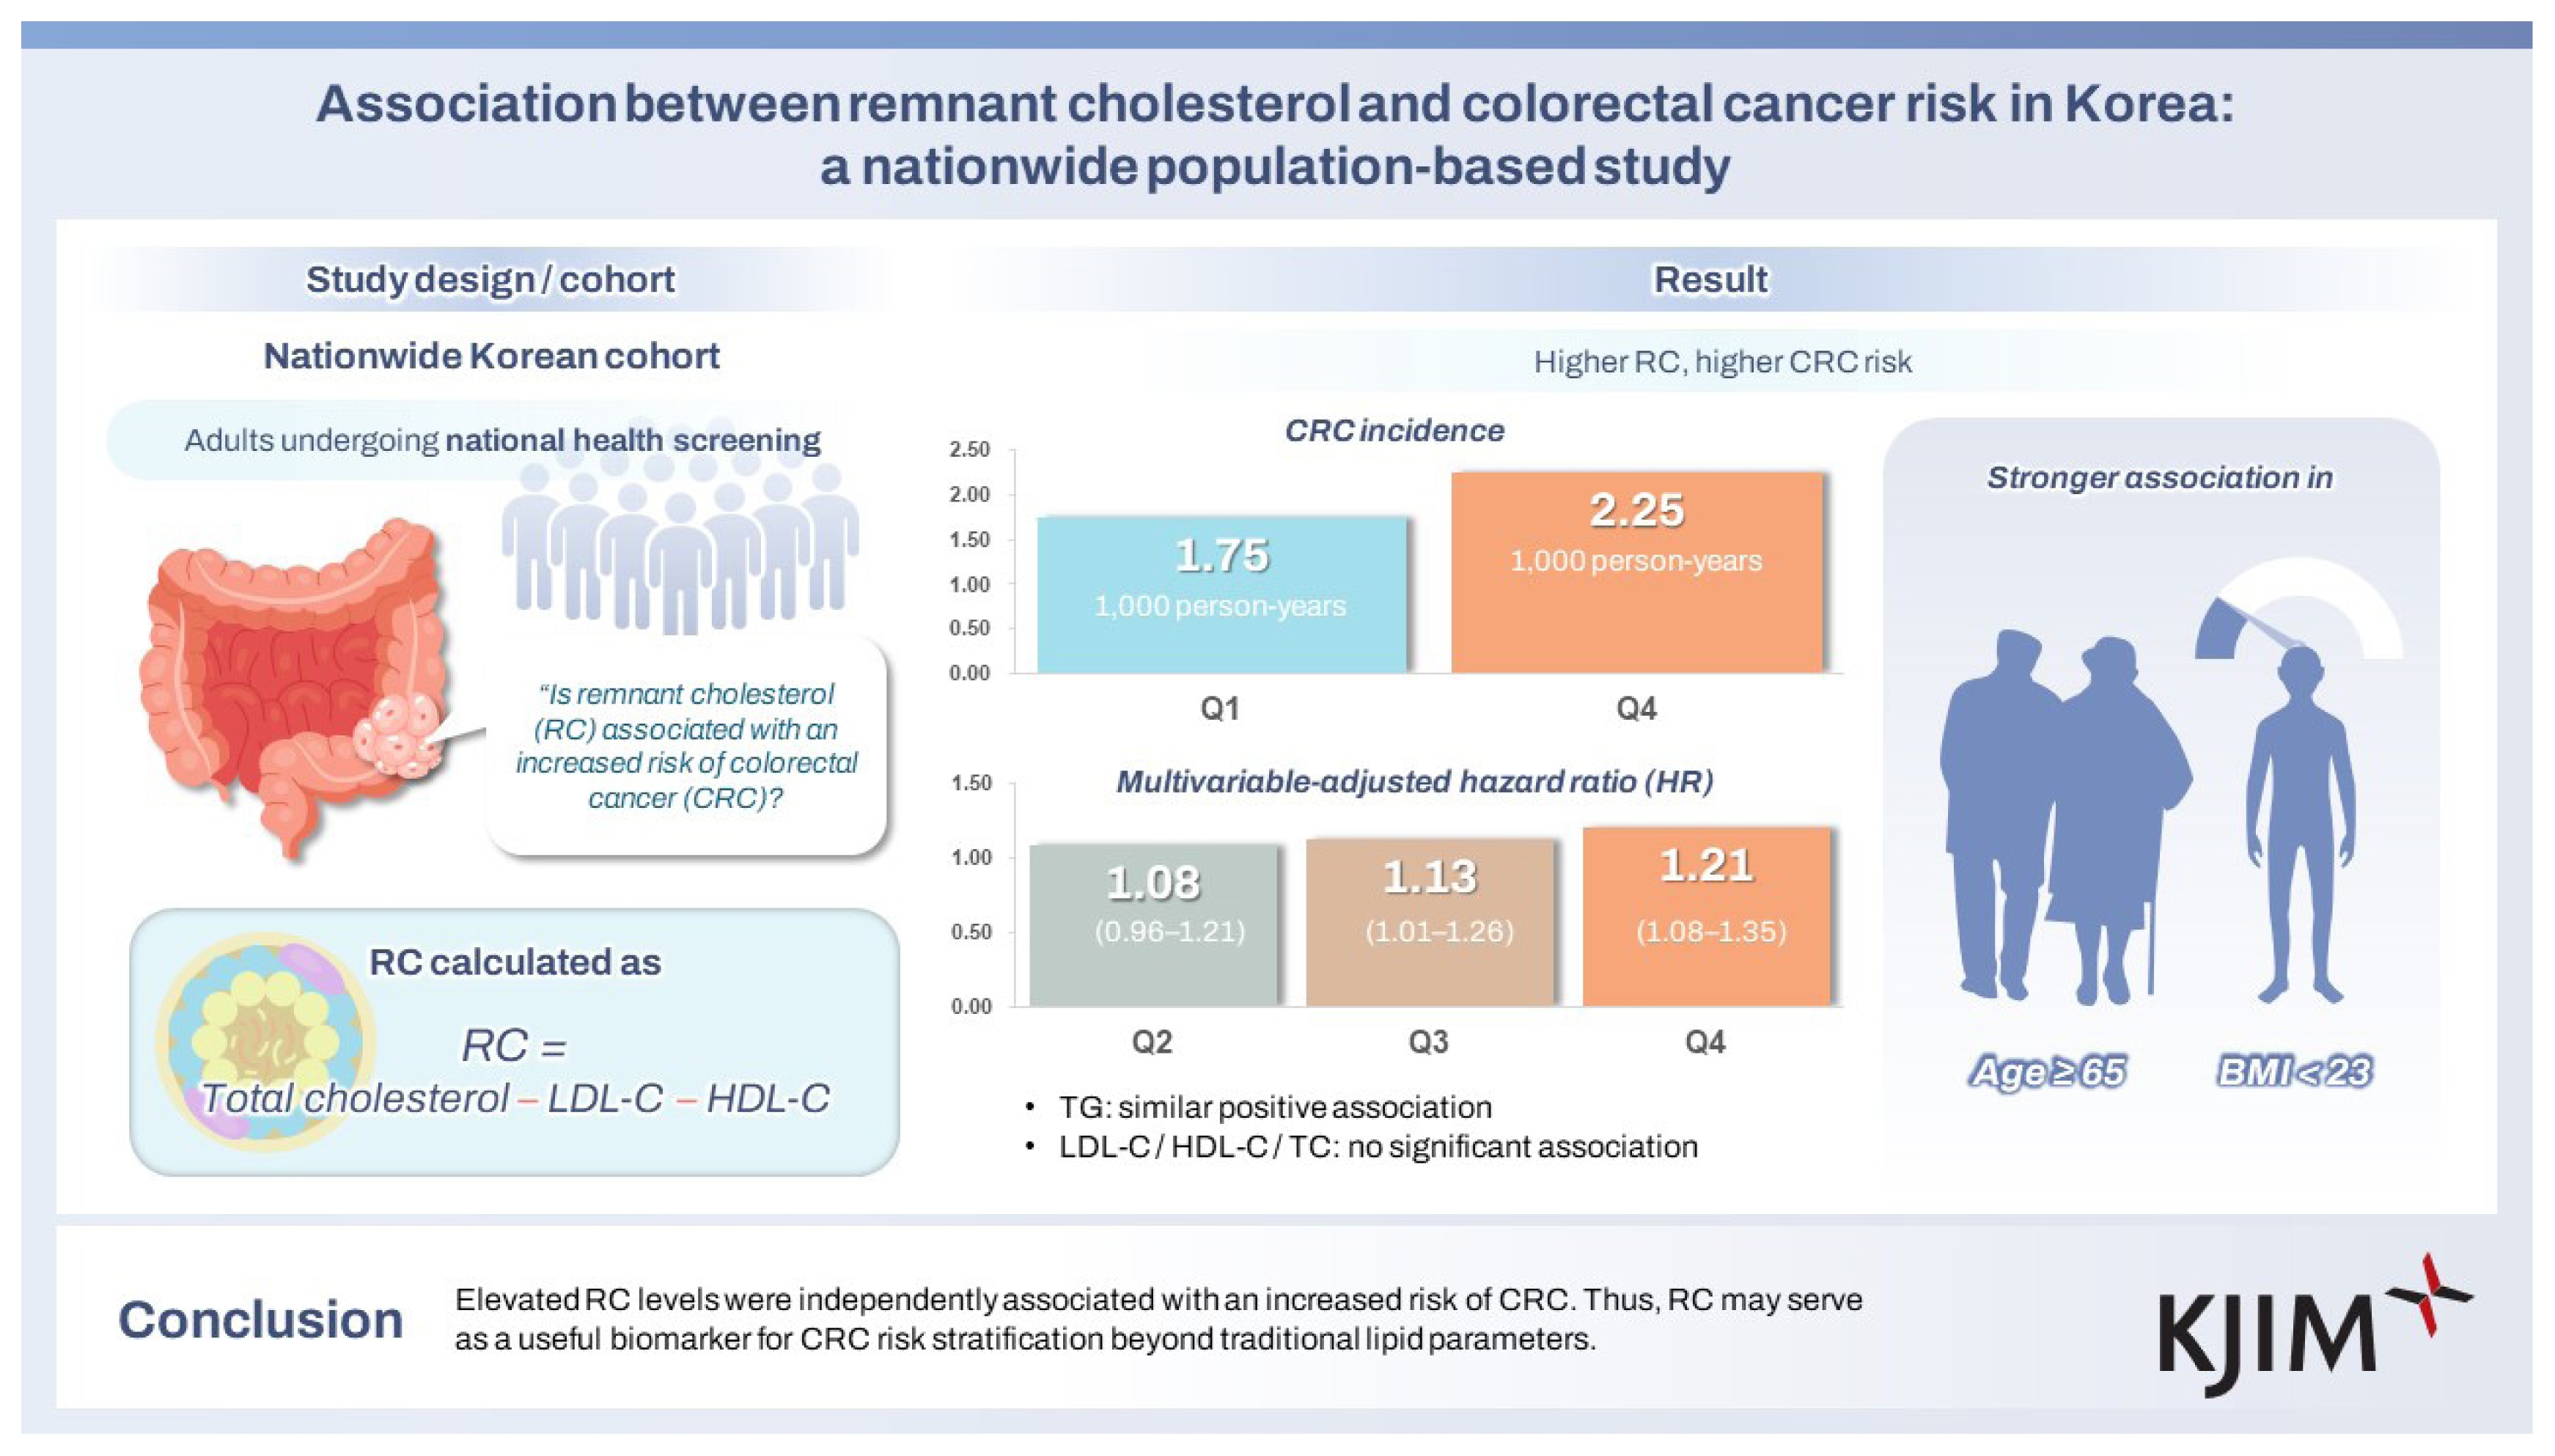
CRC incidence increased from 1.75 to 2.25 per 1,000 person-years across the RC quartiles. When compared with Q1, adjusted HRs were 1.08 (95% CI, 0.96–1.21) in Q2, 1.13 (1.01–1.26) in Q3, and 1.21 (1.08–1.35) in Q4. A similar trend was observed for triglycerides but not for low-density lipoprotein cholesterol, high-density lipoprotein cholesterol, or total cholesterol. In the subgroup analyses, the association between RC and CRC was stronger in participants aged ≥ 65 years and those with a body mass index < 23 kg/m2.
Conclusions
Elevated RC levels were independently associated with an increased risk of CRC. Thus, RC may serve as a useful biomarker for CRC risk stratification beyond traditional lipid parameters.
INTRODUCTION
Colorectal cancer (CRC) is the third most common cancer and the second leading cause of cancer-related deaths worldwide, accounting for nearly 10% of all cancer cases and deaths [1]. In South Korea, the incidence of CRC has steadily increased over the past few decades, partly because of aging populations, westernized diets, and lifestyle changes [2]. Given the increasing public health burden of CRC, the identification of modifiable risk factors has become a critical focus in cancer prevention. Lifestyle-related factors such as obesity, physical inactivity, smoking, heavy alcohol consumption, and processed meat intake have been implicated, with strong and consistent evidence supporting the role of excess body fat [3,4].
In addition to lifestyle factors, serum lipid profiles have drawn growing interest owing to their potential roles in colorectal carcinogenesis [5]. Although previous findings showed inconsistencies, several epidemiological studies and meta-analyses reported that elevated triglyceride (TG) and total cholesterol (TC) levels were associated with an increased risk of CRC [6]. For low-density lipoprotein cholesterol (LDL-C), while some studies have reported no significant association with CRC risk, others have suggested a weak but positive relationship, indicating that findings remain inconsistent [7–9]. In contrast, high-density lipoprotein cholesterol (HDL-C) has frequently been linked to a reduced CRC risk, despite a few studies reporting null associations [8,10,11]. Despite these trends, the interpretation of these associations remains challenging because of substantial heterogeneity across studies, which may have been due to differences in study design, population characteristics, and definitions of lipid parameters. In light of these inconsistencies, attention shifted toward emerging lipid markers that may offer improved insights into the risk of CRC.
Recently, remnant cholesterol (RC), defined as the cholesterol content of triglyceride-rich lipoproteins (TRLs), such as very-low-density lipoprotein (VLDL) and intermediate-density lipoprotein (IDL), has gained increasing attention as a distinct and clinically meaningful lipid marker [12,13]. RC reflects the cholesterol transported by atherogenic remnants that are not accounted for by LDL-C or HDL-C and is typically estimated by subtracting LDL-C and HDL-C from TC [14]. While RC has been widely studied in the context of cardiovascular disease, type 2 diabetes, dementia and ischemic stroke, its potential role in cancer, including CRC, remains largely unexplored [13,15,16]. Considering that other lipid components are also associated with CRC risk, RC may also be involved in colorectal carcinogenesis. However, population-based evidence supporting this association is limited.
Therefore, this study aimed to investigate the association between RC levels and the risk of incident CRC in a large nationally representative Korean cohort. Additionally, we assessed whether RC provided distinct or complementary information beyond traditional lipid parameters such as TG, LDL-C, HDL-C, and TC in relation to CRC risk.
METHODS
Study design and population
This retrospective cohort study utilized data from the Korean National Health Insurance Service-Health Screening Cohort (NHIS-HEALS), which provides biennial health screening data for individuals aged 40 years or older. The NHIS database contains comprehensive information on demographics, diagnoses, prescriptions, medical procedures, and lifestyle factors, enabling robust population-based analyses. This study was conducted using de-identified data provided by the National Health Insurance Service of Korea and was exempt from Institutional Review Board (IRB) review (IRB No. DAUHIRB-EXP-23-105) by the IRB of Dong-A University Hospital, in accordance with institutional and national ethical guidelines.
A total of 364,626 individuals who underwent health screening between January 1, 2012 and December 31, 2013, were initially considered. Several exclusion criteria were applied to establish a cancer-free cohort with valid baseline measurements. First, individuals with a cancer diagnosis before the index date were excluded (n = 47,518) to minimize reverse causation. Second, those prescribed lipid-lowering agents such as statins or fibrates at baseline were excluded to eliminate the confounding effects of pharmacological lipid modification (n = 103,108). Third, participants with missing or incomplete clinical, anthropometric, or laboratory data were excluded (n = 2,992). Finally, individuals with extreme lipid values, defined as values below the 1st percentile or above the 99th percentile for any lipid parameter, were excluded to ensure the biological plausibility and accuracy of RC estimation (n = 14,814). The exclusion criteria were as follows: RC < 7 or > 74 mg/dL, LDL cholesterol < 49 or > 197 mg/dL, HDL cholesterol < 30 or > 93 mg/dL, TC < 126 or > 284 mg/dL, and TG < 36 or > 398 mg/dL.
After applying all exclusion criteria, the final analytical cohort consisted of 196,194 participants. Follow-up continued from the baseline health-screening date until the earliest CRC diagnosis, death, or December 31, 2019. The selection process is illustrated in Figure 1.
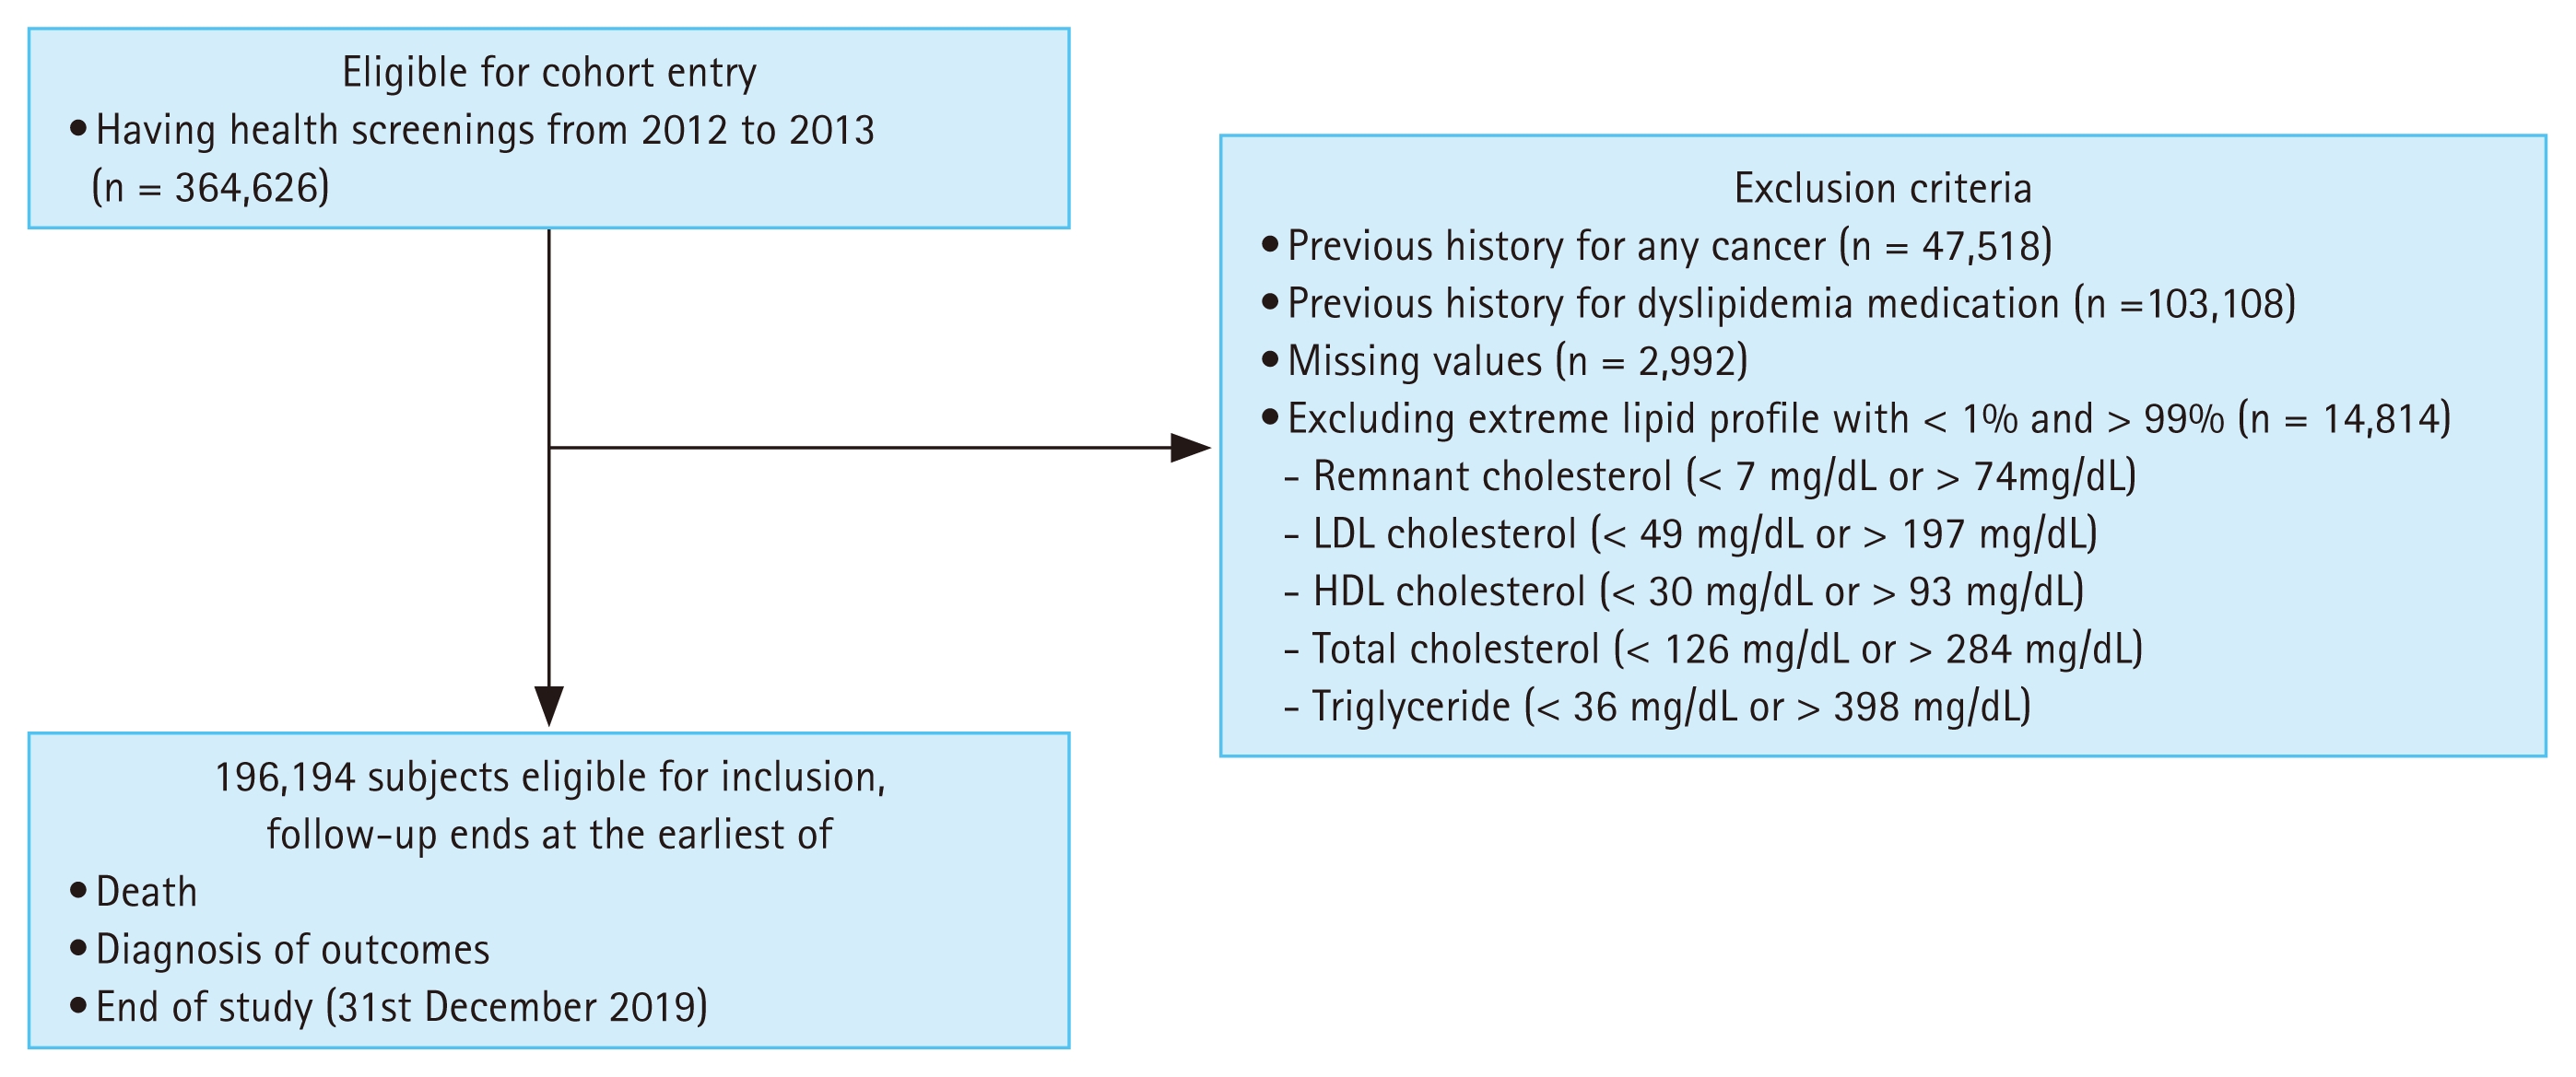
The study population selection process. LDL, low-density lipoprotein; HDL, high-density lipoprotein.
Definitions for RC
RC was estimated indirectly using fasting lipid profile values based on the following widely accepted formula:
The calculated RC reflects the cholesterol content of TRLs, primarily VLDL and IDL. Although this method is widely used, its accuracy can be limited to individuals with TG levels ≥ 400 mg/dL, as the commonly used Friedewald formula for LDL cholesterol becomes unreliable under such conditions [17]. However, in the present study, individuals with extreme TG values below the 1st percentile (< 36 mg/dL) or above the 99th percentile (≥ 398 mg/dL) were excluded from the analysis. As a result, no participants with TG levels ≥ 400 mg/dL were included, ensuring reliable RC estimation across the entire cohort. The RC levels were then categorized into quartiles (Q1–Q4) for primary analysis, with Q1 (lowest quartile) serving as a reference group.
Definitions of primary outcomes and covariates
The primary outcome of this study was the incidence of CRC, which was identified using the International Classification of Diseases, 10th Revision (ICD-10) diagnostic codes C18, C19, and C20 recorded in the NHIS claims database during the follow-up period. Information on the underlying comorbidities, including hypertension, diabetes mellitus, and dyslipidemia, was obtained using ICD-10 codes and prescription records. Charlson Comorbidity Index (CCI) scores were calculated to quantify the comorbidity burden [18]. Additional covariates included age, sex, household income level (classified into four quartiles), and residential region (urban or rural). Anthropometric data such as body mass index (BMI) were calculated as weight in kilograms divided by the square of height in meters (kg/m2). Laboratory values, including hemoglobin levels and estimated glomerular filtration rate (eGFR), were obtained from the health screening results. Data on lifestyle factors, including alcohol consumption, current smoking status, and regular physical activity, were collected using self-reported questionnaires at baseline.
Statistics and data analysis
Variables are presented as means with standard deviations for continuous variables or as frequencies with percentages for categorical variables. Differences in baseline characteristics across the RC quartiles were assessed using one-way ANOVA or the chi-square test, as appropriate. CRC was calculated per 1,000 person-years. Cox proportional hazard regression models were used to estimate hazard ratios (HRs) and 95% confidence intervals (CIs) for the association between RC quartiles and CRC risk, with the lowest quartile (Q1) serving as the reference group. Crude HRs were initially calculated, followed by multivariate adjustments for potential confounders including age, sex, income level, residential area, hypertension, diabetes mellitus, CCI, BMI, hemoglobin, eGFR, smoking status, alcohol consumption, and regular exercise status. The proportional hazards assumption was tested using Schoenfeld residuals and log(−log) survival plots based on Kaplan–Meier estimates and no violations were observed. Additionally, restricted cubic spline models were applied to examine potential nonlinear associations between continuous RC levels and CRC risk, with graphically illustrated HRs and 95% CIs.
All statistical analyses were performed using SAS (version 9.4; SAS Institute Inc., Cary, NC, USA) and R software (version 4.2.0; R Foundation for Statistical Computing, Vienna, Austria). Statistical significance was set at p < 0.05.
RESULTS
Characteristics according to RC quartiles
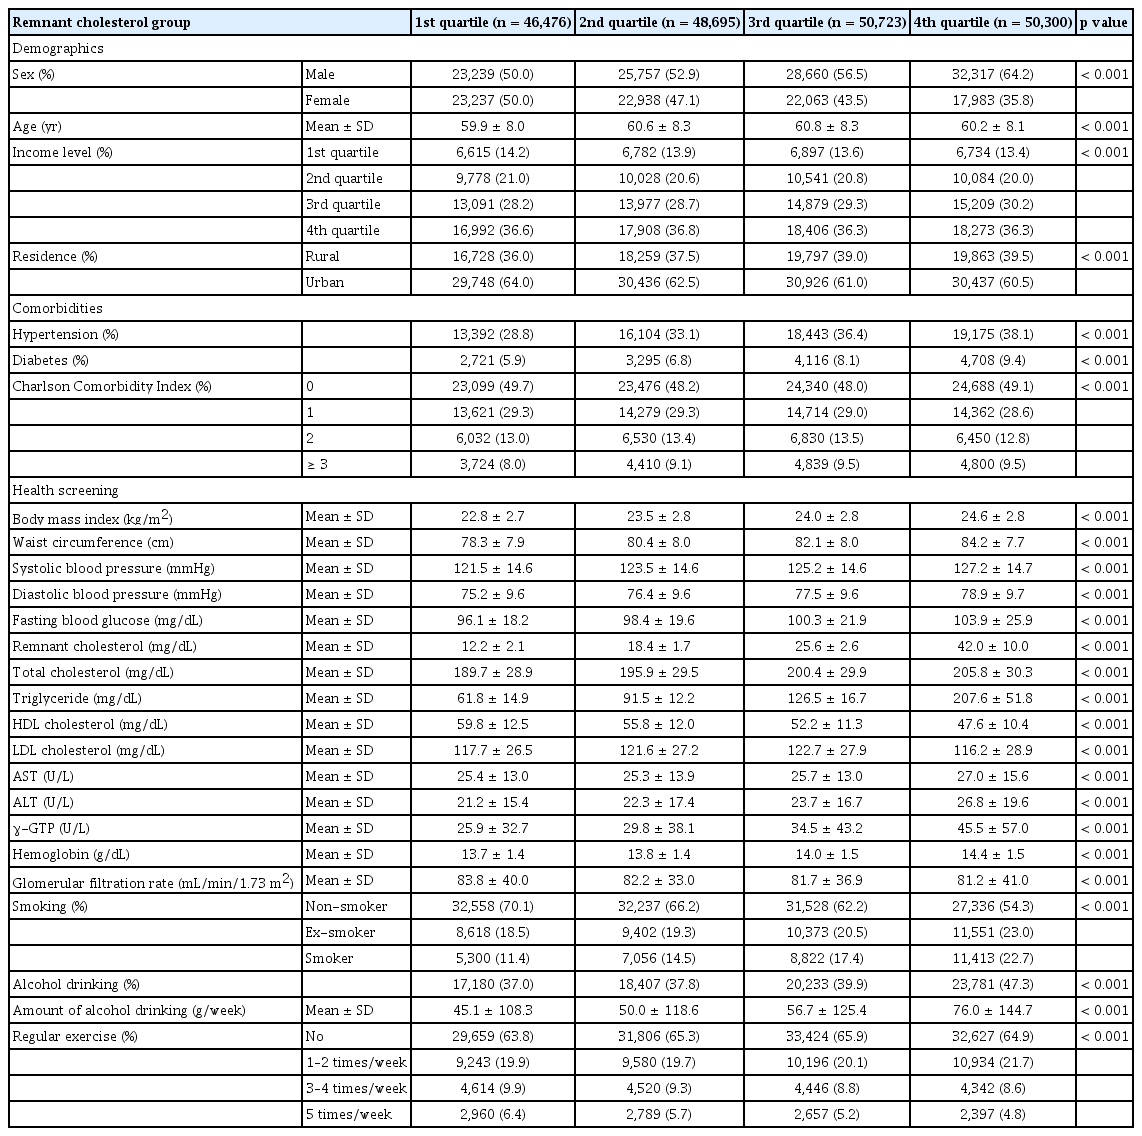
The baseline characteristics of the study population according to RC quartiles are shown in Table 1. The mean RC levels across quartiles were 12.2 ± 2.1 mg/dL in Q1, 18.4 ± 1.7 mg/dL in Q2, 25.6 ± 2.6 mg/dL in Q3, and 42.0 ± 10.0 mg/dL in Q4 (p < 0.001). Participants in higher RC quartiles were more likely to be male (50.0% in Q1 vs. 64.2% in Q4, p < 0.001) and differed slightly in age (mean age 59.9 ± 8.0 yr in Q1 vs. 60.2 ± 8.1 yr in Q4, p < 0.001). The proportion in the highest income quartile was similar across the groups (36.6% in Q1 and 36.3% in Q4, p = 0.210), whereas that in the lowest income group decreased marginally from 14.2% to 13.4% (p = 0.045).
Baseline characteristics of study population
Rural residences increased from 36.0% in Q1 to 39.5% in Q4 (p < 0.001). The prevalence of hypertension increased progressively from 28.8% in Q1 to 38.1% in Q4 (p < 0.001) and the prevalence of diabetes increased from 5.9% to 9.4% (p < 0.001). BMI increased across RC quartiles from 22.8 ± 2.7 kg/m2 to 24.6 ± 2.8 kg/m2 (p < 0.001), along with waist circumference from 78.3 ± 7.9 cm to 84.2 ± 7.7 cm (p < 0.001). Systolic blood pressure increased from 121.5 ± 14.6 mmHg to 127.2 ± 14.7 mmHg (p < 0.001), and diastolic blood pressure from 75.2 ± 9.6 mmHg to 78.9 ± 9.7 mmHg (p < 0.001). Fasting glucose increased across quartiles from 96.1 ± 18.2 mg/dL to 103.9 ± 25.9 mg/dL (p < 0.001). TC rose from 189.7 ± 28.9 mg/dL to 205.8 ± 30.3 mg/dL (p < 0.001), and TGs markedly increased from 61.8 ± 14.9 mg/dL to 207.6 ± 51.8 mg/dL (p < 0.001). HDL cholesterol decreased across quartiles from 59.8 ± 12.5 mg/dL to 47.6 ± 10.4 mg/dL (p < 0.001), whereas LDL cholesterol remained relatively stable (117.7 ± 26.5 mg/dL in Q1 vs. 116.2 ± 28.9 mg/dL in Q4, p < 0.001). Liver enzyme levels, including aspartate aminotransferase (25.4 ± 13.0 to 27.0 ± 15.6 U/L, p < 0.001), alanine aminotransferase (21.2 ± 15.4 to 26.8 ± 19.6 U/L, p < 0.001), and gamma glutamyl transferase (25.9 ± 32.7 to 45.5 ± 57.0 U/L, p < 0.001), increased across RC quartiles. Hemoglobin rose from 13.7 ± 1.4 g/dL to 14.4 ± 1.5 g/dL (p < 0.001), whereas eGFR decreased slightly from 83.8 ± 40.0 mL/min/1.73 m2 to 81.2 ± 41.0 mL/min/1.73 m2 (p < 0.001). Regarding lifestyle factors, the proportion of current smokers increased from 11.4% in Q1 to 22.7% in Q4 (p < 0.001), whereas that of nonsmokers decreased from 70.1% to 54.3% (p < 0.001). Alcohol consumption prevalence increased from 37.0% in Q1 to 47.3% in Q4 (p < 0.001), with the mean amount rising from 45.1 ± 108.3 g/week to 76.0 ± 144.7 g/week (p < 0.001). Regular physical activity (≥ 5 times/week) decreased slightly from 6.4% in Q1 to 4.8% in Q4 (p < 0.001).
All baseline characteristics showed statistically significant differences across the RC quartiles, except in the highest-income group.
Characteristics according to other lipid quartiles
LDL cholesterol quartiles showed broadly similar patterns to RC for several characteristics, such as higher BMI (23.4 ± 2.9 kg/m2 in Q4, p = 0.038) and higher TG levels (138.7 ± 79.5 mg/dL in Q4, p < 0.001), but the magnitude of these associations was smaller. The prevalences of hypertension and diabetes in Q4 were 28.1% (p = 0.021) and 4.5% (p = 0.045), respectively, which were lower than those in the highest RC quartile. HDL cholesterol declined slightly across LDL quartiles (48.2 ± 11.1 mg/dL in Q4, p = 0.020). In contrast, higher HDL cholesterol quartiles were associated with lower BMI (22.4 ± 2.7 kg/m2 in Q4, p < 0.001), lower waist circumference, lower TG levels (82.5 ± 39.4 mg/dL in Q4, p < 0.001), and reduced prevalence of hypertension (20.2% in Q4, p < 0.001) and diabetes (3.1% in Q4, p < 0.001), showing an opposite trend to RC. TC quartiles demonstrated patterns similar to those of RC, with higher BMI (23.7 ± 3.0 kg/m2 in Q4, p < 0.001), higher TG levels (138.7 ± 79.5 mg/dL, p < 0.001), and moderately higher hypertension prevalence (32.4%, p = 0.018), although these associations were weaker than those for RC. The TG quartiles showed very similar patterns to the RC quartiles. Higher TG quartiles were associated with higher BMI (24.6 ± 2.7 kg/m2 in Q4, p < 0.001), higher waist circumference (84.3 ± 7.7 cm in Q4, p < 0.001), higher blood pressure (127.3 ± 14.6 mmHg systolic in Q4, p < 0.001), higher fasting glucose (104.1 ± 26.0 mg/dL in Q4, p < 0.001), and a higher prevalence of hypertension (38.2% in Q4, p < 0.001) and diabetes (9.4% in Q4, p < 0.001). HDL cholesterol decreased progressively (47.5 ± 10.4 mg/dL in Q4, p < 0.001). Smoking and alcohol consumption were also more frequent in the higher TG quartiles (p < 0.001), mirroring the patterns observed for RC.
Association of lipid parameters with CRC risk
The associations between lipid parameters and CRC incidence are presented in Table 2. In the RC quartiles, the incidence rate per 1,000 person-years increased from 1.75 in Q1 to 2.25 in Q4. The adjusted HR for CRC was significantly higher in the Q4 quartile (HR 1.21; 95% CI, 1.08–1.35; p = 0.001) when compared with Q1. Q2 and Q3 showed adjusted HRs of 1.08 (95% CI, 0.96–1.21; p = 0.194) and 1.13 (95% CI, 1.01–1.26; p = 0.039), respectively, indicating a dose-response relationship.
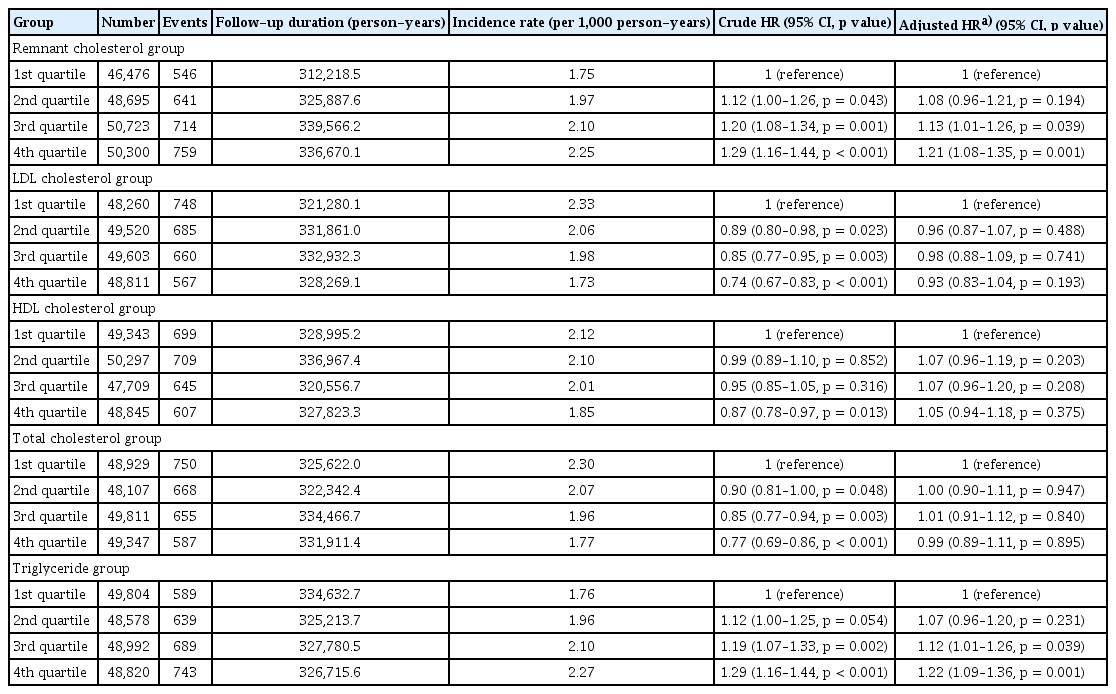
Association between lipid profiles and colorectal cancer
In the TG quartiles, the incidence per 1,000 person-years increased from 1.76 in Q1 to 2.27 in Q4. The adjusted HRs for CRC were 1.07 (95% CI, 0.96–1.20; p = 0.231) in Q2, 1.12 (95% CI, 1.01–1.26; p = 0.039) in Q3, and 1.22 (95% CI, 1.09–1.36; p = 0.001) in Q4, showing a consistent trend of increasing risk across higher TG quartiles. In the LDL cholesterol quartiles, the adjusted HRs did not demonstrate a significant association with CRC risk; Q4 showed an adjusted HR of 0.93 (95% CI, 0.83–1.04; p = 0.193). Similarly, HDL cholesterol quartiles were not significantly associated with CRC incidence. The adjusted HR in Q4 was 1.05 (95% CI, 0.94–1.18; p = 0.375). TC quartiles also demonstrated no significant differences after adjustment, with Q4 showing an adjusted HR of 0.99 (95% CI, 0.89–1.11; p = 0.895).
Kaplan–Meier survival analysis (Fig. 2) was performed to compare the cumulative incidence of CRC across the lipid parameter quartiles. The cumulative incidence curves for RC separated early and continued to diverge over time, with the highest quartile showing a significantly greater cumulative incidence than the lowest quartile (log-rank, p < 0.001).
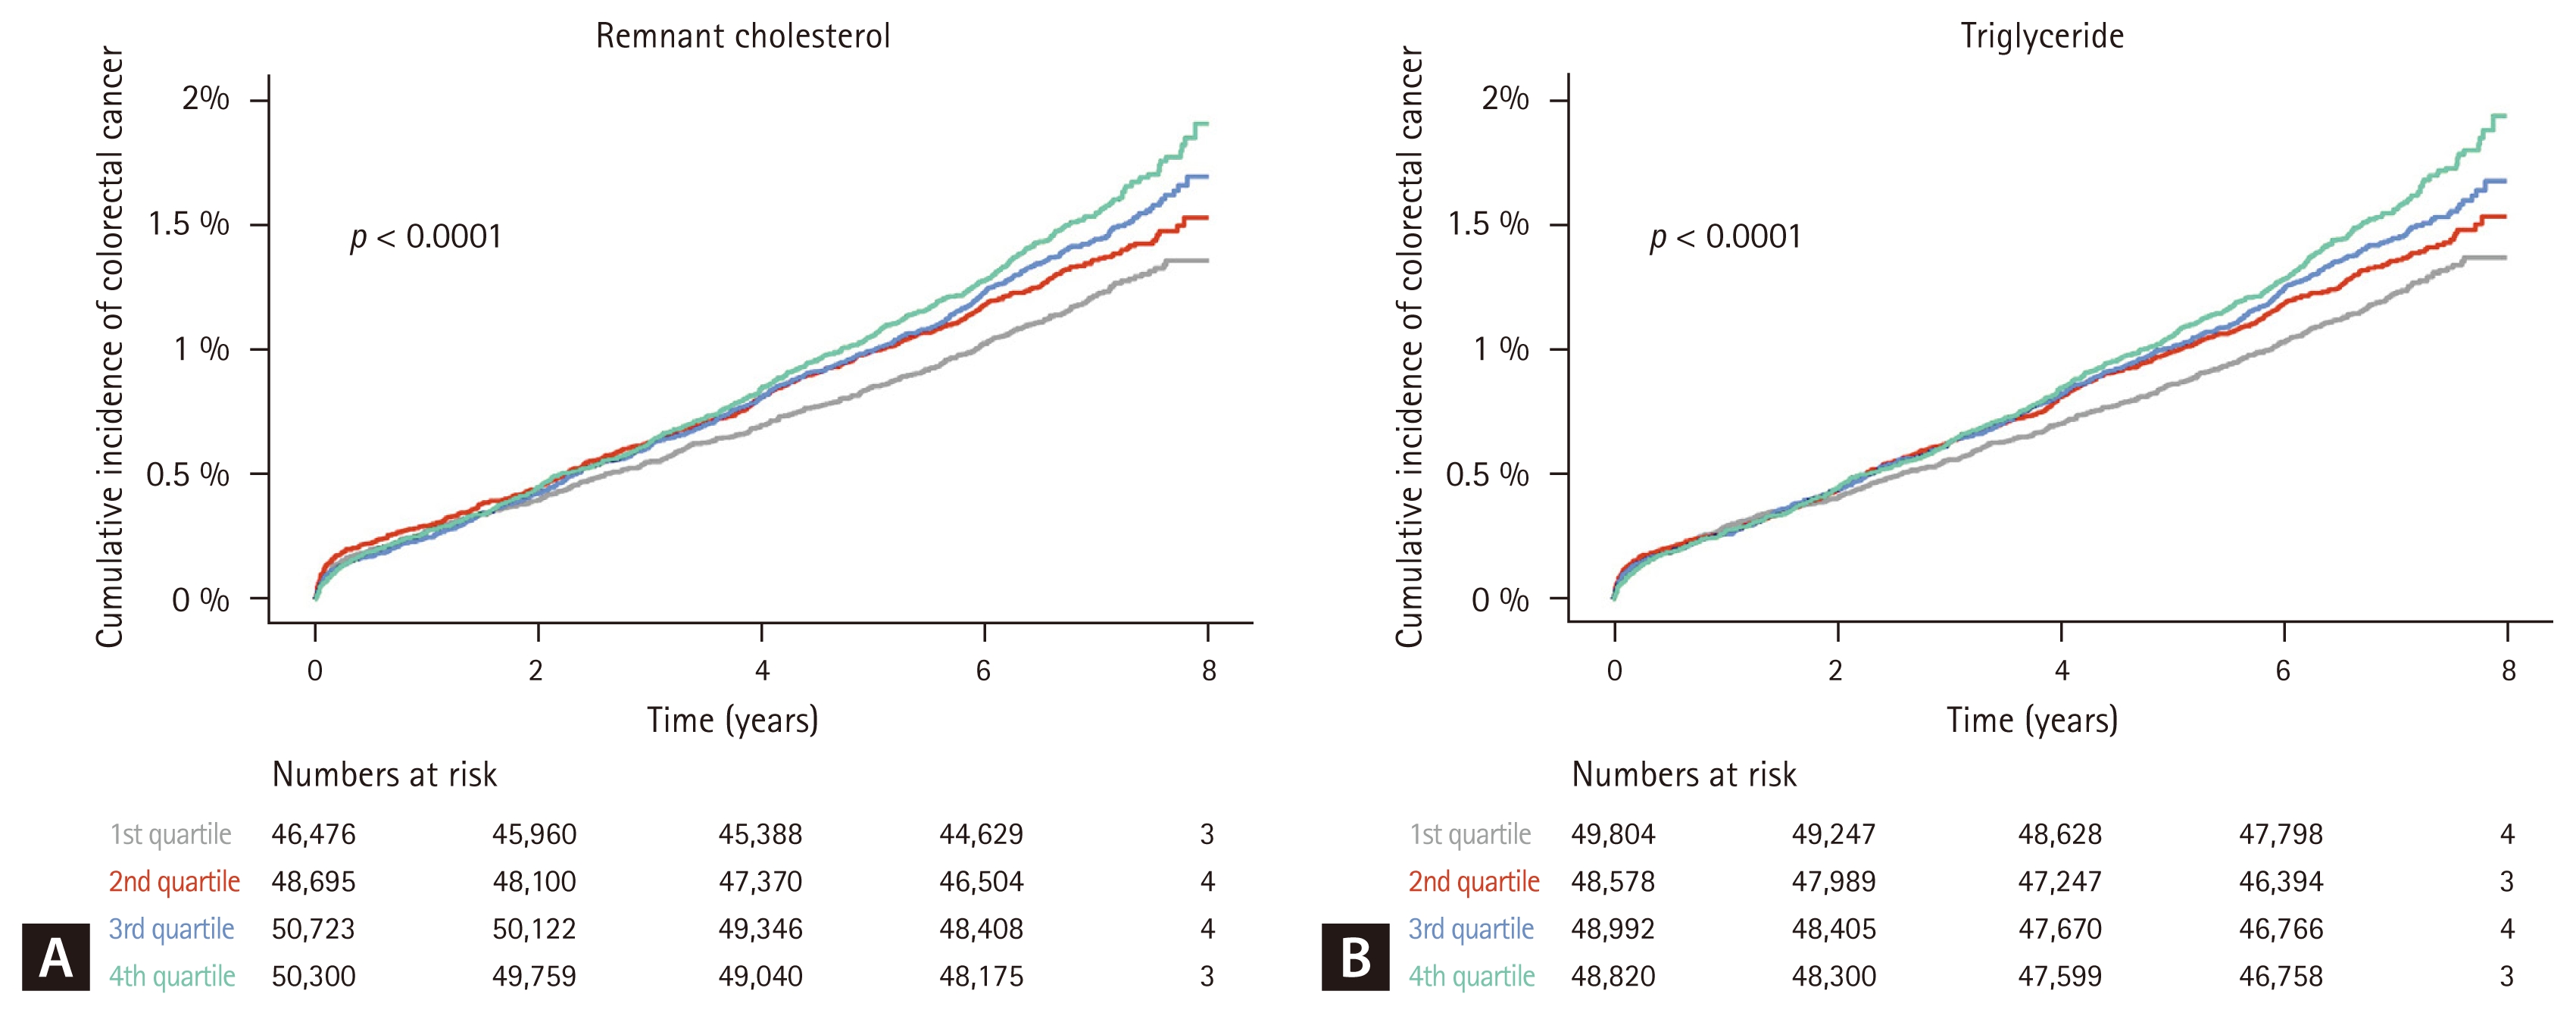
Kaplan–Meier curve for the association between remnant cholesterol, triglyceride, and colorectal cancer.
Similarly, the TG quartiles demonstrated a significant separation of the cumulative incidence curves, with the highest quartile showing a higher cumulative risk of CRC (log-rank p < 0.001). In contrast, the Kaplan–Meier curves for the LDL cholesterol, HDL cholesterol, and TC quartiles showed minimal separation and no statistically significant differences in cumulative incidence (all log-rank p > 0.05).
Subgroup analysis
Subgroup analyses stratified by age, sex, and BMI are presented in Figure 3. In Q4, the HR for CRC was higher in participants aged ≥ 65 years (HR 1.31; 95% CI, 1.10–1.55) than in those aged < 65 years (HR 1.14; 95% CI, 0.98–1.33), with a significant interaction by age (p for interaction = 0.025). When stratified by sex, Q4 showed adjusted HRs of 1.19 (95% CI, 1.03–1.37) in males and 1.26 (95% CI, 1.03–1.54) in females; the interaction by sex was not statistically significant (p for interaction = 0.663). Regarding BMI, the HR in Q4 was higher in participants with BMI < 23 kg/m2 (HR 1.41; 95% CI, 1.18–1.68) than in those with BMI ≥ 23 kg/m2 (HR 1.12; 95% CI, 0.96–1.30), and this difference was statistically significant (p for interaction = 0.001). TGs showed similar subgroup patterns, with significant differences between the age and BMI groups in Q4, consistent with the findings for RC.
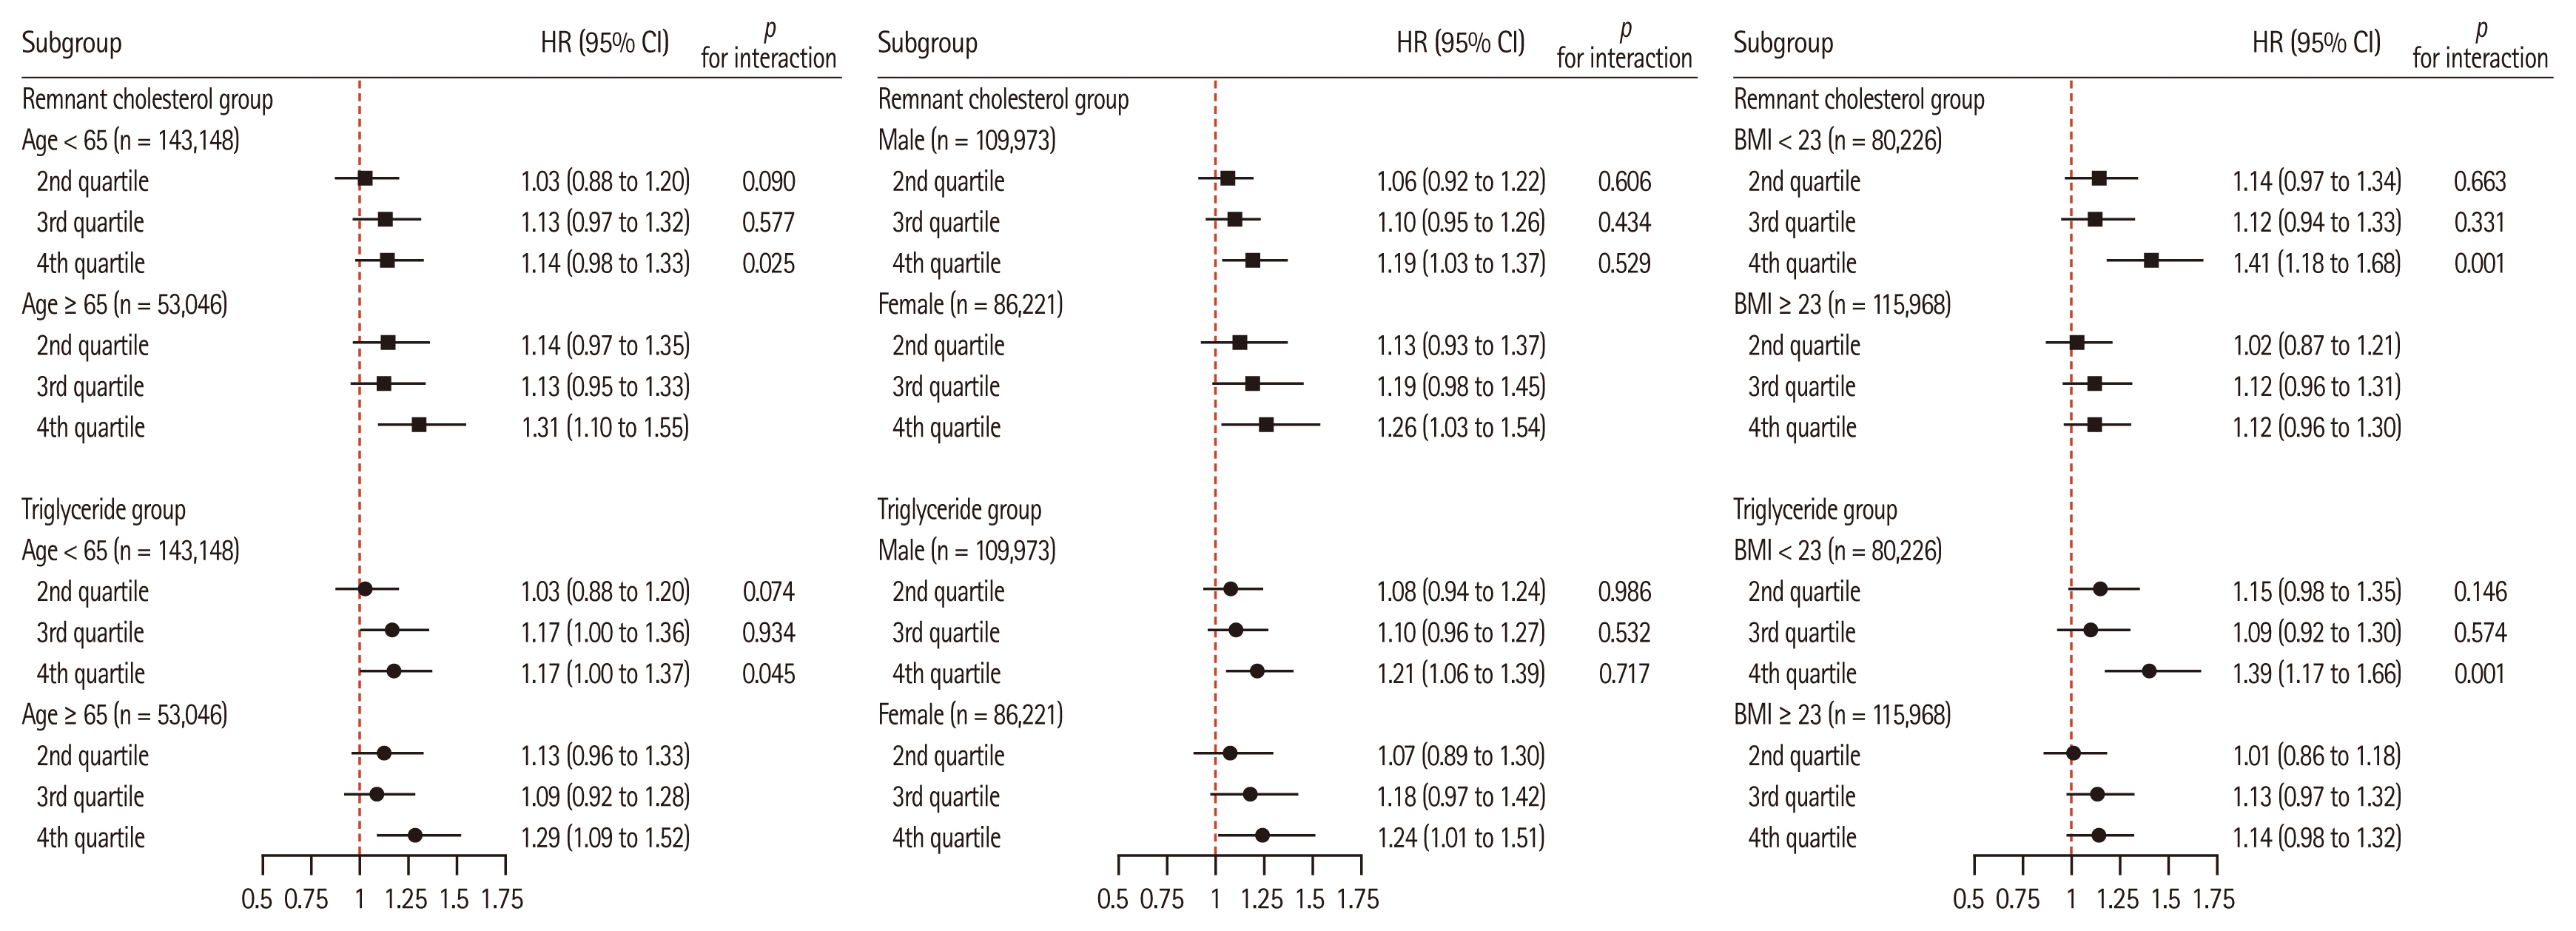
Subgroup analysis according to age, sex, and body mass index (BMI).
DISCUSSION
In this large-scale cohort study based on a nationally representative Korean population, we found that elevated RC levels were independently associated with an increased risk of CRC. This association remained robust even after adjusting for demographic, clinical, and lifestyle factors. Notably, RC demonstrated a positive association with CRC risk, which was comparable in magnitude to that of TG, the only other lipid parameter showing a significant association, whereas LDL-C, HDL-C, and TC levels were not significantly associated. Although RC and TG are metabolically correlated and share certain biological pathways, they represent different compositional elements of lipid metabolism. RC reflects the cholesterol content of atherogenic remnants such as VLDL and IDL, whereas TG reflects the TG content of circulating lipoproteins. These differences suggest that RC may provide complementary information to TG, capturing aspects of lipid metabolism that are not fully reflected in traditional lipid measures [19,20].
Although traditional lipid parameters have been studied in relation to CRC, the variability in their associations suggests that they may not fully capture metabolic nuances relevant to cancer risk [6–11]. RC is increasingly recognized as a metabolically active lipid component that reflects the cholesterol content of TRLs, including VLDL and IDL [21]. These particles play a central role in lipid metabolism and exert pro-inflammatory and pro-atherogenic effects. Therefore, RC, as a surrogate marker for cholesterol carried by these remnants, may capture the residual metabolic risk that is not reflected by traditional lipid measures [22]. In CRC, elevated RC levels have been hypothesized to contribute to tumorigenesis through biologically plausible mechanisms including induction of chronic inflammation, oxidative stress, and insulin resistance [22,23]. These processes are thought to disrupt normal cellular signaling, impair apoptosis, and foster a tumor-permissive microenvironment. Such pathways support the potential relevance of RC in CRC development, beyond its established role in cardiometabolic diseases [5, 24,25].
To date, only a few studies have examined the relationship between RC and cancer. A recent study that combined a cross-sectional analysis with Mendelian randomization reported that higher RC levels were associated with an increased risk of four site-specific cancers, including CRC, suggesting a potential causal link [26]. However, as a cross-sectional study, we could not establish temporal relationships or capture incident cancer outcomes. Recent large-scale prospective data have also demonstrated that individuals in the highest quartile of RC show a significantly elevated risk of incident CRC (HR 1.775; 95% CI, 1.443–2.184), and this association was further amplified in the presence of systemic inflammation, suggesting a synergistic interaction between metabolic and inflammatory pathways [27]. In contrast, another large population-based study reported no consistent associations between RC and overall cancer mortality, although the absence of site-specific mortality data for CRC limited direct comparison [28]. These findings further support the relevance of our study, which specifically evaluated the association between RC and CRC incidence in a large Korean population. In addition, previous large-scale studies did not comprehensively adjust for lifestyle-related covariates. Our study addressed this limitation by utilizing a large, nationally representative Korean cohort with a follow-up period of 7–8 years, allowing for a retrospective assessment of CRC incidence while adequately controlling for relevant demographic, clinical, and behavioral factors.
In subgroup analyses, the association between RC and CRC was more pronounced among individuals with a BMI < 23 kg/m2. Although obesity is a well-established risk factor for CRC, metabolically unhealthy phenotypes can exist even in individuals with normal body weight, often referred to as “metabolically obese normal weight” (MONW) [29]. In such individuals, conventional anthropometric indices may fail to capture the underlying metabolic risks. Therefore, RC may serve as a useful biomarker for identifying at-risk individuals who do not meet the obesity criteria, particularly in Asian populations where metabolic abnormalities frequently occur at lower BMI thresholds. This phenomenon aligns with the concept of MONW, which is particularly prevalent in Asian populations and is associated with increased cardiometabolic and cancer risks [30]. Furthermore, individuals who were prescribed lipid-lowering medications at baseline were excluded to avoid potential confounding effects. Lipid-lowering therapies, particularly statins, have been reported to exert anticarcinogenic effects through mechanisms such as inhibition of tumor cell proliferation, induction of apoptosis, and attenuation of systemic inflammation. Several epidemiological studies and meta-analyses have suggested that statin use may be associated with a reduced risk of CRC [31–35]. Therefore, the inclusion of individuals receiving lipid-lowering therapy could obscure the true relationship between endogenous lipid profiles and CRC risk. By restricting the analysis to individuals who did not receive these medications, we aimed to better capture the independent association between RC and CRC, thereby enhancing the internal validity of our findings.
Despite several strengths, including a large sample size, extended follow-up, and comprehensive adjustment for potential confounders, this study had certain limitations. First, RC was calculated using a single baseline lipid measurement, which precluded the analysis of how longitudinal changes in RC levels may influence CRC risk. Second, owing to the retrospective design, there is a potential for residual confounding and misclassification bias, although efforts have been made to minimize these effects. In addition, information on systemic inflammation markers such as high-sensitivity C-reactive protein was not available in the national health screening database, and therefore potential interactions between RC and systemic inflammation could not be evaluated. Third, the study population consisted exclusively of Koreans, which may limit the generalizability of our findings to other ethnic groups. Finally, detailed information on the anatomical location of CRC was unavailable because ICD-10 subcodes (e.g., C18.0–C18.9) were not consistently entered in the insurance claims database. Therefore, we could not reliably distinguish between specific colonic subsites, although an additional analysis dividing colon (C18–C19) and rectal (C20) cancer showed similar trends (Supplementary Table 1, 2).
Despite these limitations, this study provides meaningful epidemiological insights. To our knowledge, this is the first large-scale population-based cohort study to evaluate the association between RC and incident CRC, using nationally representative data. By comparing RC with traditional lipid parameters and adjusting for a wide range of potential confounders, our findings suggest that RC may serve as a distinct and clinically relevant biomarker for CRC risk stratification.
In conclusion, elevated RC levels were independently associated with an increased risk of CRC. RC may serve as a clinically meaningful biomarker for CRC risk assessment, especially in individuals with lower BMI.
KEY MESSAGE
1. Using a nationwide Korean cohort, we evaluated the association between RC and CRC risk.
2. Higher RC levels were independently associated with increased CRC incidence after adjusting for metabolic and lifestyle factors.
3. RC may serve as a clinically meaningful lipid marker for CRC risk stratification in internal medicine practice.
Notes
CRedit authorship contributions
Minkook Son: methodology, investigation, data curation, formal analysis, writing - review & editing; Jong Yoon Lee: conceptualization, methodology, investigation, data curation, formal analysis, writing - original draft, writing - review & editing, visualization, project administration; Chi Hyeon Choi: writing - review & editing; Yeo Wool Kang: writing - review & editing; Sang Yi Moon: writing - review & editing; Myeongseok Koh: writing - review & editing
Conflicts of interest
The authors declare no conflicts.
Funding
None
Data availability statement
The data cannot be shared with researchers as they have not been approved for access by the Korean National Health Insurance Service. Further inquiries can be directed to the corresponding authors.