Trabecular bone score differs among prediabetes phenotypes: the potential mediating role of visceral adiposity
Article information

Abstract
Background/Aims
Prediabetes comprises heterogeneous metabolic phenotypes that may differentially affect bone quality. While type 2 diabetes increases fracture risk despite preserved bone mineral density, phenotype-specific effects on bone quality during prediabetes remain unclear. We compared trabecular bone score (TBS) across prediabetes phenotypes and examined visceral adiposity’s mediating role.
Methods
We analyzed 876 individuals with prediabetes (451 men, 425 postmenopausal women) from the Cardiovascular and Metabolic Diseases Etiology Research Center cohort. Participants underwent oral glucose tolerance testing for phenotype classification (impaired fasting glucose [IFG], impaired glucose tolerance [IGT], combined IFG+IGT) and dual-energy X-ray absorptiometry for TBS and body composition. Bootstrap mediation analysis (5,000 iterations) tested whether visceral adipose tissue (VAT) accounted for phenotype–TBS associations.
Results
Prediabetes phenotypes showed distinct, sex-specific patterns of bone quality impairment linked to visceral fat. In men, IGT had the lowest TBS (1.46 ± 0.09) compared with IFG (1.49 ± 0.08) and IFG+IGT (1.48 ± 0.07, both p < 0.05). In women, IFG+IGT had the lowest TBS (1.42 ± 0.08) versus IFG (1.44 ± 0.07, p < 0.05). VAT paralleled these TBS patterns and mediated 51% (95% CI 28–74%) of the IGT effect in men and 26% (95% CI 8–45%) of the IFG+IGT effect in women.
Conclusions
Prediabetes phenotypes are associated with distinct TBS patterns—IGT in men and IFG+IGT in women showing the lowest values. Visceral adiposity mediated approximately half of the association in men with IGT, suggesting sex- and phenotype-specific pathways linking prediabetes to bone microarchitecture.

INTRODUCTION
Type 2 diabetes mellitus (T2DM) is associated with a 30–40% increased risk of fractures, despite normal or elevated bone mineral density (BMD), indicating that impaired bone quality, rather than quantity, is the primary mechanism [1,2]. The trabecular bone score (TBS), derived from lumbar spine dual-energy X-ray absorptiometry (DXA) images, provides a validated measure of bone microarchitecture that is independent of BMD and predicts fracture risk in individuals with diabetes [3,4]. Although prediabetes affects approximately 500 million individuals worldwide [5] and represents a critical window for intervention, few studies have examined whether bone quality deterioration begins during this potentially reversible phase. The limited available evidence suggests that skeletal changes may precede diabetes diagnosis [6], but a comprehensive investigation of bone microarchitecture across different prediabetes phenotypes has not been conducted.
Prediabetes comprises three distinct phenotypes with different pathophysiology. Impaired fasting glucose (IFG) reflects hepatic insulin resistance, accompanied by preserved peripheral insulin sensitivity, whereas impaired glucose tolerance (IGT) indicates peripheral insulin resistance, along with an impaired postprandial insulin response [7,8]. Combined IFG+IGT represents advanced dysfunction affecting both hepatic and peripheral glucose metabolism [9]. These distinct metabolic profiles suggest that each phenotype may affect bone health through different mechanisms involving varying patterns of hyperglycemia, insulin resistance, visceral adiposity, and inflammatory activation.
Previous studies examining bone health in prediabetes have significant limitations. Most grouped all prediabetes subtypes or examined single phenotypes in isolation, potentially masking important phenotype-specific effects. Furthermore, these studies have rarely investigated the underlying metabolic factors that mediate bone quality changes, leaving the mechanisms largely unexplored [6, 10]. The specific metabolic drivers of bone impairment in prediabetes—whether insulin resistance, adiposity, or glucose excursions—remain poorly characterized. While metabolic factors, such as visceral adiposity, have been implicated in diabetes-related bone disease through inflammatory and metabolic pathways [11,12], their role in mediating phenotype-specific bone effects remains unquantified.
Understanding phenotype-specific effects on bone quality is clinically important. If specific phenotypes confer a higher risk, targeted screening could identify individuals who require enhanced monitoring. Furthermore, identifying modifiable mediators could inform intervention strategies. This study aimed to: (1) compare TBS among the three distinct prediabetes phenotypes to identify phenotypes associated with lower bone quality, (2) systematically examine metabolic parameters to identify factors most strongly associated with bone quality differences, and (3) explore whether visceral adiposity accounts for phenotype-TBS associations through cross-sectional mediation analysis.
METHODS
Study population
Participants were recruited from the Cardiovascular and Metabolic Diseases Etiology Research Center (CMERC), a multicenter prospective cohort study in Korea, as previously described [13]. Briefly, individuals aged 30–64 years residing in Suwon, Yongin, or Hwaseong for at least 8 months annually underwent baseline examinations between December 2013 and March 2018.
From 2,888 participants aged ≥ 40 years who completed both 75-g oral glucose tolerance test (OGTT) and DXA, we excluded those with normal glucose tolerance (n = 1,352), diabetes (fasting glucose ≥ 126 mg/dL, 2-hour glucose ≥ 200 mg/dL, or glycated hemoglobin [HbA1c] ≥ 6.5%; n = 426), liver cirrhosis, chronic kidney disease, or use of medications affecting bone metabolism (osteoporosis drugs, glucocorticoids, thyroid hormones, hormone replacement therapy). The final analysis included 876 participants with prediabetes (451 men, 425 postmenopausal women).
The study was approved by Ajou University Institutional Review Board (AJIRB-BMR-SUR-13-272) and conducted according to the Declaration of Helsinki. All participants provided written informed consent.
Clinical and biochemical measurements
Height and weight were measured using an automated scale (BSM330; InBody, Seoul, Korea). After an 8-hour fast, blood samples were collected, followed by a 75-g OGTT with sampling at 0, 30, 60, and 120 minutes. Samples were analyzed within 24 hours at a central laboratory (Seoul Clinical Laboratories, Seoul, Korea).
Glucose was measured by colorimetric method, insulin by radioimmunoassay (SR 300; STRATEC, Birkenfeld, Germany), and HbA1c by high-performance liquid chromatography (Variant II Turbo; Bio-Rad, Hercules, CA, USA). Total cholesterol, HDL-cholesterol, and triglycerides were measured enzymatically (ADVIA 1800; Siemens, Malvern, PA, USA). 25-hydroxyvitamin D was measured by chemiluminescence immunoassay (Liaison; DiaSorin, Stillwater, MN, USA).
Definition of prediabetes phenotypes
Following American Diabetes Association criteria [14], we classified participants as: IFG, fasting glucose 100–125 mg/dL and 2-hour glucose < 140 mg/dL; IGT, fasting glucose < 100 mg/dL and 2-hour glucose 140–199 mg/dL; IFG+IGT, both criteria met.
Insulin resistance and secretion indices
Insulin resistance was assessed using homeostatic model assessment (HOMA-IR) = fasting glucose (mg/dL) × fasting insulin (μU/mL) / 405 [15] and Matsuda Index = 10,000 / √[(fasting glucose × fasting insulin) × (mean glucose × mean insulin during OGTT)] [16]. Beta-cell function was evaluated using the insulinogenic index (IGI30) = (insulin30 - insulin0) / (glucose30 - glucose0) [17].
Bone quality and body composition assessment
BMD and TBS were measured using DXA (Lunar iDXA; GE Healthcare, Madison, WI, USA) with TBS iNsight software version 3.0.2.0 (Med-Imaps, Geneva, Switzerland). TBS was calculated from L1-L4 lumbar spine images using proprietary algorithms evaluating pixel gray-level variations. Lower TBS indicates degraded bone microarchitecture.
Visceral and subcutaneous adipose tissue in the android region were quantified using validated DXA algorithms analyzing subcutaneous fat layer width and anterior-posterior abdominal thickness [18]. All measurements were performed by trained technicians following standardized protocols, with a coefficient of variation of < 2% for TBS and < 3% for body composition.
Statistical analysis
Data are presented as mean ± standard deviation or percentages. Variables with skewed distributions (insulin, HOMA-IR, IGI30, triglycerides, vitamin D) were log-transformed. A one-way ANOVA with Bonferroni’s post-hoc test was used to compare TBS across phenotypes. Effect sizes were calculated using Cohen’s d.
Linear associations between TBS and metabolic parameters were quantified using Pearson correlation coefficients. Although the scatter plots display smoothed curves from generalized additive models to illustrate the overall relationship patterns, the reported correlation coefficients (r values) represent linear associations only, providing standardized measures of association strength for comparison across parameters.
Analysis of covariance (ANCOVA) examined TBS differences across prediabetes phenotypes (IFG as reference, IGT, and IFG+IGT) with sequential covariate adjustment to identify potential factors associated with the phenotype-TBS relationship. Model 1 adjusted for demographic and metabolic confounders (age, weight, vitamin D, HbA1c, smoking status, alcohol consumption, and subcutaneous fat mass). Model 2 additionally included visceral adipose tissue (VAT) mass to evaluate whether visceral adiposity statistically accounts for the phenotype-TBS associations.
Bootstrap mediation analysis with 5,000 iterations was performed using the mediation package in R with default settings [19]. VAT mass served as a potential mediator between phenotype (exposure) and TBS (outcome), adjusting for age, weight, vitamin D, HbA1c, and lifestyle factors. The proportion mediated was calculated as the indirect effect divided by the total effect, expressed as a percentage of the total effect.
All statistical analyses were performed using R version 4.4.0 (R Foundation, Vienna, Austria). p values < 0.05 were considered statistically significant.
RESULTS
Participant characteristics
The distribution of prediabetes phenotypes was as follows: men—296 individuals with IFG (65.6%), 52 with IGT (11.5%), and 103 with IFG+IGT (22.8%); women—218 with IFG (51.3%), 96 with IGT (22.6%), and 111 with IFG+IGT (26.1%). Age and BMI were similar across phenotypes (Table 1, 2).

Baseline characteristics of men depending on their prediabetic phenotype

Baseline characteristics of postmenopausal women depending on their prediabetic phenotype
VAT mass showed a distinct pattern across phenotypes. In men, VAT was lowest in IFG (1.28 ± 0.57 kg), highest in IGT (1.54 ± 0.60 kg), and intermediate in IFG+IGT (1.46 ± 0.52 kg, p < 0.001). Women showed progressive increases from IFG (0.77 ± 0.36 kg) through IGT (0.85 ± 0.42 kg) to IFG+IGT (0.92 ± 0.40 kg, p < 0.001).
The IFG+IGT group had the highest HbA1c (men: 5.92 ± 0.45%, women: 5.95 ± 0.35%) and HOMA-IR (men: 2.96 ± 1.25, women: 2.88 ± 1.11). Paradoxically, IGT showed lower HOMA-IR than IFG in both sexes, reflecting its postprandial rather than fasting metabolic dysfunction.
Phenotype differences in TBS
Tables 1 and 2 also show TBS differences across prediabetes phenotypes. In men, IGT demonstrated significantly lower TBS (1.46 ± 0.09) compared to IFG (1.49 ± 0.08, p = 0.002) and IFG+IGT (1.48 ± 0.07, p = 0.026). The effect size was moderate (Cohen’s d = 0.41 for IGT vs. IFG). In women, IFG+IGT showed the lowest TBS (1.42 ± 0.08) compared to IFG (1.44 ± 0.07, p = 0.021), with IGT intermediate (1.42 ± 0.07). The effect size for IFG versus IFG+IGT comparison was 0.28, indicating a small to moderate effect.
Notably, the pattern of TBS differences across different prediabetes phenotypes in both men and women paralleled the corresponding changes in VAT mass. This parallel pattern suggested that VAT might mediate the relationship between phenotype and TBS, which we tested using sequential adjustment models (Fig. 1).
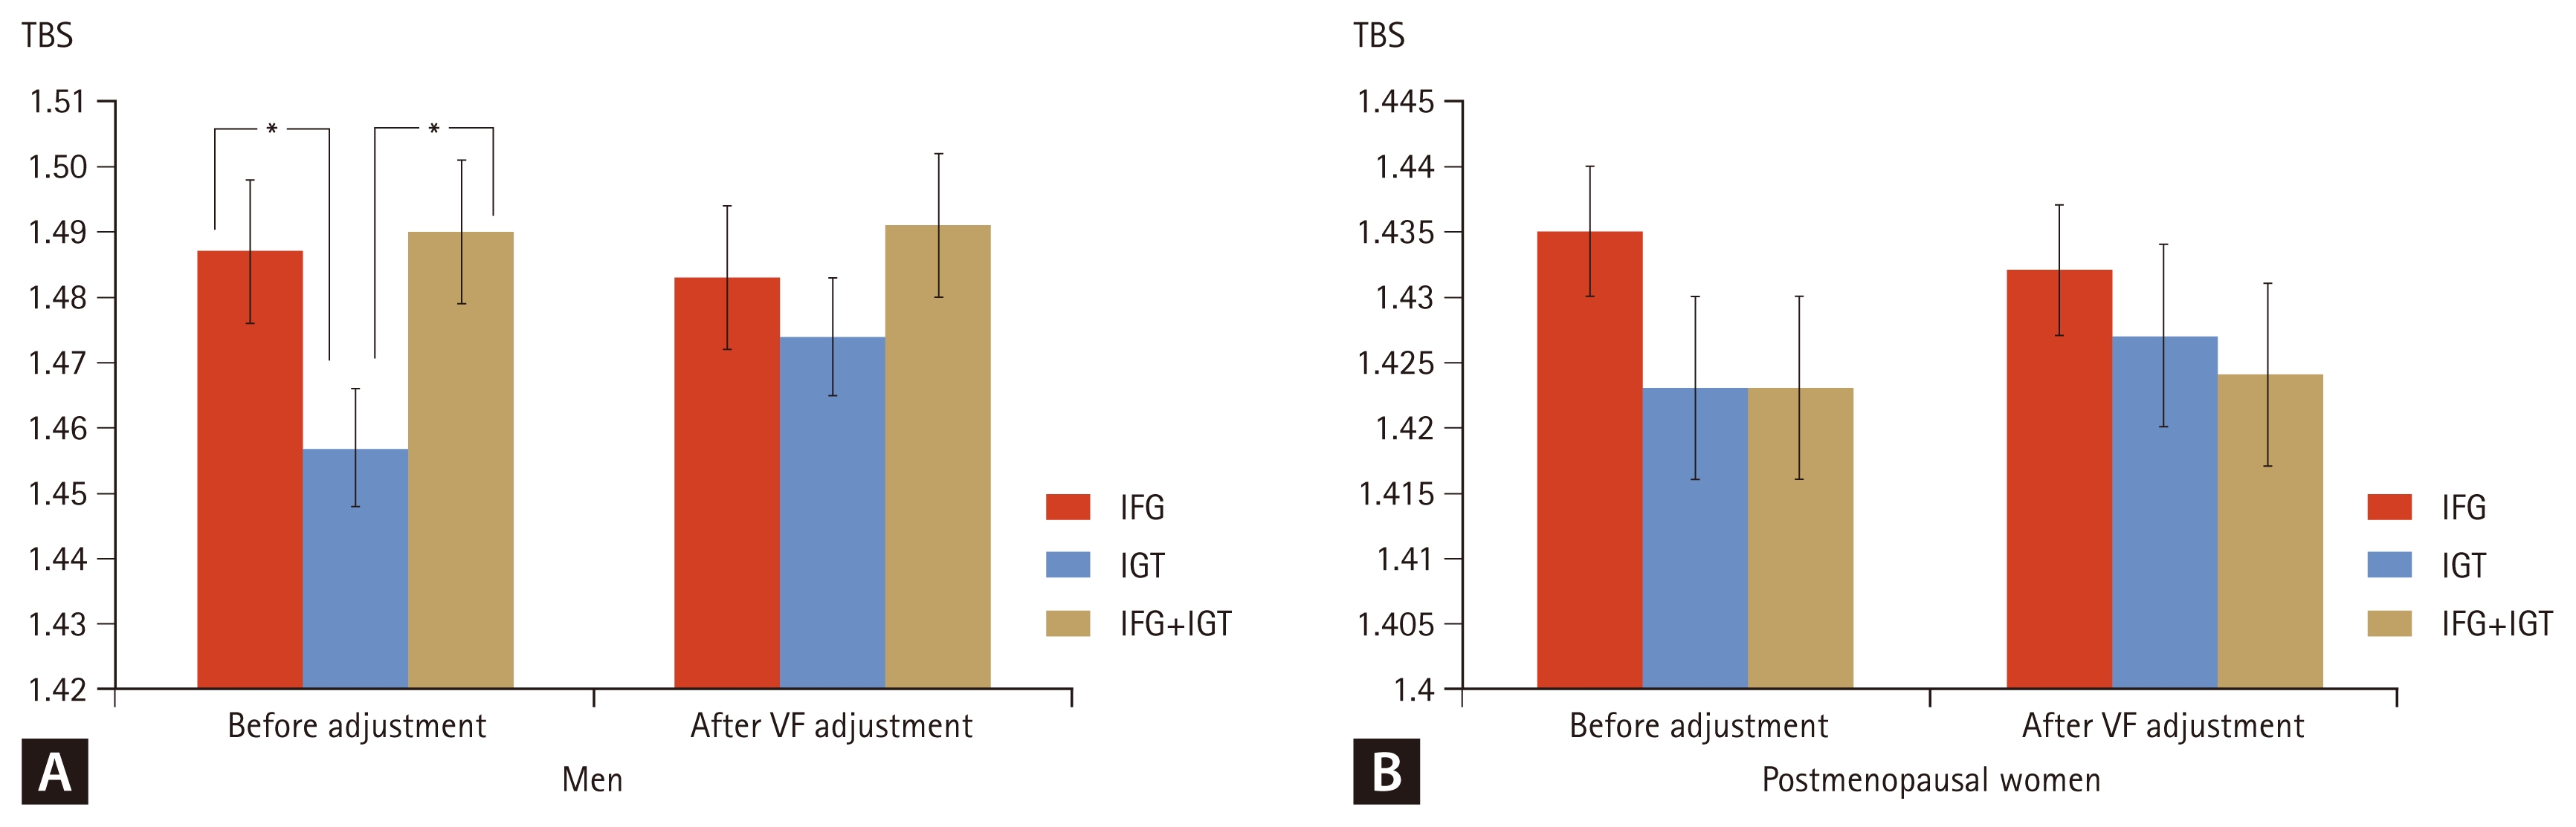
TBS across prediabetes phenotypes before and after adjustment for VF mass. (A) Men. (B) Postmenopausal women. Model 1 (before adjustment) was adjusted for age, weight, vitamin D, HbA1c, smoking status, alcohol consumption, and subcutaneous fat mass. Model 2 (after VF adjustment) additionally included VF mass. Error bars represent 95% confidence intervals. TBS, trabecular bone score; VF, visceral fat; IFG, impaired fasting glucose; IGT, impaired glucose tolerance. *p < 0.05 versus IFG by Bonferroni post-hoc test.
After adjusting for age, weight, vitamin D, HbA1c, smoking, alcohol, and subcutaneous fat (Model 1, Before adjustment for VAT mass), phenotype differences remained significant in men (p = 0.018) but attenuated in women (p = 0.089). However, adjustment for VAT mass (Model 2. After adjustment for VAT mass) substantially attenuated phenotype differences in both sexes (men: p = 0.124; women: p = 0.287).
Visceral adiposity associations and mediation analysis
Correlation analysis revealed differential associations between TBS and metabolic parameters (Fig. 2). VAT mass showed the most substantial negative linear correlation with TBS among all metabolic factors examined (men: r = −0.350, p < 0.001; women: r = −0.205, p < 0.001). In contrast, traditional insulin resistance markers showed much weaker associations. HOMA-IR demonstrated only a weak negative correlation with TBS in men (r = −0.119, p = 0.012) and no significant association in women (r = −0.043, p = 0.375). The Matsuda Index showed a modest positive correlation in men (r = 0.160, p < 0.001) but no significant association in women (r = 0.043, p = 0.383). Beta-cell function assessed by IGI30 showed virtually no correlation in men (r = 0.000, p = 0.994) and only a borderline positive correlation in women (r = 0.095, p = 0.052).
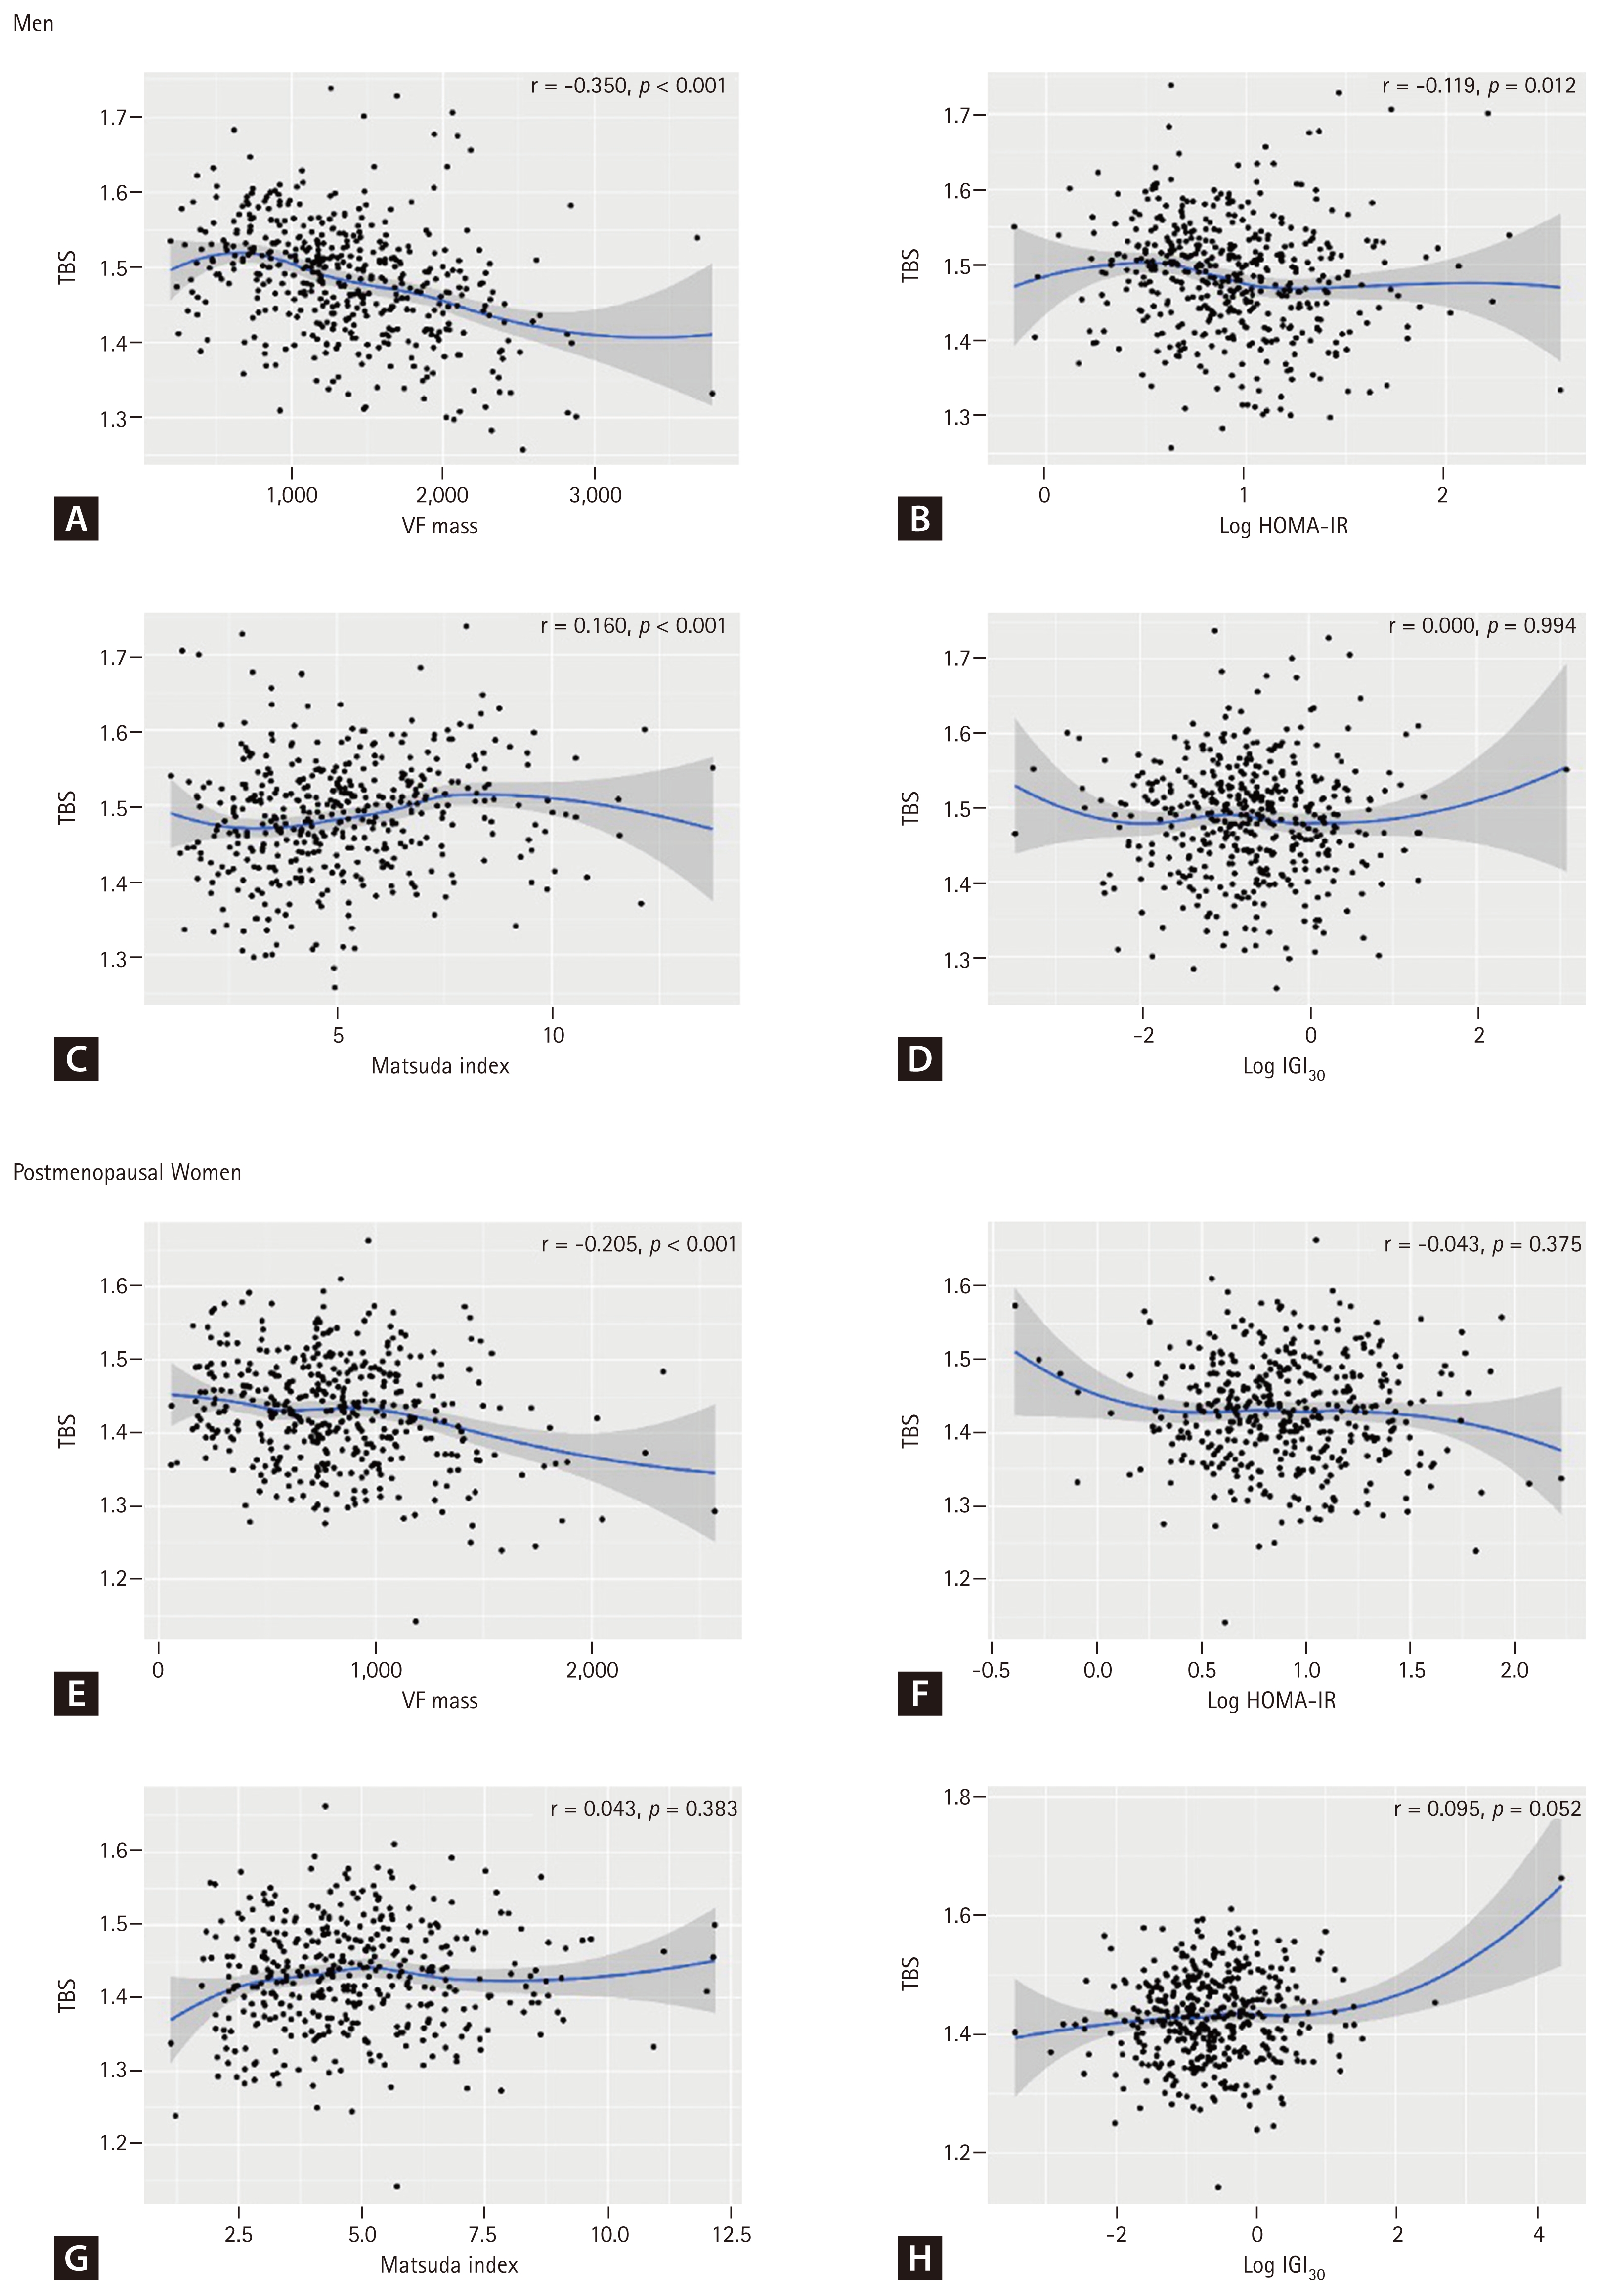
Scatter plots showing associations between TBS and metabolic parameters in men (A–D) and postmenopausal women (E–H). (A, E) VF mass; (B, F) log-transformed HOMA-IR; (C, G) Matsuda Index; (D, H) log-transformed insulinogenic index (IGI30). Blue lines represent smoothed curves from generalized additive models with 95% confidence intervals (shaded areas). Pearson correlation coefficients (r) and p values are displayed. TBS, trabecular bone score; VF, visceral fat; HOMA-IR, homeostasis model assessment estimate of insulin resistance.
In contrast to TBS, VAT showed no consistent negative association with BMD; correlations with lumbar spine and femoral neck BMD were not significant, and total hip BMD showed a positive correlation with VAT (Supplementary Fig. 1), highlighting that visceral adiposity specifically impairs bone microarchitecture rather than BMD.
In multiple regression analysis (Table 3), VAT showed robust negative associations with TBS (men: β = −0.744, women: β = −0.578), which persisted after adjusting for HOMA-IR or the Matsuda Index, indicating effects independent of insulin resistance.
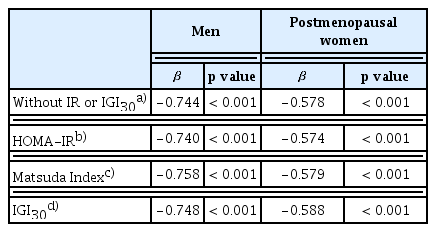
Association between trabecular bone scores and visceral fat after adjustment for confounding factors and insulin resistance or beta-cell function
Bootstrap mediation analysis quantified VAT’s contribution (Table 4). In men, comparing IGT (the lowest TBS group) to the IFG reference, VAT showed substantial mediating effects. The IGT group had a significantly higher VAT mass compared to the IFG group (path a: β = 0.254 kg, p < 0.001), representing approximately a 20% increase in visceral adiposity relative to the IFG group. Each kilogram increase in VAT was associated with a 0.064-unit decrease in TBS (path b, p < 0.001).

Bootstrap mediation analysis of visceral adipose tissue mediating the association between prediabetes phenotypes and TBS
The total effect of IGT on TBS was −0.032 (95% CI: −0.058 to −0.006, p = 0.015), indicating clinically significant impairment in bone quality. Of this total effect, the indirect effect through VAT was −0.016 (95% CI −0.026 to −0.008), while the direct effect was −0.016 (95% CI −0.041 to 0.009, p = 0.221). VAT accounted for 51% of the total effect (95% CI 28–74%), representing robust mediation. This suggests that approximately half of the bone quality impairment in IGT operates through increased visceral adiposity.
The IFG+IGT versus IFG comparison in men showed a different pattern. While VAT also mediated an indirect effect, the direct effect was positive, resulting in a non-significant total effect. This suppression pattern suggests that in IFG+IGT, VAT-mediated negative effects on bone are partially offset by other factors associated with this phenotype.
In women, comparing IFG+IGT (the lowest TBS group) to the IFG reference, VAT played a more modest mediating role. The IFG+IGT group showed marginally higher VAT mass (path a: β = 0.042 kg, p = 0.181), which did not reach statistical significance. However, VAT effects on TBS were stronger in women than men (path b: β = −0.082, p < 0.001), indicating greater bone sensitivity to visceral adiposity.
The total effect of IFG+IGT on TBS was −0.013 (95% CI −0.030 to 0.004, p = 0.138), with an indirect effect through VAT of −0.003 (95% CI −0.009 to 0.002) and a direct effect of −0.010 (95% CI −0.026 to 0.006, p = 0.222). VAT mediated 26% of the total effect (95% CI 8–45%), indicating that three-quarters of the bone quality impairment operates through pathways independent of visceral adiposity.
DISCUSSION
This study is the first to examine whether prediabetes phenotypes are associated with distinct patterns of bone quality impairment, with IGT and combined IFG+IGT showing the most significant reduction in TBS compared to isolated IFG. We found that individuals with IGT-containing phenotypes (IGT alone or IFG+IGT) consistently demonstrated lower TBS values than those with isolated IFG, even after adjusting for traditional risk factors. Importantly, our mediation analysis suggested that VAT may play a role in this relationship, accounting for 51% (95% CI 28–74%) of the phenotype-associated differences in bone quality in men with IGT, where the total effect was significant. This finding challenges the traditional view of prediabetes as a homogeneous condition and identifies VAT as a potential key metabolic factor linking specific prediabetes phenotypes to compromised bone microarchitecture. While previous studies have suggested bone deterioration begins during prediabetes, our results provide the first evidence that the associations between prediabetes and bone quality impairment vary significantly by prediabetes phenotype, with visceral adiposity emerging as a potentially more important factor than traditional insulin resistance markers.
The clinical relevance of the observed TBS differences warrants consideration. The differences between phenotypes (0.02–0.03 units) represent approximately 0.25–0.40 standard deviation (SD) of TBS. Based on meta-analyses showing that each 1 SD decrease in TBS is associated with a 30–40% increase in fracture risk independent of BMD [20], the observed differences may correspond to a 7–16% difference in relative fracture risk. While modest at the individual level, these differences could have meaningful public health implications given the large population affected by prediabetes.
Notably, the phenotypes with the lowest TBS values (IGT in men and IFG+IGT in women) also exhibited the highest VAT mass, suggesting that VAT may be a potential mechanistic link between these phenotypes and bone quality impairment. To test this hypothesis, we examined multiple metabolic parameters. We found that VAT indeed showed the strongest correlation with reduced bone quality among all factors examined (r = −0.350 in men, r = −0.205 in women), surpassing traditional markers of insulin resistance. Formal mediation analysis confirmed that VAT accounts for a substantial 51% (95% CI 28–74%) of the IGT effect in men and 26% (95% CI 8–45%) of the IFG+IGT effect in women. The stronger mediation in men with IGT, where both the total effect and indirect effect were significant, represents the most robust evidence for VAT’s mediating role. In women, however, the mediation findings should be interpreted with caution, as the total effect of IFG+IGT on TBS did not reach statistical significance (p = 0.138), which limits definitive mediation inference.
In contrast to the strong association of visceral adiposity with TBS, traditional markers of insulin resistance showed surprisingly weaker associations with bone quality. HOMA-IR demonstrated only a minimal negative correlation with TBS in men (r = −0.119, p = 0.012) and no significant association in women (r = −0.043, p = 0.375). Similarly, the Matsuda Index showed only a modest positive correlation in men (r = 0.160, p < 0.001) but no significant association in women (r = 0.043, p = 0.383). These findings suggest that visceral adiposity may affect bone quality through mechanisms beyond its contribution to systemic insulin resistance, highlighting the importance of body composition over glycemic markers in bone health assessment during prediabetes.
These VAT-specific effects on bone quality, which appear independent of systemic insulin resistance, may operate through multiple direct mechanisms. VAT secretes inflammatory cytokines (TNF-α, IL-6, resistin) that suppress osteoblast function and enhance osteoclast activity [21,22], while inducing systemic low-grade inflammation that disrupts normal bone remodeling [23]. However, VAT accounts for only about half of the phenotype effect in men and one-quarter in women, indicating that additional pathways likely contribute to bone quality impairment. The IGT phenotype’s pronounced postprandial glucose excursions likely contribute through increased formation of advanced glycation end products (AGEs) in bone collagen, which alter mechanical properties and activate RAGE signaling that impairs bone formation [24,25]. Supporting this mechanism, Yamamoto et al. demonstrated that serum pentosidine, an AGE, was independently associated with reduced TBS and increased fracture risk in T2DM [26].
Additionally, glucose variability characteristic of IGT induces oxidative stress that directly impairs osteoblast survival and function [27]. Meanwhile, the IFG+IGT phenotype may experience cumulative effects from chronic hyperglycemia and altered insulin signaling, which generally promote osteoblast differentiation [28]. Together, these findings suggest that prediabetes affects bone quality through a complex interplay of VAT-mediated inflammation and phenotype-specific metabolic disturbances, underscoring the need for targeted interventions that consider both body composition and glycemic patterns.
The observed sex differences in phenotype-bone quality relationships reflect fundamental differences in glucose metabolism and body composition between men and women. Men typically have greater visceral adiposity relative to total fat, potentially making them more susceptible to VAT-mediated effects in IGT, as suggested by the 51% statistical mediation effect. Women’s greater subcutaneous fat may provide some buffering effect except in the most metabolically compromised IFG+IGT state, where VAT still mediates 26% of the bone quality impairment. These patterns align with sex differences in diabetes complications generally, where men often show earlier macrovascular complications while women experience a greater risk once the disease is established [29].
The robustness of these phenotype- and sex-specific findings is supported by several methodological strengths. We used the gold-standard OGTT for precise phenotype classification, ensuring accurate categorization of participants. TBS provided a validated measure of bone microarchitecture, independent of BMD, allowing for the assessment of bone quality rather than just quantity. The use of DXA-derived VAT measurements offered accurate quantification of visceral adiposity with strong correlations to gold-standard CT imaging [18]. Our bootstrap mediation analysis with 5,000 iterations provided robust statistical quantification of VAT’s mediating role. The large sample size enabled sex-stratified analyses revealing important differences.
Several limitations should be considered when interpreting our results. The cross-sectional design precludes causal inference and cannot determine whether phenotype-specific TBS differences translate to differential fracture risk over time. Furthermore, the temporal ordering required for definitive mediation inference is not established, as VAT and TBS were measured simultaneously; thus, our mediation findings should be interpreted as demonstrating statistical associations consistent with a mediating pathway rather than confirming causality. We could not measure all potential mediators, including bone turnover markers, AGEs, or inflammatory cytokines, which limits our mechanistic understanding of the unexplained variance. Additionally, while DXA-derived VAT measurements correlate strongly with CT imaging [18, 30], measurement error may attenuate mediation estimates, potentially underestimating VAT’s true contribution. The Korean population studied may exhibit different body composition patterns compared to other ethnicities, potentially limiting the generalizability of the findings. Additionally, while TBS provides valuable information about bone microarchitecture, it does not capture all aspects of bone quality that contribute to fracture risk.
Our findings establish several priorities for future research. Longitudinal studies are essential for determining whether phenotype-specific TBS differences predict incident fractures and for establishing the temporal relationship between metabolic changes and deterioration of bone quality. Comprehensive metabolic profiling, including bone turnover markers, AGEs, inflammatory mediators, and adipokines, could identify the mechanisms underlying the unexplained 49% (men) and 74% (women) of phenotype effects. Finally, studies in diverse populations are needed to confirm the generalizability of these phenotype-specific patterns and to develop population-specific risk assessment tools.
In conclusion, prediabetes phenotypes exhibit distinct patterns of bone quality, highlighting the heterogeneous nature of prediabetes and its varied skeletal effects. IGT in men and IFG+IGT in women show the most significant bone quality impairment. Visceral adiposity accounts for approximately half of the phenotype effect in men (51%) and one-quarter in women (26%). The remaining unexplained variance likely involves multiple pathways, including AGE formation, oxidative stress, and direct metabolic effects on bone, which require further investigation. These findings support moving beyond a one-size-fits-all approach to prediabetes management, suggesting phenotype-specific strategies for assessing and preserving bone health. Longitudinal studies are warranted to confirm these cross-sectional findings and determine whether the observed TBS differences translate to differential fracture risk. As prediabetes affects nearly half a billion individuals globally, understanding and addressing phenotype-specific bone health risks could substantially impact public health.
KEY MESSAGE
1. Prediabetes phenotypes (IFG, IGT, IFG+IGT) show distinct bone quality patterns, with IGT showing the poorest TBS in men and IFG+IGT showing the greatest impairment in women.
2. Visceral adiposity accounts for approximately half (51%) of the phenotype-specific effect on bone quality in men and one-quarter (26%) in women, highlighting its role as a key modifiable risk factor.
3. These findings support phenotype-specific risk stratification and targeted interventions for bone health preservation in prediabetes management and warrant confirmation in longitudinal studies.
Notes
CRedit authorship contributions
Yong Jun Choi: conceptualization, methodology, investigation, data curation, formal analysis, validation, writing - original draft, writing - review & editing, visualization; Ja Young Jeon: methodology, formal analysis, writing - review & editing; Kyoung Hwa Ha: methodology, resources, data curation, formal analysis; Dae Jung Kim: writing - review & editing, supervision, project administration, funding acquisition
Conflict of Interest
The authors disclose no conflicts.
Funding
This study received funding from the Korean Health Technology R&D Project, Ministry of Health & Welfare, Republic of Korea (Grant No. HI13C0715).