Population-specific rare variants influence age at diagnosis in Korean inflammatory bowel disease
Article information

Abstract
Background/Aims
Inflammatory bowel disease (IBD), which includes Crohn's disease (CD) and ulcerative colitis (UC), is increasing in East Asia. Most known susceptibility loci, identified primarily in Europeans, remain insufficient to explain clinical heterogeneity in Asians. We performed whole-exome sequencing in Korean IBD patients to identify population-specific variants influencing age at diagnosis.
Methods
We analyzed 341 Korean IBD patients (192 CD, 149 UC) from three cohorts. Case-control analysis with external controls was confounded by platform heterogeneity, so we used a within-case Cox proportional hazards model instead. Variants were prioritized using a dual-threshold strategy. Gene-level analysis identified subtype-specific pathways, and disease progression was assessed in patients with longitudinal data (n = 206).
Results
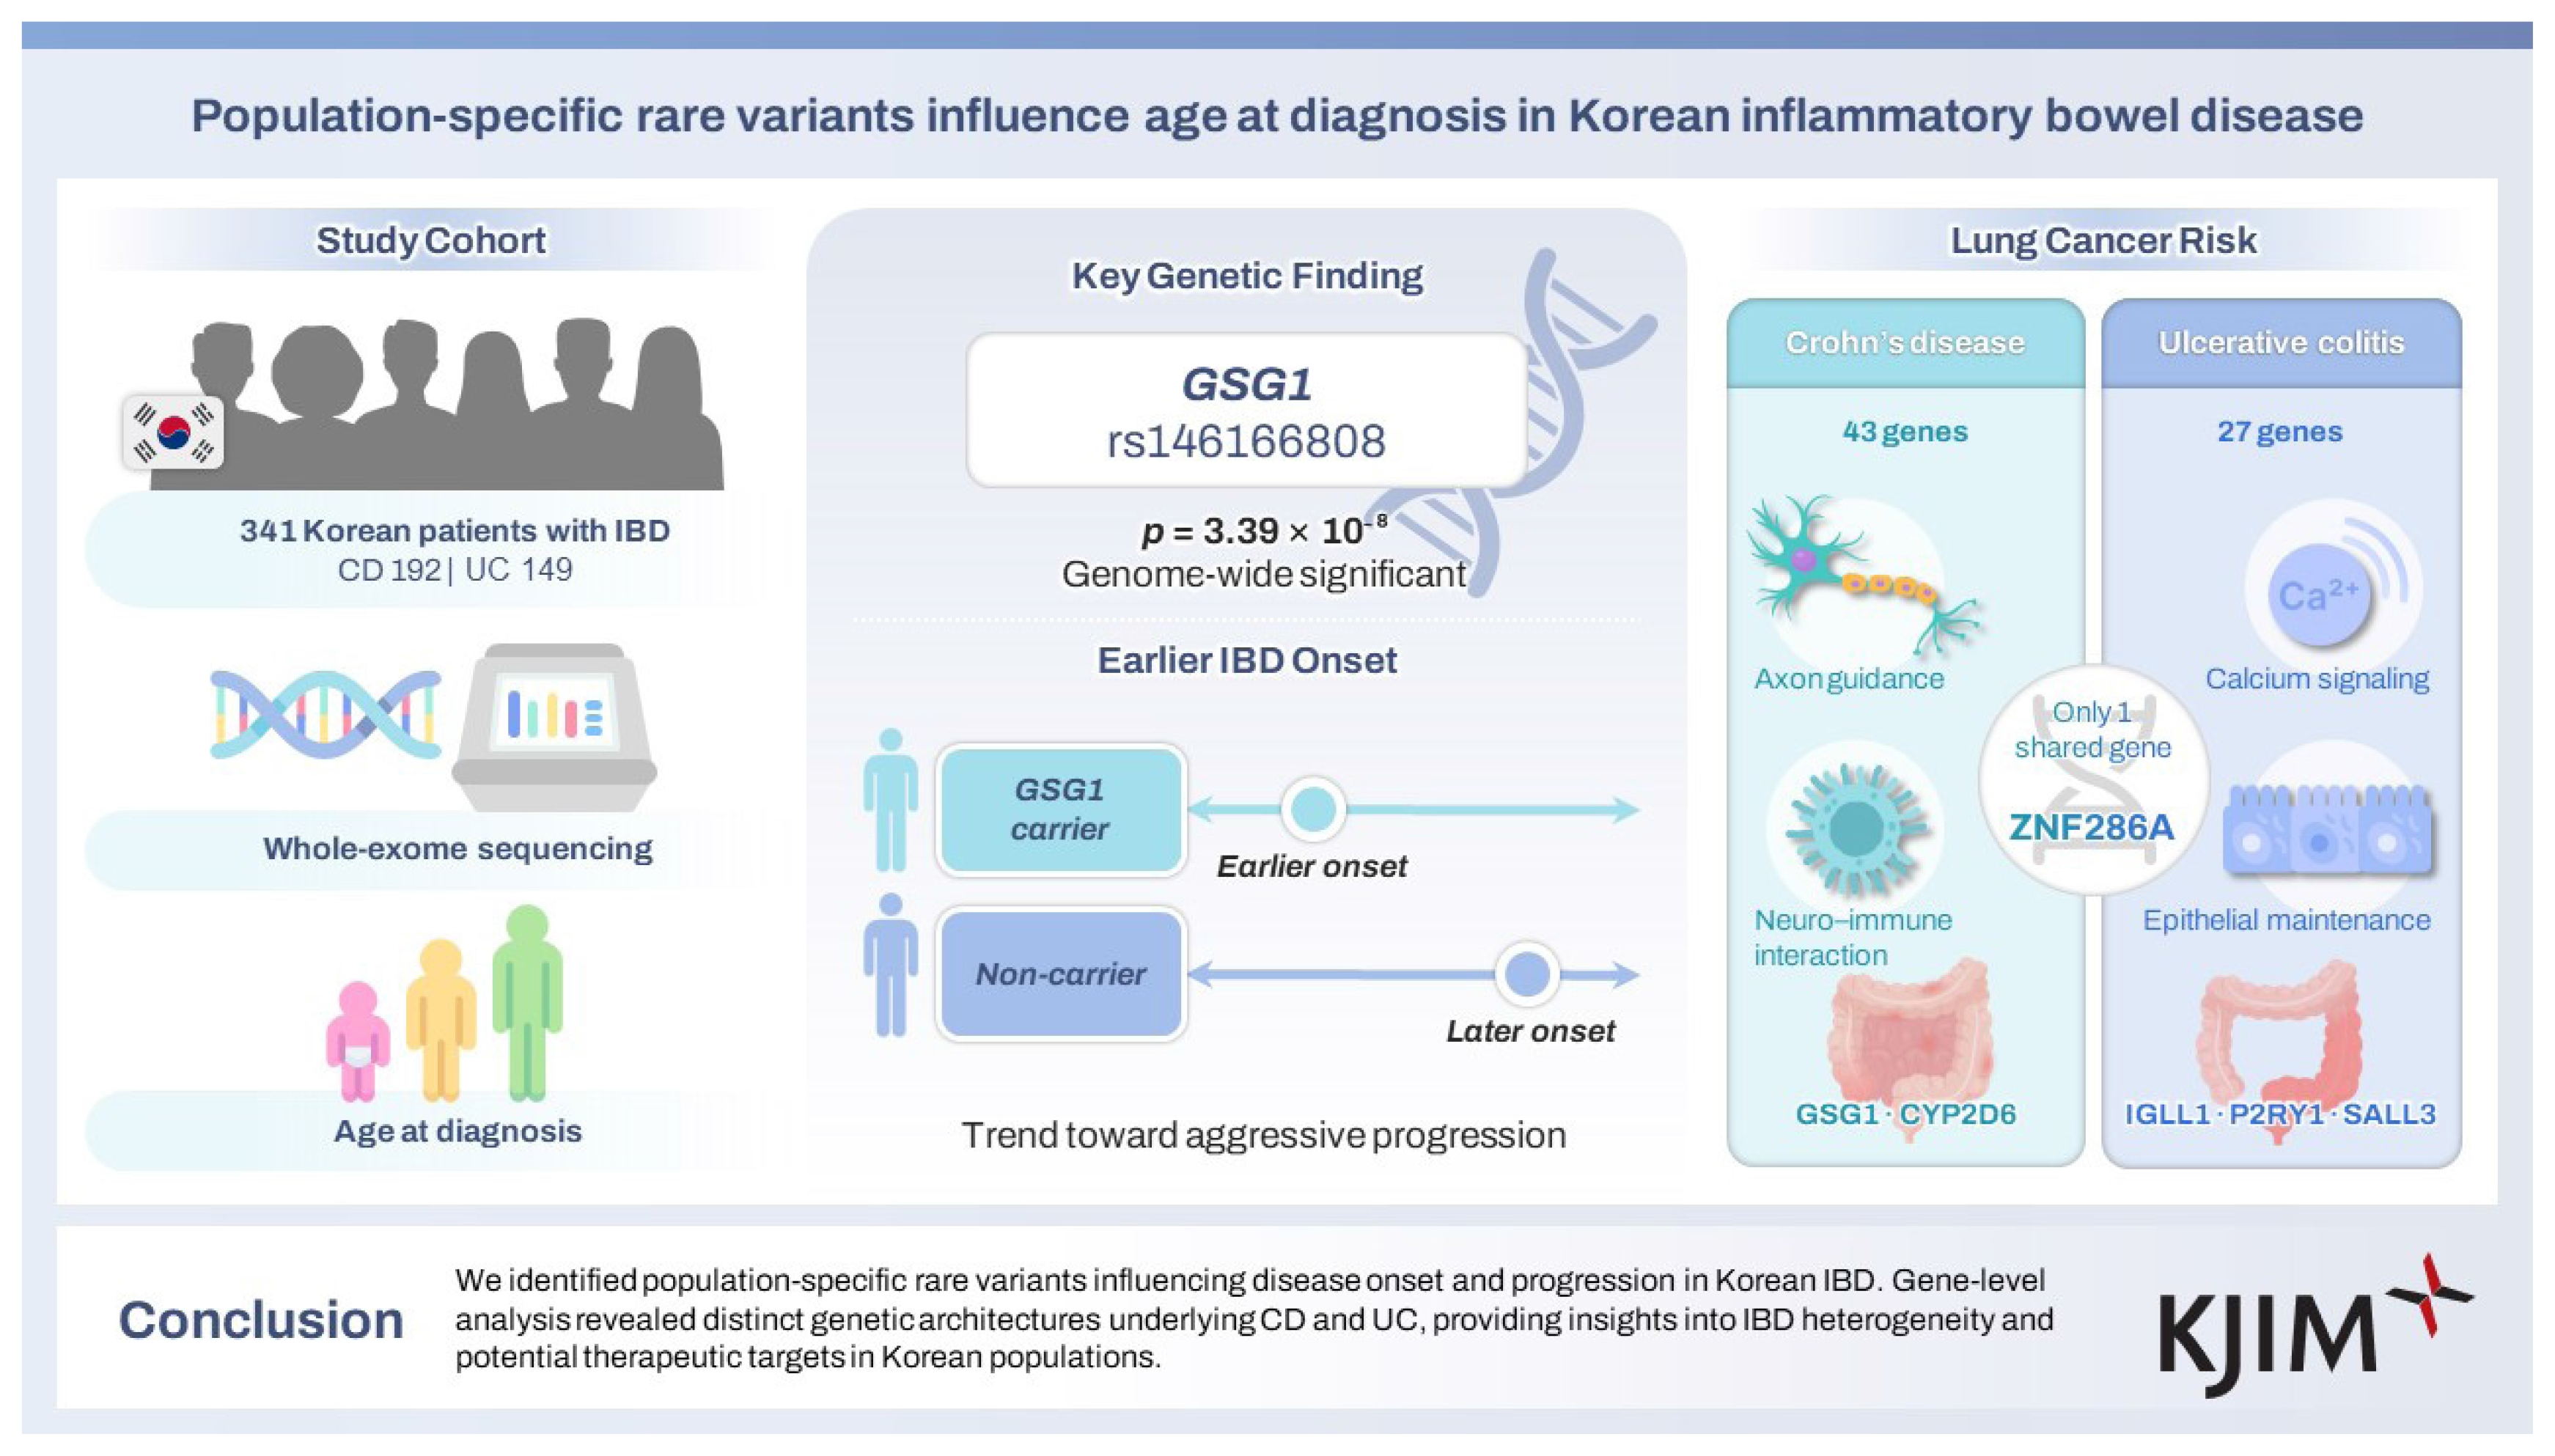
We identified 12 novel rare variants (minor allele frequency < 0.01 in gnomAD) predominantly observed in East Asian populations. One variant in GSG1 (rs146166808) reached genome-wide significance (p = 3.39 × 10⁻⁸); carriers showed accelerated disease onset and increased risk of aggressive progression (OR = 12.52, p = 0.050). Subtype-specific analyses identified two variants for CD (GSG1, CYP2D6) and five for UC (including IGLL1). Gene-level analysis revealed distinct genetic architectures: CD showed enrichment for axon guidance pathways (p = 0.000065), whereas UC showed enrichment for calcium signaling and tissue maintenance pathways (p = 0.00068).
Conclusions
We identified population-specific rare variants influencing disease onset and progression in Korean IBD. Distinct genetic architectures underlying CD and UC provide insight into IBD heterogeneity and potential therapeutic targets in this population.
INTRODUCTION
Inflammatory bowel disease (IBD), comprising Crohn’s disease (CD) and ulcerative colitis (UC), is a chronic relapsing disorder of the gastrointestinal tract characterized by complex immune dysregulation [1,2]. While IBD has historically been prevalent in Western populations―with prevalence rates of 322 (CD) and 505 (UC) per 100,000 in Europe―its incidence in East Asia has surged since the 1990s, contrasting with the plateauing trends observed in the West [3]. This rapid epidemiological shift underscores the need to understand genetic determinants in Asian populations, which remain underrepresented in global genomic studies.
Despite advances in therapeutic strategies, IBD management remains challenging due to heterogeneous clinical manifestations [4]. Genome-wide association studies (GWAS) have identified over 200 IBD risk loci; however, most are located in non-coding regions with unclear functional consequences, and explain only a fraction of disease heritability [5]. Whole-exome sequencing (WES) offers a complementary approach by identifying rare, deleterious coding variants that may exert stronger functional impacts [6]. The genetic architecture of IBD shows substantial population-specific variation. Established Western risk variants, such as NOD2, show limited replicability in East Asian populations, while loci like TNFSF15 exert stronger effects in Asians [7]. This ethnic heterogeneity underscores the need for population-specific genomic studies in East Asian IBD.
While GWAS has primarily focused on disease susceptibility, age at diagnosis represents an important clinical phenotype with distinct genetic underpinnings. Recent studies demonstrate that age of first occurrence has non-trivial heritability and contains genetic risk factors not fully captured by susceptibility loci, with earlier onset correlating with higher polygenic risk [8]. In IBD, early-onset disease often reflects higher genetic burden and more aggressive pathology, making onset timing a clinically relevant phenotype for genetic investigation [9]. To identify genetic determinants of age at diagnosis, we employed a within-case Cox proportional hazards analysis. This approach analyzes phenotypic variation within the patient cohort, avoiding platform-specific confounding that can arise when comparing cases to external controls. Recent evidence demonstrates that genetic determinants of disease susceptibility and disease progression are largely distinct, supporting the value of within-case designs for identifying clinically relevant genetic modifiers beyond susceptibility loci [10,11].
In this study, we performed WES-based analysis to identify genetic determinants of age at diagnosis in a Korean cohort. We identified novel rare variants predominantly observed in East Asian populations and revealed distinct genetic architectures underlying CD and UC. These findings provide insights into population-specific genetic determinants of IBD clinical heterogeneity and potential targets for mechanistic investigation.
METHODS
Study participants
This study included three Korean IBD cohorts. The medical records of patients with IBD were retrospectively reviewed. Cohort 1 (n = 109) comprised patients with IBD (89 CD, 20 UC) aged 20–80 years who were treated with thiopurines at five tertiary hospitals between January 2016 and September 2019. These patients were originally enrolled in a controlled trial on thiopurines and provided informed consent for the secondary use of their samples and genetic information. Cohort 2 (n = 100) comprised patients diagnosed with UC aged ≥ 15 years who were randomly selected from individuals registered in the IBD registry at the gastroenterology department of a single tertiary hospital, Severance Hospital (Seoul, Korea). This registry consists of blood samples obtained from patients who visited the hospital between 2020 and 2022 and consented to the use of their clinical data for research purposes. Cohort 3 (n = 135) comprised patients with IBD (104 CD, 31 UC) diagnosed at a single tertiary hospital, Severance Hospital (Seoul, Korea), between June 2002 and August 2015.
After quality control and outlier removal, three samples were excluded, yielding a final pooled cohort of 341 individuals (Cohort 1: n = 106; Cohort 2: n = 100; Cohort 3: n = 135). This study was conducted in accordance with the ethical guidelines of the 1975 Declaration of Helsinki and approved by the Institutional Review Board of Severance Hospital (IRB numbers: 4-2016-0812, 4-2012-0302).
Clinical Information
Disease phenotypes were classified according to the Montreal classification [12]. For UC, disease extent was categorized as proctitis (E1), left-sided colitis (E2), or extensive colitis (E3). For CD, patients were classified by age at diagnosis (A1: ≤ 16 years, A2: 17–40 years, A3: > 40 years), disease location (L1: ileal, L2: colonic, L3: ileocolonic, L4: isolated upper disease), and disease behavior (B1: non-stricturing non-penetrating, B2: stricturing, B3: penetrating). Disease severity at sample collection was assessed using the Mayo Endoscopic Score for UC and the Crohn’s Disease Activity Index for CD. These severity indices were collected at the time of sample collection and were not included as covariates in the primary analyses, as they are temporally independent from age at diagnosis.
Clinical outcome data were collected for patients in Cohorts 1 and 2 (n = 206), including time from IBD diagnosis to first hospitalization, first surgery, and initiation of biologic therapy. These data were used to evaluate associations between identified genetic variants and disease progression.
WES
For Cohorts 1 and 2, genomic DNA was isolated using the DNeasy Blood & Tissue Kit (Qiagen, Valencia, CA, USA). Target enrichment was performed using the Twist Human Core Exome (Twist Bioscience, San Francisco, CA, USA), and sequencing was conducted on the Illumina NovaSeq 6000 platform (Illumina, San Diego, CA, USA) by Macrogen (Seoul, Korea). For Cohort 3, genomic DNA was extracted using the QIAamp DNA Blood Mini Kit (Qiagen), enriched with the SureSelectXT Target Enrichment Kit (Agilent Technologies, Santa Clara, CA, USA), and sequenced (2 × 100 bp paired-end reads) on an Illumina HiSeq 2500 platform (Illumina) at Theragen Etex Bio Institute (Suwon, Korea).
All sequencing data underwent identical preprocessing and variant calling pipelines. Raw sequence reads in FASTQ format were aligned to the GRCh37 human reference genome using Burrows-Wheeler Aligner (BWA version 0.7.17) [13]. Duplicate reads were marked and removed using Picard (version 2.22.3), and base quality score recalibration was performed using the Genome Analysis Toolkit (GATK version 4.1.7.0) [14]. Variant calling was performed using GATK HaplotypeCaller to generate individual variant call format (VCF) files for each sample. Low-quality variants were filtered using GATK VariantFiltration with the following criteria: for single nucleotide variants (SNVs), quality by depth (QD) < 2.0, depth (DP) < 10.0, quality (QUAL) < 30.0, strand odds ratio (SOR) > 3.0, Fisher strand bias (FS) > 60.0, mapping quality (MQ) < 40.0. MQRankSum < −12.5, and ReadPosRankSum < −8.0; for indels, QD < 2.0, DP < 10.0, QUAL < 30.0, FS > 200.0, and ReadPosRankSum < −20.0. This yielded 323,706 variants in Cohort 1, 261,130 in Cohort 2, and 386,516 in Cohort 3. Variants were annotated using ANNOVAR [15] (latest release) to identify functional consequences.
Data processing and quality control
Genotyping data were processed using PLINK (v1.9) [16]. Only variants present across all three cohorts were retained for merging. Principal component analysis (PCA) was performed using PLINK (v1.9) on LD-pruned common variants (minor allele frequency [MAF] ≥ 1%) after excluding long-range linkage disequilibrium (LD) regions. Three samples showing deviation from the mean in PC1 or PC2 (> 3 standard deviations) [17] were excluded (Supplementary Fig. 1), yielding a final pooled case cohort of 341 individuals.
Two distinct datasets were constructed: (1) a case-control dataset for exploratory susceptibility analysis, and (2) a within-case dataset for the primary analysis of age at diagnosis and clinical progression. We first evaluated a case-control approach using Japanese (JPT) and Han Chinese (CHB) sequences (n = 207) from the 1000 Genomes Project Phase 3 as controls, selected based on their genetic proximity to Koreans [18,19]. Only variants present in both cases (n = 341) and controls were retained to minimize platform-specific bias. After merging (N = 548), variants with missingness > 5% were excluded using a stringent threshold to minimize platform-related artifacts. Following functional annotation using ANNOVAR (hg19) to identify nonsynonymous SNVs, start-loss, stop-gain, and stop-loss variants, 16,123 variants were retained. For the within-case analysis, quality control was applied to the pooled case cohort (n = 341): variants with missingness > 10% and samples with missingness > 10% were excluded, and variants deviating from Hardy-Weinberg equilibrium (p < 1 × 10⁻⁶) were removed. A standard missingness threshold was applied to maximize variant retention for the primary analysis, as platform-specific bias was not a concern within a homogeneous cohort. Following functional annotation, 20,527 variants were retained for analysis of age at diagnosis and clinical progression.
Association analyses
Case-control analysis
Firth logistic regression was performed to identify disease-susceptibility variants. Principal components (PCs) were extracted from the merged case-control dataset (n = 548) using PLINK, and the top 10 PCs were included as covariates to control for population stratification and platform-related batch effects.
Within-case Cox proportional hazards analysis
To identify genetic determinants of age at diagnosis, Cox proportional hazards models were applied to the within-case dataset. PCs were extracted from the pooled case cohort (n = 341) using PLINK, and models were adjusted for sex, smoking history, cohort, and the top 10 PCs. Associations were evaluated at both the variant level and gene level. For gene-level analysis, gene-wise variant burden (GVB) scores were calculated for each individual as the geometric mean of SIFT scores (< 0.7) within each coding gene [20]. Lower GVB scores indicate higher burden of deleterious variants. A total of 8,658 genes were analyzed. A dual-threshold filtering strategy was applied to prioritize candidates: variants were required to meet either genome-wide significance (p < 5 × 10⁻⁸) or a suggestive threshold (p < 1 × 10⁻⁵) at the variant level, and gene-level significance (false discovery rate [FDR] < 0.05) simultaneously.
Sensitivity analysis for extreme phenotypes
To investigate genetic variants driving extreme early-onset phenotypes, we compared very early-onset patients (Montreal A1, ≤ 16 yr) and late-onset patients (Montreal A3, > 40 yr) using Firth logistic regression. Candidates were defined as variants meeting gene-level (p < 0.05) and variant-level (p < 5 × 10⁻⁴) significance.
Disease progression analysis
To evaluate whether variants associated with age at diagnosis also contribute to aggressive disease progression, we analyzed patients from Cohorts 1 and 2 (n = 206) with available longitudinal follow-up data. Disease progression was defined as a composite outcome of severe clinical events: ≥ 2 major events (hospitalization, surgery, or biologics) for CD, and both hospitalization and biologics for UC. Firth logistic regression was performed adjusting for sex.
Functional enrichment analysis
Gene set enrichment analysis was performed using cluster-Profiler (v4.6.2) [21] to identify biological pathways enriched among significantly associated genes. Gene Ontology and Kyoto Encyclopedia of Genes and Genomes pathway databases were queried, and pathways with p < 0.05 were considered significant.
Evaluation of established susceptibility loci
To assess whether known IBD susceptibility loci explain variation in age of onset, we screened 224 high-risk associations from a systematic review of 16 GWAS studies (2007–2021) and 783 general associations from the GWAS Catalog [22] (EFO IDs: EFO_0003767, EFO_0000384, EFO_0000729) (Supplementary Table 1). Associations with identified variants were evaluated using the within-case Cox proportional hazards analysis described above.
Statistical analysis
Baseline characteristics were compared between cohorts using one-way ANOVA for continuous variables (age of onset) and Fisher’s exact test for categorical variables (sex, smoking history, disease location, behavior). Genomic inflation factors (λ) were calculated to assess the robustness of association results. Multiple testing correction was performed using the Benjamini-Hochberg FDR method. Kaplan-Meier survival analysis was performed to visualize the impact of candidate variants on disease onset timing, and log-rank tests were used to compare survival curves between carrier and non-carrier groups. Forest plots were generated to display hazard ratios (HR) and 95% confidence intervals (CI) stratified by disease phenotype. To investigate the tissue and cell-type specific expression of GSG1, single-cell RNA expression data were retrieved from the Human Protein Atlas (www.proteinatlas.org). Expression levels are presented as normalized counts per million (nCPM). All statistical analyses were performed using R version 4.2.2.
RESULTS
Baseline patient characteristics
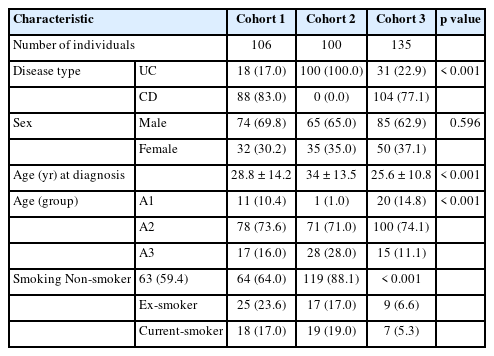
Baseline characteristics of the pooled case cohort (n = 341) are summarized in Table 1. Sex distribution was comparable across cohorts (p = 0.596), with male predominance of approximately 63–70%. Disease type differed significantly (p < 0.001); Cohort 2 consisted exclusively of UC, whereas CD was predominant in Cohorts 1 and 3. Mean age at diagnosis varied significantly (p < 0.001), ranging from 25.6 to 34.0 years. Smoking history also differed significantly (p < 0.001), with Cohort 3 showing the highest proportion of non-smokers.
Baseline characteristics of patients
Evaluation of case-control analysis and established susceptibility loci
A case-control analysis was initially evaluated using Firth logistic regression with JPT and CHB sequences from the 1000 Genomes Project Phase 3 as controls. Despite adjustment for PCs (PC1–10), the summary statistics exhibited substantial distortion of test statistics (λ = 0.695–1.407) (Supplementary Fig. 2). The top-ranked variants showed extreme odds ratios (OR) and CI indicative of quasi-complete separation between cases and controls. PCA revealed distinct cohort clustering (Supplementary Fig. 3), reflecting systematic platform heterogeneity between case and controls. These case-control results were excluded from further analysis.
To evaluate whether established susceptibility loci could explain variation in age of onset, 224 high-risk associations from a systematic review and 783 general associations from the GWAS Catalog were screened (Supplementary Data 1). The vast majority of these variants (92.9% of high-risk loci and 94.3% of GWAS Catalog) were located in intronic or non-coding regions, rendering them undetectable by WES. Among the captured coding variants, 8 were identified from the high-risk set and 15 from the GWAS Catalog. Of these 23 variants, 13 were originally discovered in European populations, 8 in multi-ethnic studies, and 1 in a Korean population (rs7641878). None of these variants were significantly associated with age of onset. Two European-derived variants (rs3749171, rs2234161) showed nominal associations (p < 0.05), while the Korean-specific variant (rs7641878) showed no association (p = 0.526) (Supplementary Table 2).
Identification of novel loci associated with age at diagnosis
A within-case Cox proportional hazards analysis was performed to identify genetic determinants of age at diagnosis. Genomic inflation factors (λ) ranged from 1.14 to 1.22 across variant-wise analyses and from 1.16 to 1.21 across gene-wise analyses (Supplementary Fig. 4), consistent with true polygenicity rather than technical artifacts [23]. Variants were prioritized using a dual-threshold filtering strategy requiring both variant-level (p < 5 × 10⁻⁸ or p < 1 × 10⁻⁵) and gene-level significance (FDR < 0.05). In subtype-specific analyses, 2 suggestive variants were identified for CD (GSG1, CYP2D6) and 5 for UC (GLYATL1, SALL3, IGLL1, P2RY1, ZNF454), all meeting gene-support criteria (Fig. 1). In the combined IBD analysis, 1 variant in GSG1 achieved genome-wide significance (p = 3.39 × 10⁻⁸), and 3 variants (ZNF286A, DLL3, FRMD4B) reached the suggestive threshold (Supplementary Fig. 5). All prioritized candidates were rare variants (MAF < 0.01 in gnomAD) predominantly observed in East Asian populations (Supplementary Table 3).
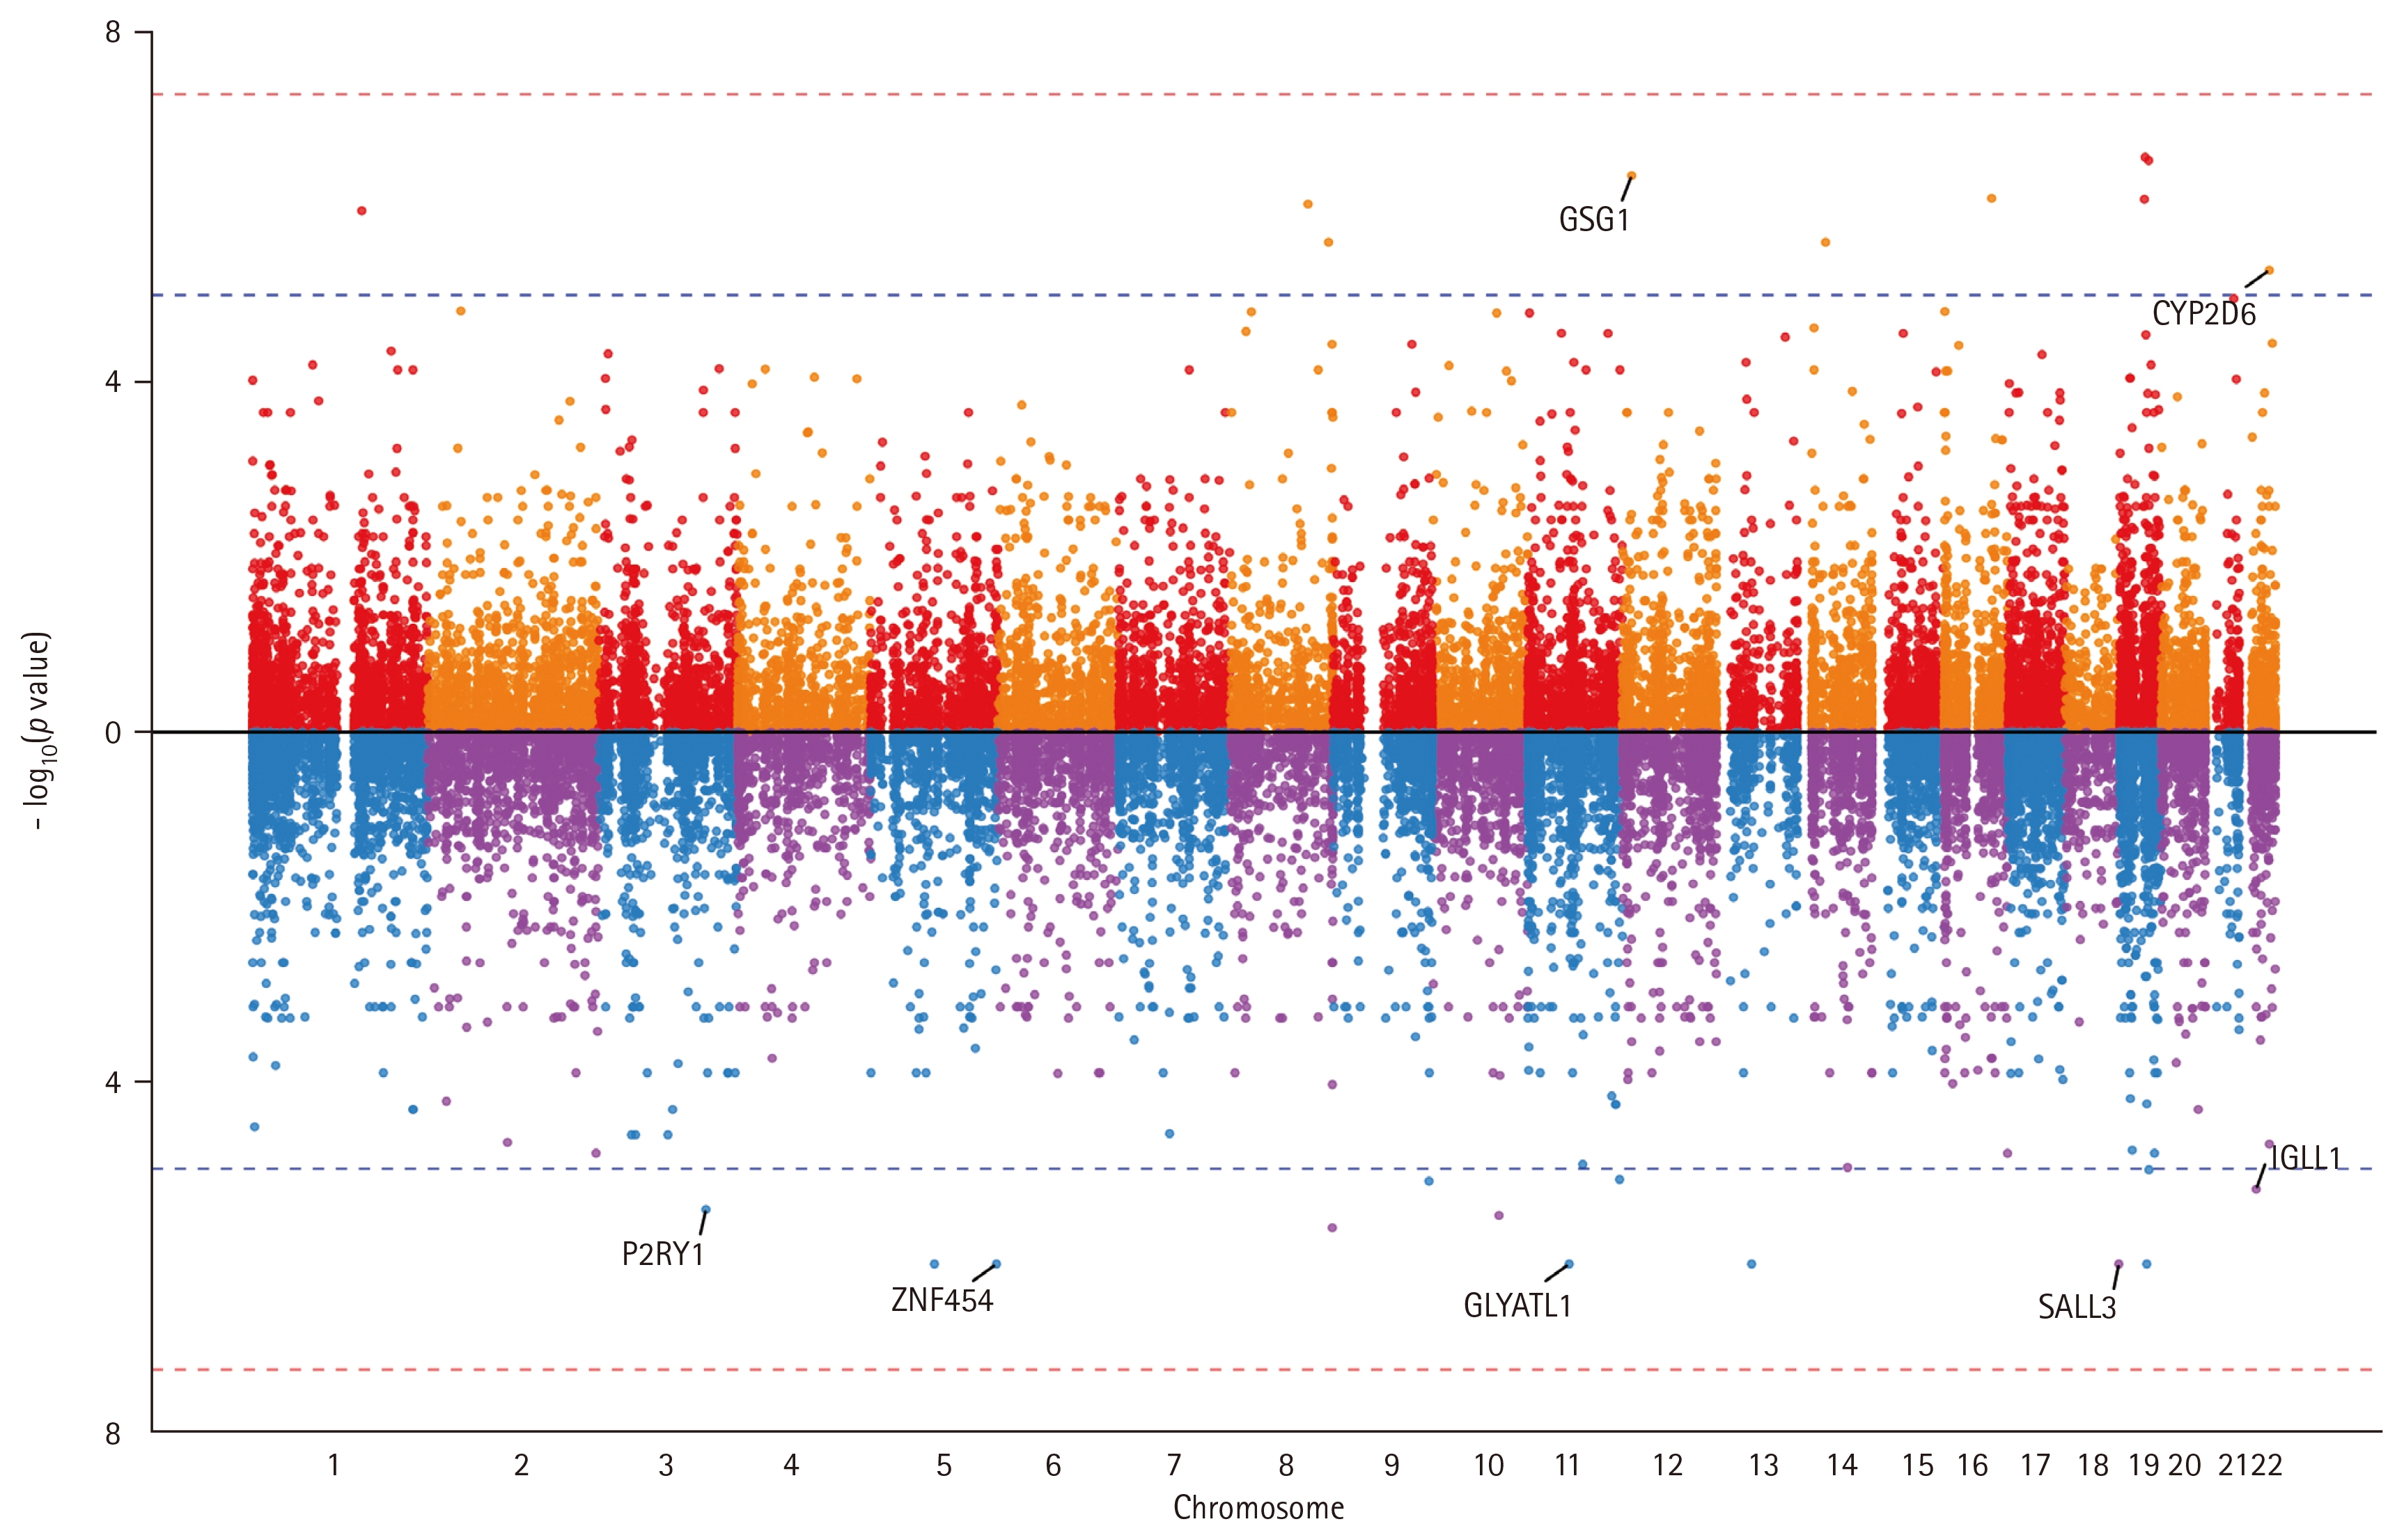
Variant-wise associations with age at diagnosis in Crohn’s disease (CD) and ulcerative colitis (UC). Miami plot showing associations for CD (upper panel) and UC (lower panel). Red and blue dashed lines indicate genome-wide (p < 5 × 10⁻⁸) and suggestive (p < 1 × 10⁻⁵) significance thresholds, respectively. Annotated genes represent variants meeting both variant-level (p < 1 × 10⁻⁵) and gene-level (FDR < 0.05) significance. All annotated candidates are rare variants (MAF < 0.01) predominantly observed in East Asian populations. FDR, false discovery rate; MAF, minor allele frequency.
To characterize the clinical impact of these variants, effect sizes and disease onset timing were evaluated. Forest plot analysis revealed substantial risk effects (HR > 1.5) for most candidates, with GSG1 (rs146166808) demonstrating the strongest effect in CD and combined IBD cohorts (Fig. 2A, C). Kaplan-Meier survival analysis confirmed markedly accelerated disease onset in GSG1 carriers compared to non-carriers in the CD cohort (Fig. 2D). In the UC cohort, IGLL1 carriers (N = 6, the highest among UC candidates) showed clear separation in survival probability (Fig. 2E). The stepwise decline in disease-free survival demonstrated a robust biological impact (p < 0.0001).
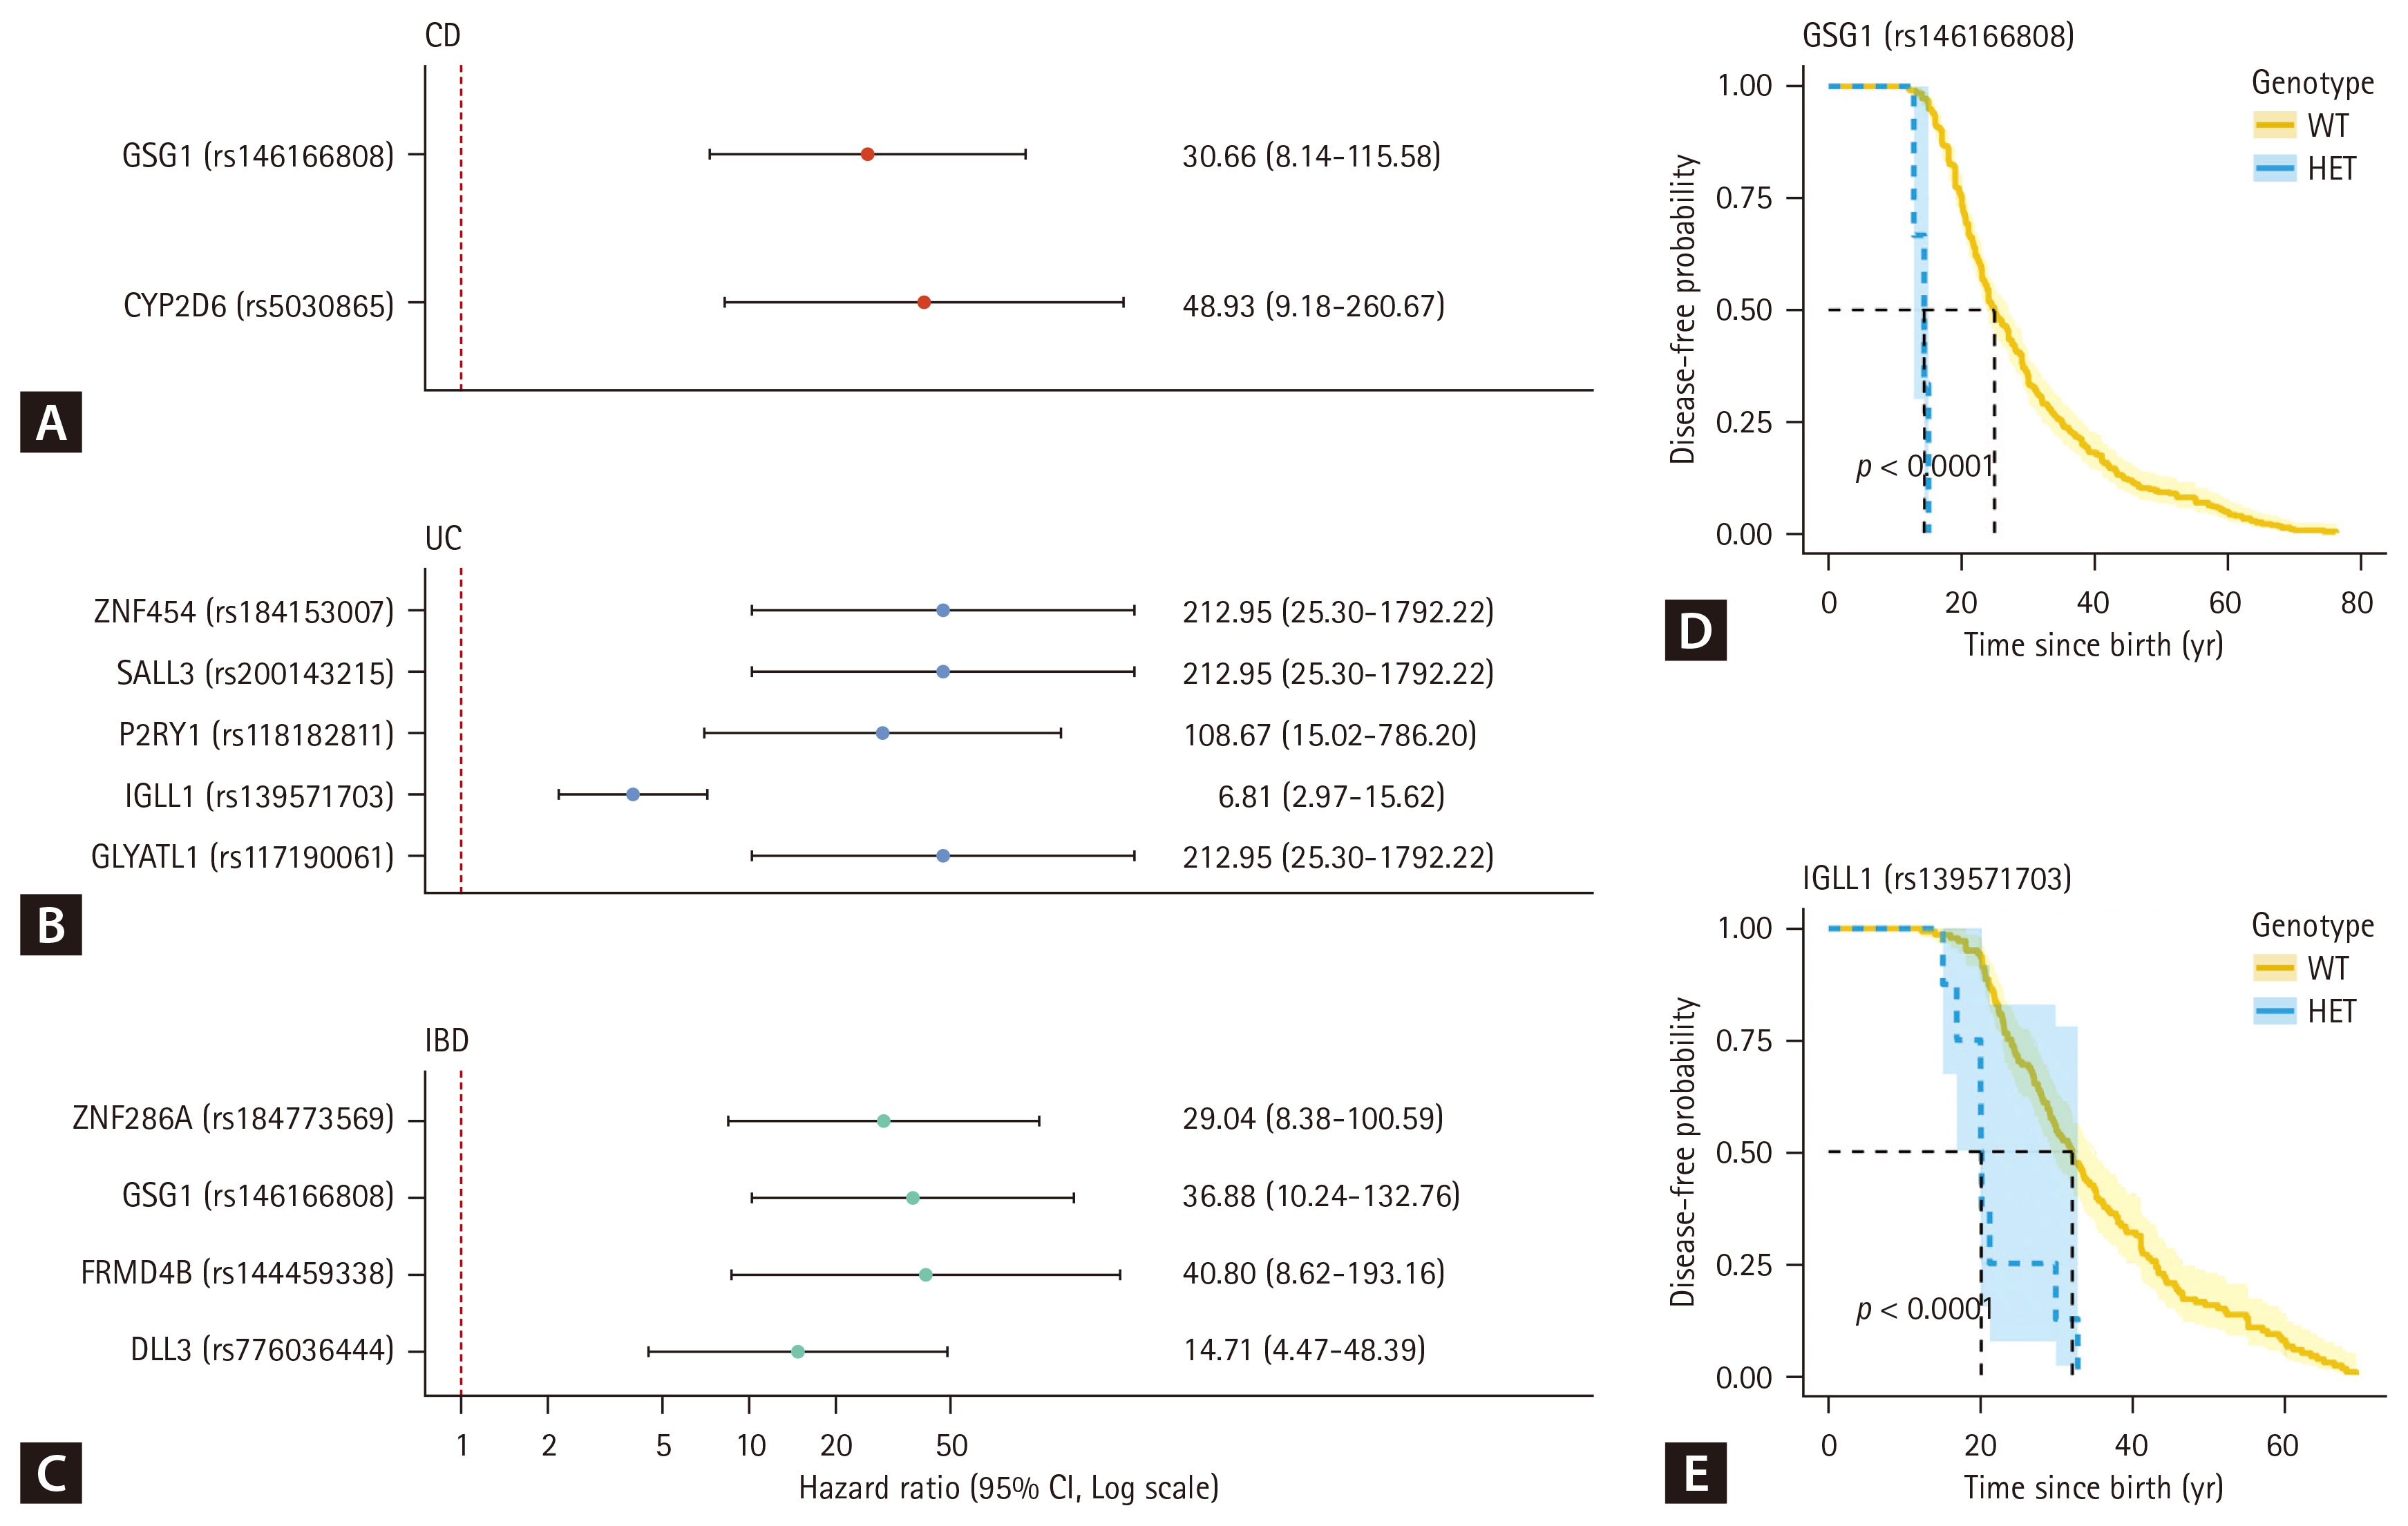
Effect sizes and disease onset timing of prioritized variants. (A–C) Forest plots showing hazard ratios (HR) and 95% confidence intervals (CI) for prioritized candidates in (A) CD, (B) UC, and (C) combined IBD cohorts. Most variants exhibited substantial risk effects (HR > 1.5), with GSG1 (rs146166808) demonstrating the strongest effect in CD and combined IBD. (D, E) Kaplan-Meier survival curves showing disease onset in carriers (blue) versus non-carriers (yellow) for (D) GSG1 in CD and (E) IGLL1 in UC. Dashed vertical lines indicate median age of onset. Carriers exhibited markedly earlier disease onset (p < 0.0001, log-rank test). CD, Crohn’s disease; UC, ulcerative colitis; IBD, Inflammatory bowel disease; WT, wild type; HET, heterozygote.
To evaluate associations with disease progression, patients from Cohorts 1 and 2 (N = 206) with available longitudinal data were analyzed. Disease progression was defined as ≥ 2 major events (hospitalization, surgery, or biologics) for CD, and both hospitalization and biologics for UC. The GSG1 variant showed a trend toward increased risk of aggressive disease course (OR = 12.52, 95% CI: 0.59–264.79; p = 0.050), though this finding should be interpreted cautiously given the limited number of carriers (N = 2) and wide CI (Supplementary Table 4).
A sensitivity analysis comparing extreme phenotypes (Montreal A1 vs. A3) identified 2 additional candidates in the combined IBD cohort: SLC23A2 (rs141901582) and SERPINA6 (rs146744332), both meeting gene-level (p < 0.05) and variant-level (p < 5 × 10⁻⁴) thresholds (Supplementary Table 5).
Distinct genetic architectures underlying CD and UC
Gene-wise analysis identified 43 genes significantly associated with CD, 27 genes for UC, and 14 genes for combined IBD (FDR < 0.05) (Fig. 3A). CD and UC showed largely distinct gene sets, with only 1 gene (ZNF286A) overlapping between subtypes.
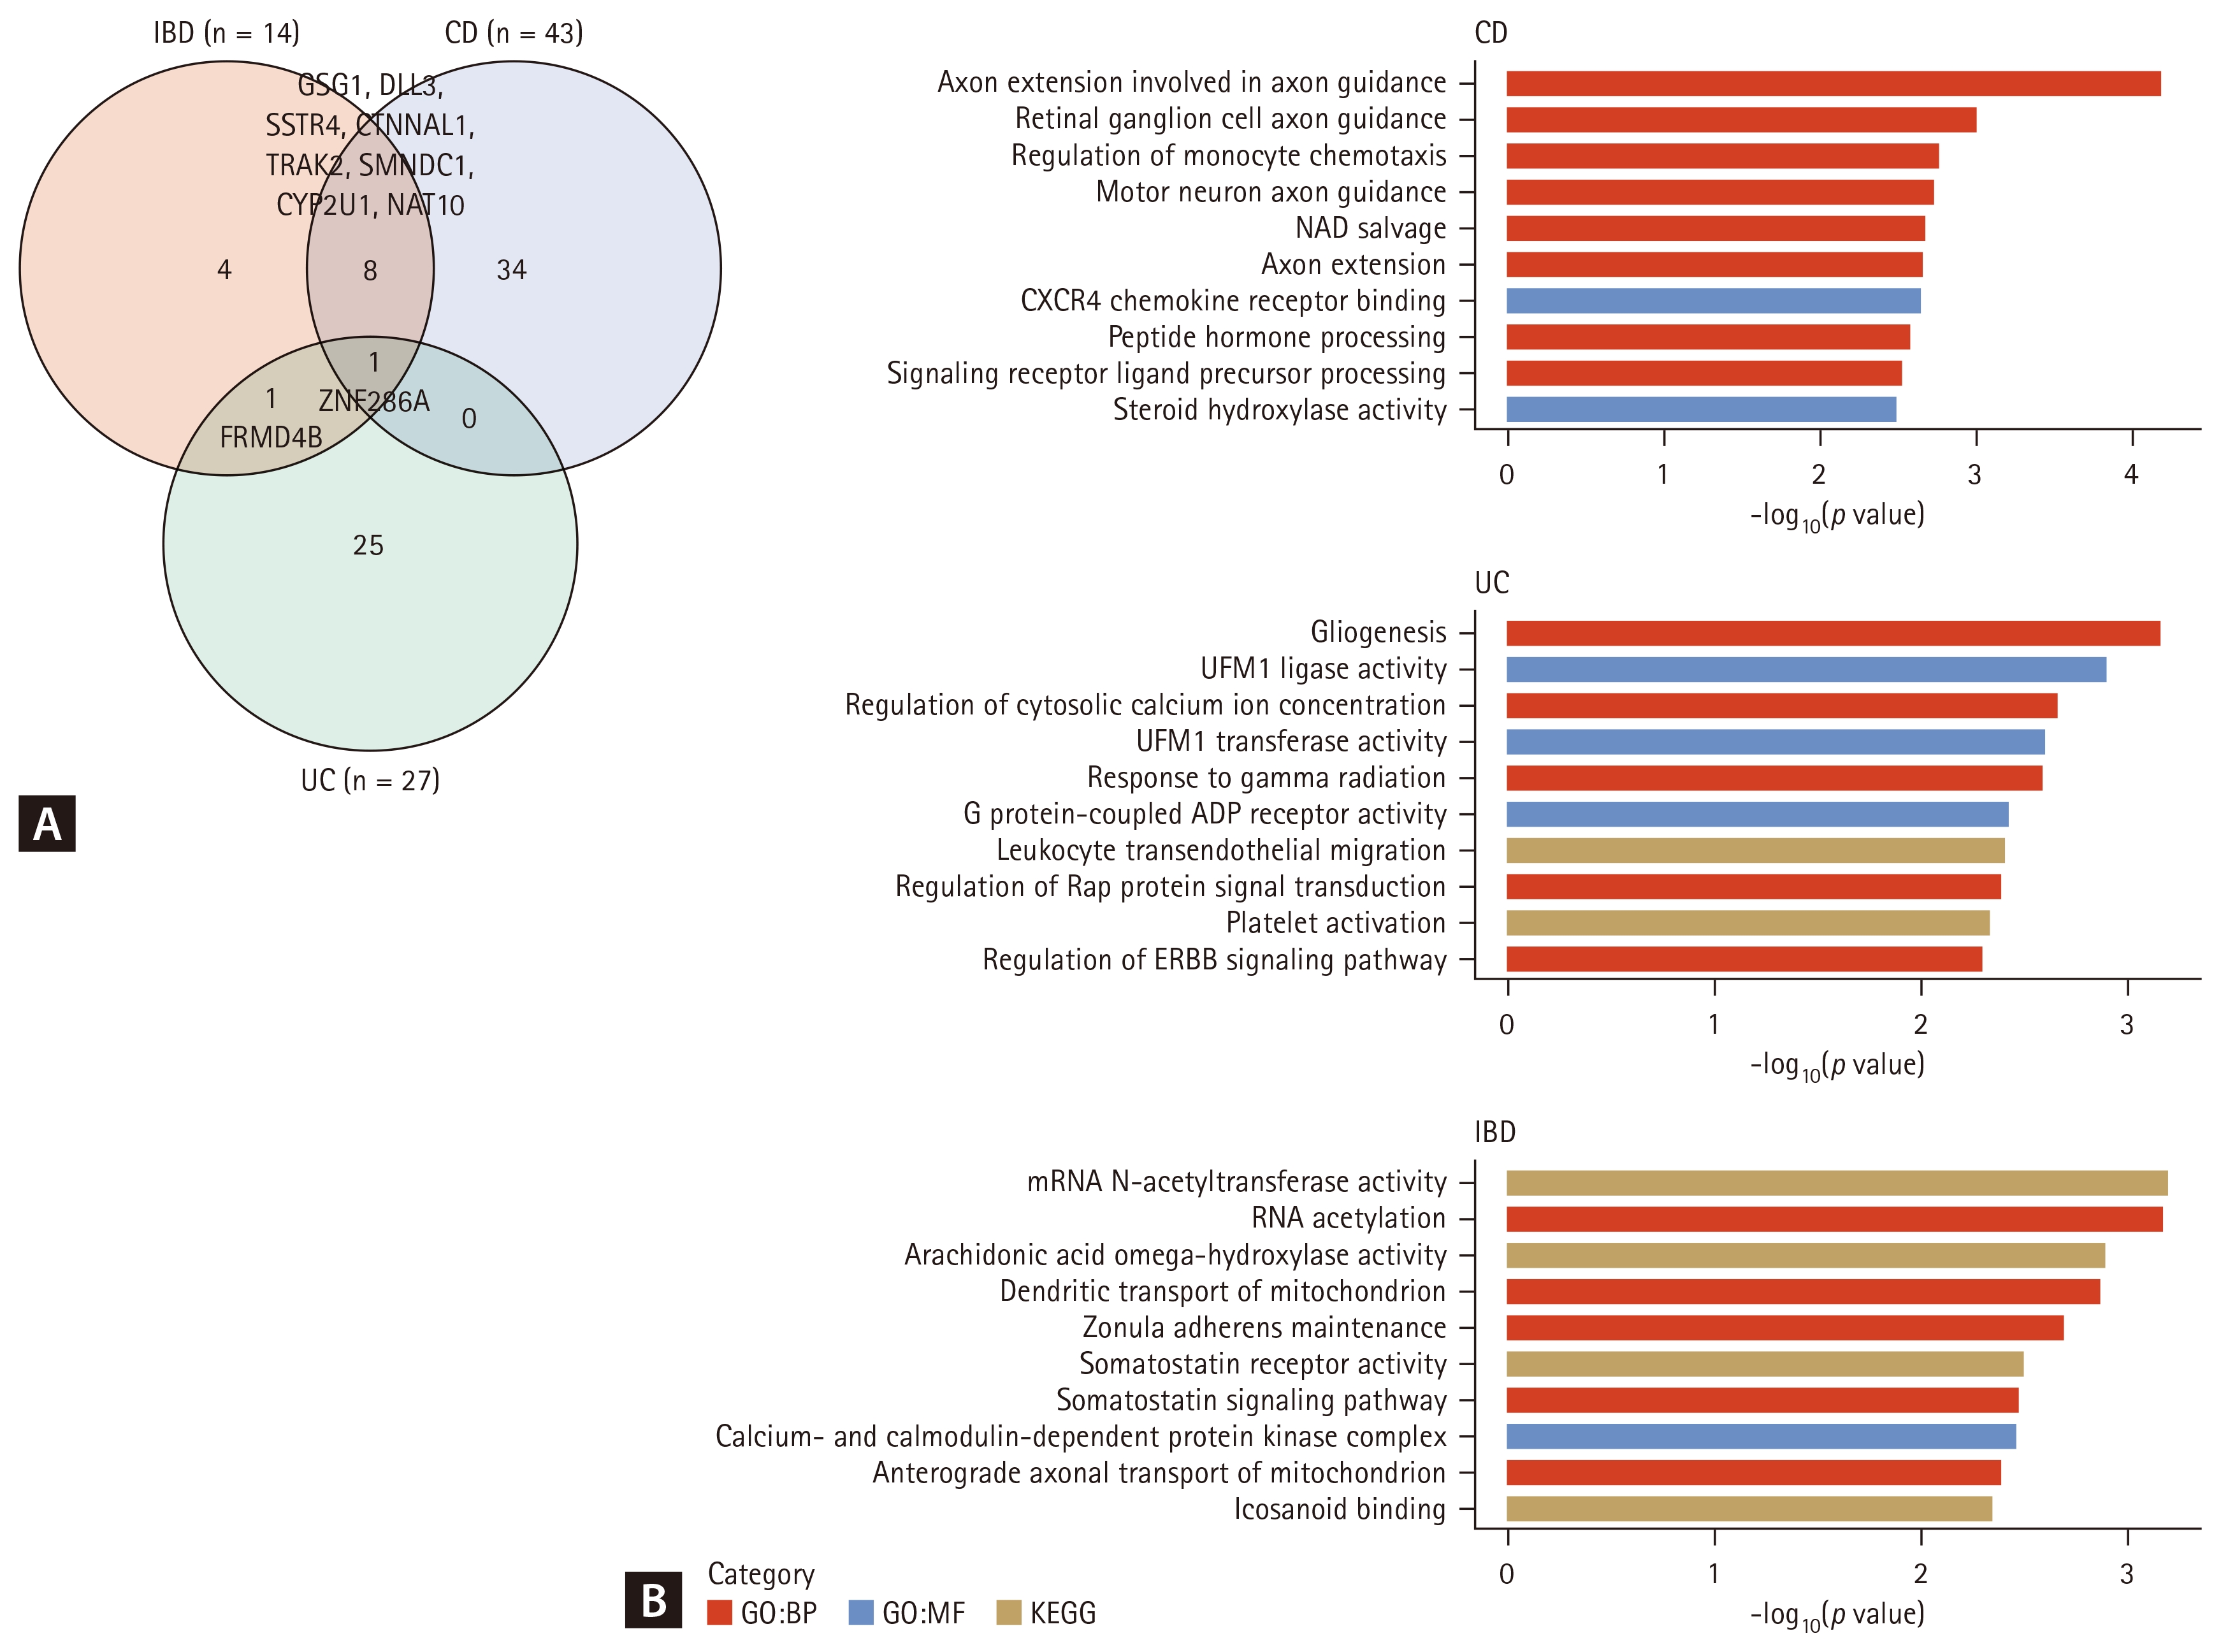
Gene-level associations and functional enrichment in IBD subtypes. (A) Venn diagram showing overlap of significantly associated genes (FDR < 0.05) identified in CD (n = 43), UC (n = 27), and combined IBD (n = 14). CD and UC exhibited largely distinct genetic architectures, with ZNF286A as the sole overlapping gene. (B) Significantly enriched biological pathways for CD, UC, and combined IBD. The x-axis represents −log10(p value). Pathways are categorized by Gene Ontology Biological Process (GO:BP, green), Molecular Function (GO:MF, purple), and KEGG pathways (orange). CD showed enrichment for axon guidance and monocyte chemotaxis pathways, UC for calcium signaling and protein quality control pathways, and combined IBD for RNA processing and cell adhesion pathways. CD, Crohn’s disease; UC, ulcerative colitis; IBD, Inflammatory bowel disease; FDR, false discovery rate; KEGG, Kyoto Encyclopedia of Genes and Genomes.
Functional enrichment analysis revealed subtype-specific biological processes (Fig. 3B, Supplementary Data 2). For CD, the most significantly enriched pathways included axon extension involved in axon guidance (SEMA4B, SLIT2, ALCAM; p = 0.000065) and regulation of monocyte chemotaxis (SLIT2, PLA2G7; p = 0.0017). Metabolic pathways including NAD salvage (NAPRT; p = 0.0021) were also enriched. For UC, the top enriched pathways included gliogenesis (TRPC4, P2RY1, UFL1, SALL3; p = 0.00068) and regulation of cytosolic calcium ion concentration (TRPC4, P2RY1; p = 0.0021). Protein quality control pathways including UFM1 ligase activity (UFL1; p = 0.0013) were also significant. In the combined IBD analysis, enriched pathways included mRNA N-acetyltransferase activity (NAT10; p = 0.00065), RNA acetylation (NAT10; p = 0.00069), and zonula adherens maintenance (KIFC3; p = 0.0021), alongside somatostatin signaling (SSTR4; p = 0.0033), representing processes shared across both subtypes.
DISCUSSION
In this study, we performed WES-based analysis of a Korean IBD cohort to identify coding variants influencing age at diagnosis. We identified 12 novel rare variants predominantly observed in East Asian populations, with GSG1 achieving genome-wide significance. Gene-level burden analysis revealed distinct genetic architectures underlying CD and UC, with CD enriched for axon guidance pathways and UC for calcium signaling and tissue maintenance processes. These findings provide insights into population-specific genetic determinants of IBD clinical heterogeneity in Korean populations.
Our within-case analytical strategy effectively addressed methodological challenges in rare variant analysis. Initial case-control analysis using external East Asian controls was confounded by platform heterogeneity between WES and whole-genome sequencing data, resulting in genomic inflation and quasi-complete separation despite covariate adjustment. By focusing on age at diagnosis within the patient cohort, we controlled for batch effects while identifying clinically relevant genetic modifiers. Case-only designs avoid biases associated with control recruitment and integrating external sequencing data [24], and can be more powerful for genetic association studies [25]. The identified variants showed similar allele frequencies in gnomAD East Asian populations as in our cohort, supporting true population-specific signals rather than technical artifacts. This approach proved particularly effective for detecting rare variants with large effect sizes that contribute to missing heritability [26].
GSG1 (rs146166808) emerged as the most compelling candidate, achieving genome-wide significance (p = 3.39 × 10⁻⁸) and showing consistent effects across CD and combined IBD cohorts. Carriers exhibited markedly accelerated disease onset and a trend toward increased risk of aggressive disease progression (OR = 12.52, p = 0.050), suggesting a dual role in disease timing and clinical trajectory. While GSG1 (Germ Cell Associated 1) has limited functional characterization―predicted to enable RNA polymerase binding and localize to endoplasmic reticulum membrane―the convergence of early onset and poor prognosis warrants further investigation. This locus may represent a high-impact genetic determinant requiring functional validation and replication in independent cohorts. Notably, single-cell RNA expression analysis using the Human Protein Atlas dataset revealed predominant GSG1 expression in intestinal neuroendocrine cells, particularly in small intestine (154.0 nCPM) and rectum (55.9 nCPM) (Supplementary Fig. 6), consistent with the axon guidance and neuro-immune interaction pathways enriched in CD-specific gene-level analysis.
Several other identified genes showed potential connections to IBD pathophysiology. FRMD4B (FERM Domain Containing 4B), identified in the combined IBD analysis, contains DUF3338 domains that regulate epithelial junction integrity, a process implicated in IBD-associated barrier dysfunction [27]. IGLL1 (Immunoglobulin Lambda Like Polypeptide 1), with 6 carriers representing the highest proportion among UC candidates, has been associated with B-cell deficiency and may contribute to the dysregulated plasmablast response characteristic of active UC [28]. Sensitivity analysis identified SLC23A2 (Solute Carrier Family 23 Member 2) and SERPINA6 (Serpin Family A Member 6). Variants in these genes may influence IBD risk through oxidative stress, nutrient metabolism [29], and glucocorticoid regulation [30]. However, most identified variants lack established functional connections to IBD and require experimental validation.
Gene-wise analysis revealed markedly distinct genetic architectures between CD and UC. CD showed enrichment for axon guidance pathways (SEMA4B, SLIT2, ALCAM) and monocyte chemotaxis regulation, consistent with neuro-immune interactions in CD pathogenesis [31]. UC exhibited enrichment for calcium signaling (TRPC4, P2RY1) and protein quality control pathways (UFL1). These findings are consistent with epithelial barrier dysfunction as a central pathogenic mechanism in UC, where disrupted calcium homeostasis and endoplasmic reticulum stress contribute to compromised intestinal barrier integrity [32]. The combined IBD analysis identified shared pathways including mRNA acetylation (NAT10) and zonula adherens maintenance (KIFC3). These converging lines of evidence reinforce that CD and UC, while sharing inflammatory features, are driven by distinct genetic and pathophysiological mechanisms, providing biological rationale for subtype-specific therapeutic strategies.
This study has several limitations. First, modest sample size limited statistical power, particularly for progression analysis (Cohorts 1 and 2, N = 206), reflected in marginal statistical significance of some findings. Second, data generated across different platforms and time periods may introduce batch effects, though we accounted for cohort effects in statistical models. Third, replication in independent Korean or East Asian cohorts is needed to validate findings, particularly for variants at suggestive thresholds. Furthermore, while GSG1 expression was observed in intestinal neuroendocrine cells, its precise functional role in intestinal tissues and immune cells requires experimental validation. Fourth, as this study relied on retrospective medical records, age at diagnosis may not perfectly reflect true disease onset due to diagnostic delay and changes in medical practices over time.
In conclusion, we identified novel rare coding variants influencing age at diagnosis in Korean IBD patients, with GSG1 achieving genome-wide significance and showing dual effects on onset and progression. Within-case analysis effectively identified high-impact rare variants while avoiding platform-specific confounding. Gene-level analysis revealed distinct genetic architectures underlying CD and UC, supporting divergent pathophysiological mechanisms. These results provide insights into population-specific genetic determinants of IBD heterogeneity and suggest targets for mechanistic investigation and subtype-specific therapeutic development in Korean populations.
KEY MESSAGE
1. WES identified 12 novel rare coding variants associated with age at diagnosis in Korean IBD, mostly specific to East Asian populations.
2. GSG1 carriers showed earlier disease onset and a possible increase in aggressive disease progression.
3. CD and UC showed distinct gene-level architectures: CD was enriched for axon guidance pathways, UC for calcium signaling and tissue maintenance.
Notes
CRedit authorship contributions
Mina Cho: methodology, investigation, formal analysis, validation, software, writing - original draft, visualization; DongHwan Shin: data curation, writing - original draft; Jongwook Yu: data curation, writing - original draft; Jae Hee Cheon: conceptualization, resources, writing - review & editing, supervision, project administration, funding acquisition; Ju Han Kim: conceptualization, resources, writing - review & editing, supervision, project administration, funding acquisition
Conflicts of interest
The authors disclose no conflicts.
Funding
This research was supported by the Korean Association of Internal Medicine Research Grant 2024.
Data availability statement
The datasets generated and analyzed during this study are not publicly available due to privacy restrictions but are available from the corresponding author upon reasonable request.