Probable obesity hypoventilation syndrome in a Korean medical intensive care unit: clinical characteristics and outcomes
Article information

Abstract
Background/Aims
Obesity hypoventilation syndrome (OHS) is associated with morbidity and intensive care unit (ICU) utilization. However, data from Asian ICUs are limited. We evaluated the proportion, characteristics, and outcomes of probable OHS among obese patients admitted to a medical ICU (MICU) in Korea.
Methods
We analyzed obese adults (body mass index [BMI] ≥ 27 kg/m2) admitted to the MICU at Seoul National University Hospital between 2016 and 2023. Probable OHS was defined as obesity with chronic hypercapnia (PaCO2 ≥ 45 mmHg and bicarbonate ≥ 27 mmol/L) without alternative causes. Clinical characteristics and outcomes were compared between the probable OHS and obese non-probable OHS groups. Mortality was evaluated using inverse probability of treatment weighting (IPTW).
Results
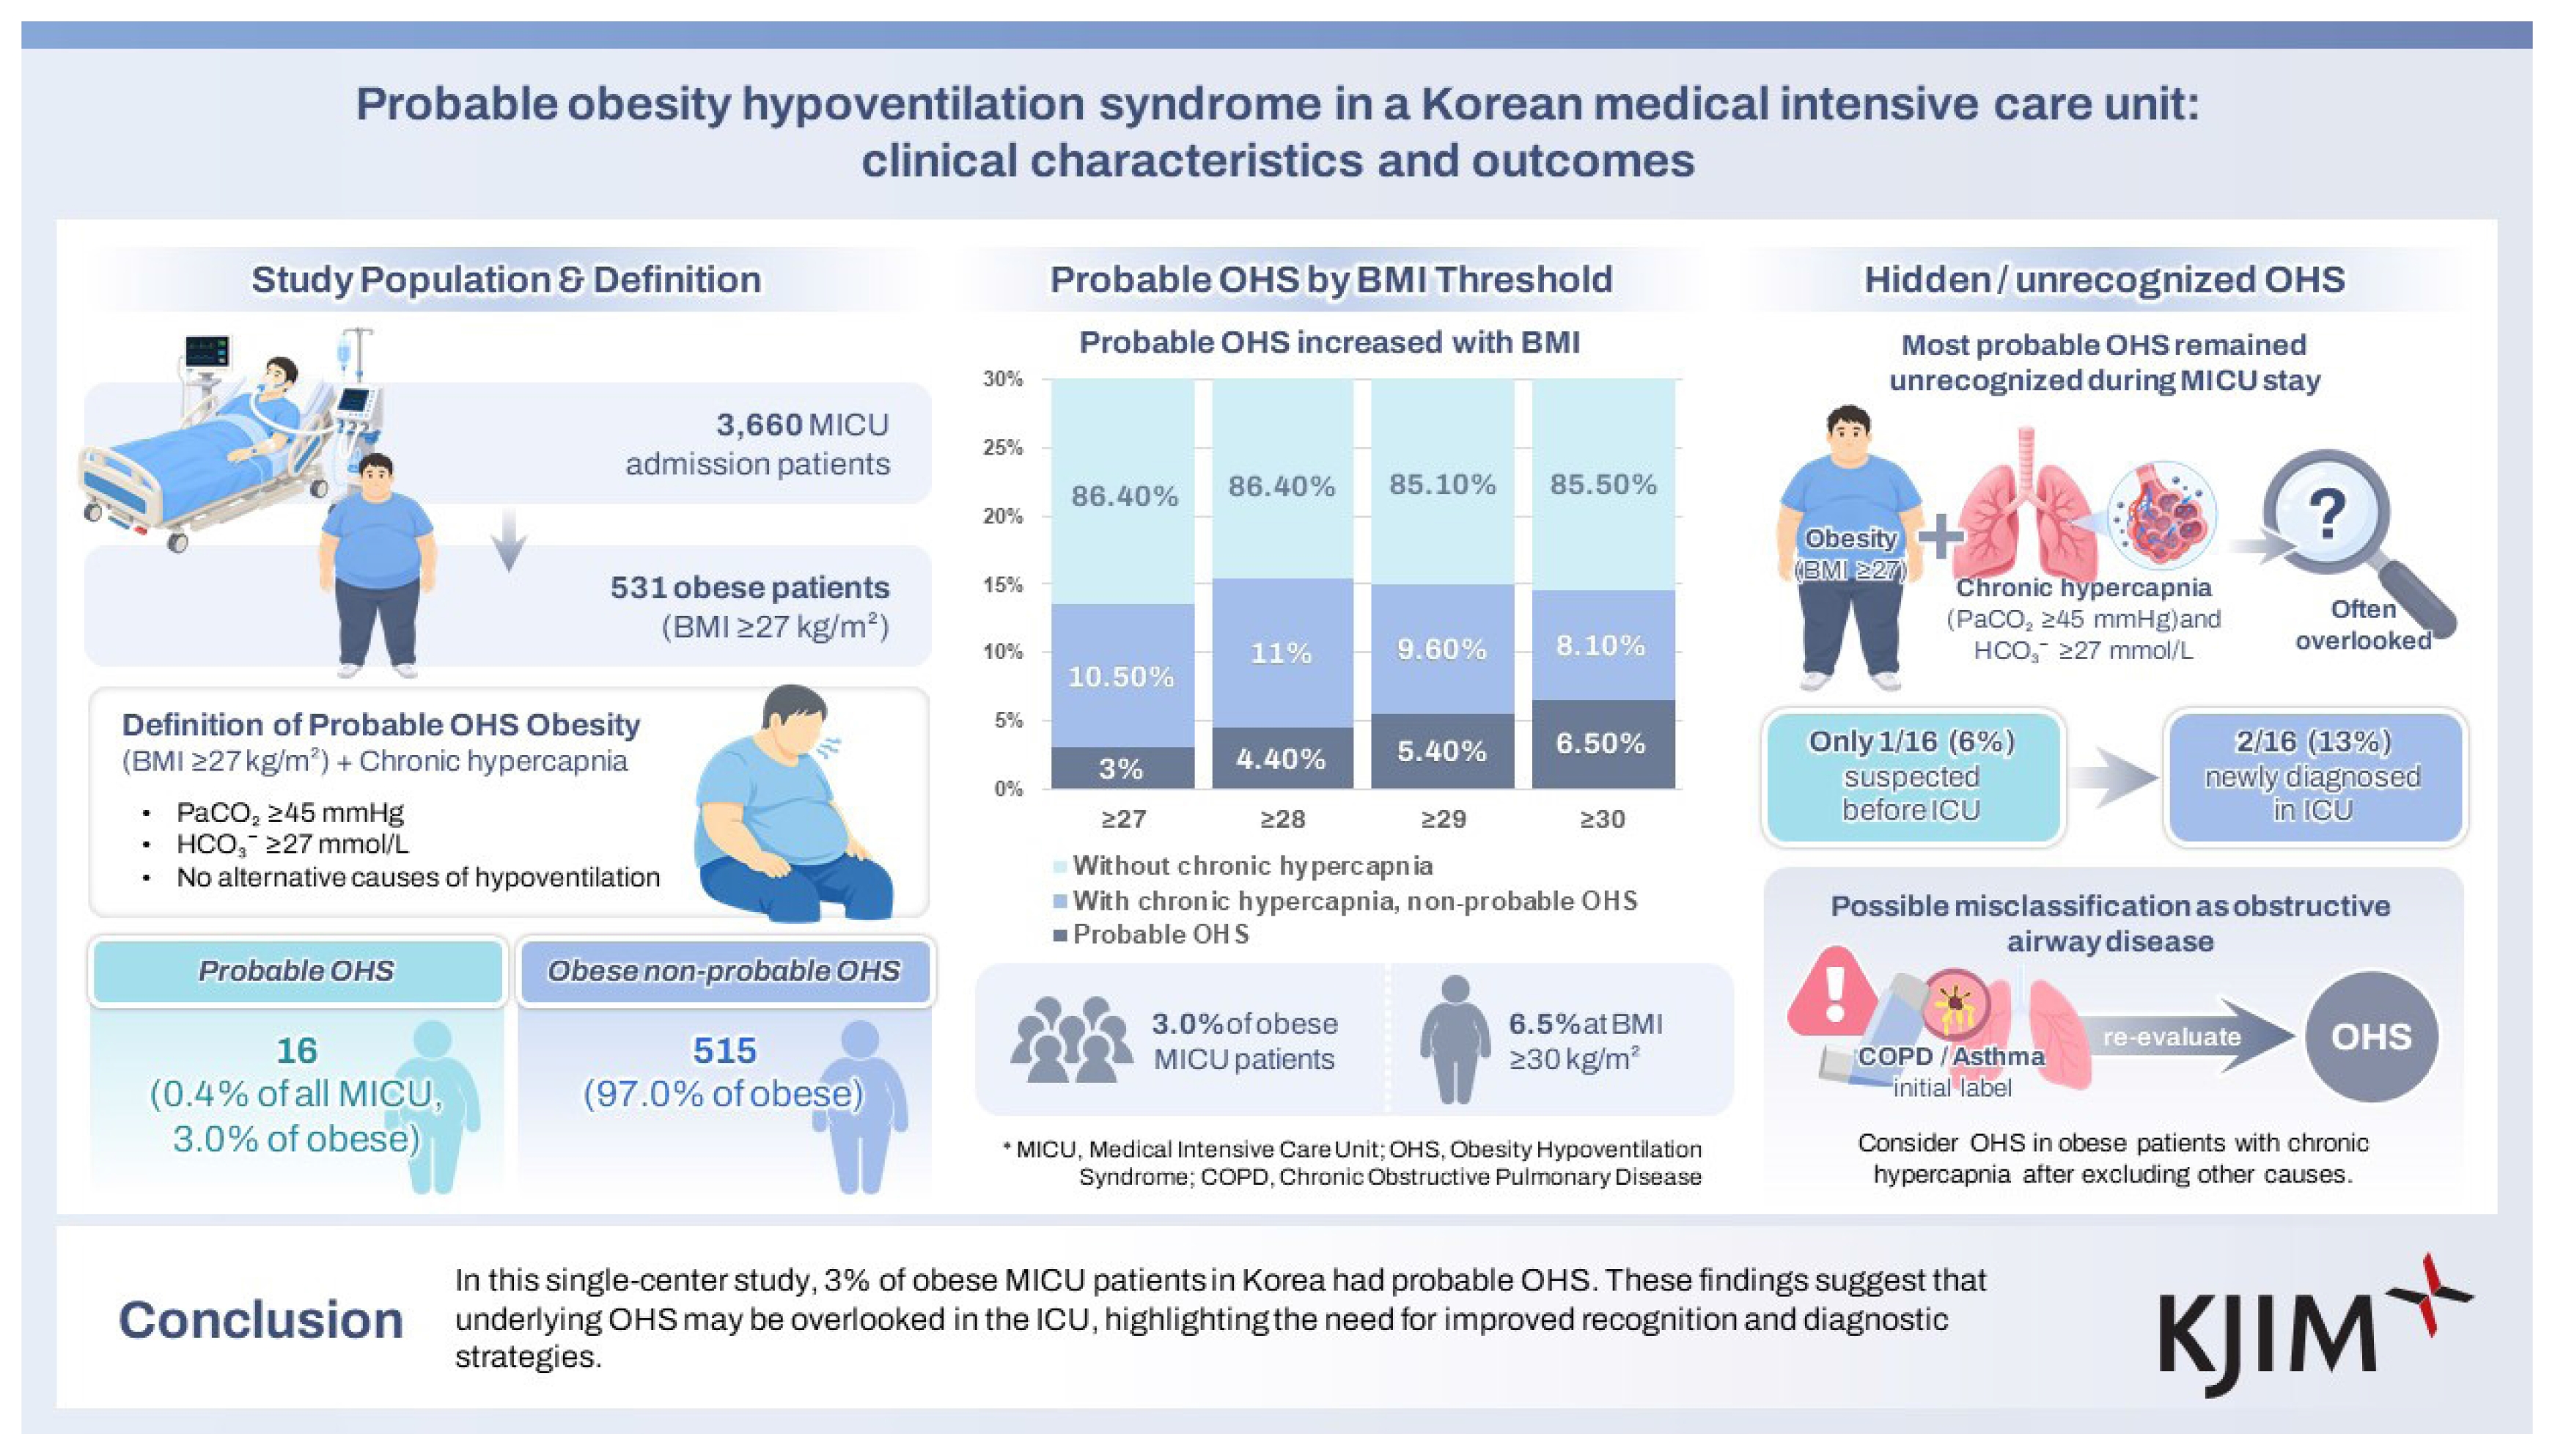
Among 3,660 MICU admissions, 531 patients (14.5%) were obese. The proportion of probable OHS was 0.4% (16/3,660) overall, 3.0% (16/531) among obese patients, and 6.5% (12/186) at BMI ≥ 30 kg/m2. Obstructive airway disease was more prevalent in the probable OHS group. Most patients meeting probable OHS criteria went unrecognized during their stay in the MICU. Patients with probable OHS tended to have longer hospital stays (40 vs. 24 days, p = 0.083), despite lower illness severity at admission. Although unadjusted mortality was lower in the probable OHS group, IPTW-adjusted analyses showed no significant differences in in-hospital or 90-day mortality.
Conclusions
This single-center study found that 3% of obese MICU patients had probable OHS. These findings suggest that underlying OHS may be overlooked in the ICU, highlighting the need for improved recognition and diagnostic strategies.
INTRODUCTION
Obesity is one of the major health problems, with its prevalence continuing to increase worldwide [1]. In South Korea, the prevalence of obesity—defined as a body mass index (BMI) ≥ 25 kg/m2 based on the Asia-Pacific criteria of the World Health Organization (WHO) guidelines [2]—has increased gradually, from 30.2% in 2012 to 38.4% in 2021 [3]. Pathophysiologically, obesity restricts the movement of the diaphragm and chest wall, reduces functional residual capacity, and potentially may lead to chronic hypoventilation and hypercapnia. In patients with more severe obesity, these mechanisms interact in a complex manner, resulting in obesity hypoventilation syndrome (OHS) [4].
OHS is a disease characterized by obesity (BMI ≥ 30 kg/ m2), awake daytime hypercapnia (PaCO2 ≥ 45 mmHg), and the exclusion of other causes of hypoventilation [5]. OHS requires clinical attention because it is associated with a high burden of morbidities. Patients with OHS are vulnerable to acute-on-chronic respiratory failure, which frequently results in emergency department visits and unplanned hospitalizations [6]. Once hospitalized, they are more likely to require intensive care unit (ICU) resources, including mechanical ventilation (MV), have longer hospital stays, and experience higher rates of cardiovascular complications such as heart failure and pulmonary hypertension [7]. Unfortunately, OHS remains largely undiagnosed and untreated, even in hospitalized patients, delaying or preventing appropriate management [8].
The estimated prevalence of OHS in the general adult population of the United States is approximately 0.4%. This value significantly increases to 8–20% among patients with obesity and sleep-disordered breathing [6]. In Western ICU cohorts, approximately 8–9% of critically ill patients meet the diagnostic criteria for OHS [8,9]. However, ICU-based research on OHS in Asian populations is scarce, which may result in underdiagnosis of OHS in these groups. Furthermore, compared with Western populations, Asians often develop obesity-related metabolic disorders at lower BMI levels, and craniofacial anatomy may increase the risk of sleep-disordered breathing [10,11]. Despite these factors suggesting a substantial burden of OHS, no studies have evaluated the clinical significance of OHS among critically ill patients in Korea. Therefore, we aimed to investigate the proportion, clinical characteristics, and ICU outcomes—including mortality, MV use, and length of stay—of patients with OHS admitted to the medical ICU (MICU) of a tertiary hospital in Korea.
METHODS
Study population
This single-center, retrospective cohort study included adult obese patients (aged ≥ 19 years) admitted to the MICU at Seoul National University Hospital (SNUH) between January 1, 2016, and December 31, 2023. The index MICU admission was defined as the first MICU admission for each patient during the study period. Obesity was operationally defined as a BMI ≥ 27 kg/m2 [12], based on the criterion suggested by the National Health Insurance Service of Korea [13]. Chronic hypercapnia was defined as an arterial PaCO2 ≥ 45 mmHg and a bicarbonate level ≥ 27 mmol/L [5]. These values were obtained from arterial blood gas analysis (ABGA) conducted within two days before or on the day of the index MICU admission and were used as surrogates for awake daytime hypercapnia.
Patients were classified as having probable OHS if they had obesity and chronic hypercapnia, provided there was no alternative etiology of hypoventilation. Alternative etiologies of hypoventilation were classified as follows [6,8]: (1) severe parenchymal lung disease, such as extensive interstitial lung disease or severe infection; (2) severe airway disease characterized by forced expiratory volume in 1 second (FEV1)/ forced vital capacity (FVC) < 0.70 and FEV1 < 50% of the predicted value on spirometry conducted within ± 3 years of the index MICU admission; (3) severe chest wall disorders (e.g., kyphosis); (4) neuromuscular disorders; (5) severe hypothyroidism; and (6) central hypoventilation.
Variables and data collection
Clinical and laboratory data were collected relative to the date of the index MICU admission. Clinical characteristics recorded included age, sex, BMI (measured within 0 to +2 days of admission), smoking history, and the number of previous hospital admissions. Comorbidities were identified using the International Classification of Diseases, 10th Revision (ICD-10) codes, which included hypertension (I10–I13, I15), coronary artery disease (I20–I25), ischemic stroke (I63–I64), congestive heart failure (I50), atrial fibrillation (I48), type 2 diabetes mellitus (E11–E14), dyslipidemia (E78), gastroesophageal reflux disease (K21), chronic kidney disease (N18–N19, Z49, Z94.0, Z99.2), chronic obstructive pulmonary disease (COPD; J44), asthma (J45), depression (F32–F33), and cancer (C00–C97). The use of inhaled medications was assessed during the 180 days preceding the index MICU admission. In addition, results of pulmonary function tests conducted within ± 3 years and polysomnography performed at any time were examined. Clinical documentation was reviewed to ascertain any prior suspicion or diagnosis of OHS, prior diagnosis of obstructive sleep apnea (OSA), and use of positive airway pressure (PAP) therapy before the index MICU admission. Data regarding the admission route, reasons for ICU admission (e.g., respiratory, cardiac, or sepsis/septic shock), and severity scores, including the Acute Physiology and Chronic Health Evaluation II (APACHE II) and Sequential Organ Failure Assessment (SOFA), were also collected. Laboratory data, other than ABGAs, were obtained from blood tests performed within 0 to +2 days of MICU admission.
We assessed whether OHS had been clinically suspected before the index MICU admission or was newly recognized during the index hospitalization among patients who met the study-defined probable OHS criteria. We also investigated whether PAP therapy was initiated during hospitalization, and whether it was used during follow-up. Other clinical outcomes included in-ICU, in-hospital, and 90-day mortality, as well as the development of acute respiratory distress syndrome (ARDS), in-ICU cardiopulmonary resuscitation, use of continuous kidney replacement therapy (CKRT), MV, extracorporeal membrane oxygenation, tracheostomy, and oxygen delivery modality at ICU discharge. We also recorded ICU and hospital length of stay, as well as any ICU readmissions following the index MICU admission. ARDS was defined according to the Berlin criteria [14], and sepsis and septic shock were defined according to the Sepsis-3 criteria [15].
Statistical analysis
Categorical variables are expressed as numbers (%), and continuous variables as means ± standard deviations or medians (interquartile ranges). Continuous variables were compared using the Mann–Whitney U-test and categorical variables using Fisher’s exact test. To illustrate how the proportions varied according to the BMI threshold, we performed a descriptive analysis across several BMI cutoffs (≥ 27, ≥ 28, ≥ 29, and ≥ 30 kg/m2). For each cutoff, we calculated the proportion of patients with chronic hypercapnia and the proportion meeting probable OHS criteria.
The Kaplan–Meier estimator was used to plot mortality rates, and the log-rank test was used to compare survival between the probable OHS and obese non-probable OHS groups. Inverse probability of treatment weighting (IPTW) was applied to improve baseline comparability between the two groups, targeting the average treatment effect on the treated [16]. Propensity scores were calculated using logistic regression, incorporating prespecified baseline covariates (i.e., age, sex, BMI, smoking status, number of previous hospital admissions, and comorbidities, including hypertension, coronary artery disease, ischemic stroke, congestive heart failure, atrial fibrillation, type 2 diabetes mellitus, dyslipidemia, gastroesophageal reflux disease, chronic kidney disease, COPD, asthma, depression, and cancer). In addition, weights were truncated at the 1st and 99th percentiles. In the weighted sample, logistic regression models assessed both in-hospital and 90-day mortality, with results reported as odds ratios (ORs) with 95% confidence intervals (CIs). The primary model exclusively included probable OHS status, and a secondary model additionally adjusted for the APACHE II score at ICU admission. All statistical analyses were performed using R software (version 4.4.3; R Foundation for Statistical Computing, Vienna, Austria).
The study was approved by the Institutional Review Board of SNUH (No. 2408-064-1559; approved August 12, 2024) and was conducted in accordance with the Helsinki Declaration as revised in 2024. The requirement for informed consent was waived because of the retrospective nature of the study. The study adheres to the Strengthening the Reporting of Observational Studies in Epidemiology (STROBE) guidelines for observational research [17].
RESULTS
Proportion of probable OHS
A total of 3,660 patients were admitted to the MICU at SNUH during the study period. Of these, 69 patients without BMI data and 3,060 patients with a BMI < 27 kg/m2 were excluded, leaving 531 patients (14.5%) classified as having obesity. Among them, 72 patients met the criteria for chronic hypercapnia. Of these 72 patients, 56 were reclassified into the obese non-probable OHS group due to other potential causes of hypoventilation, including severe airway disease (n = 34), severe parenchymal lung disease (n = 18), severe kyphosis (n = 2), neuromuscular disorder (n = 1), and central hypoventilation (n = 1). Consequently, 16 patients were classified as having probable OHS, while the remaining 515 patients were classified as obese without probable OHS (Fig. 1).
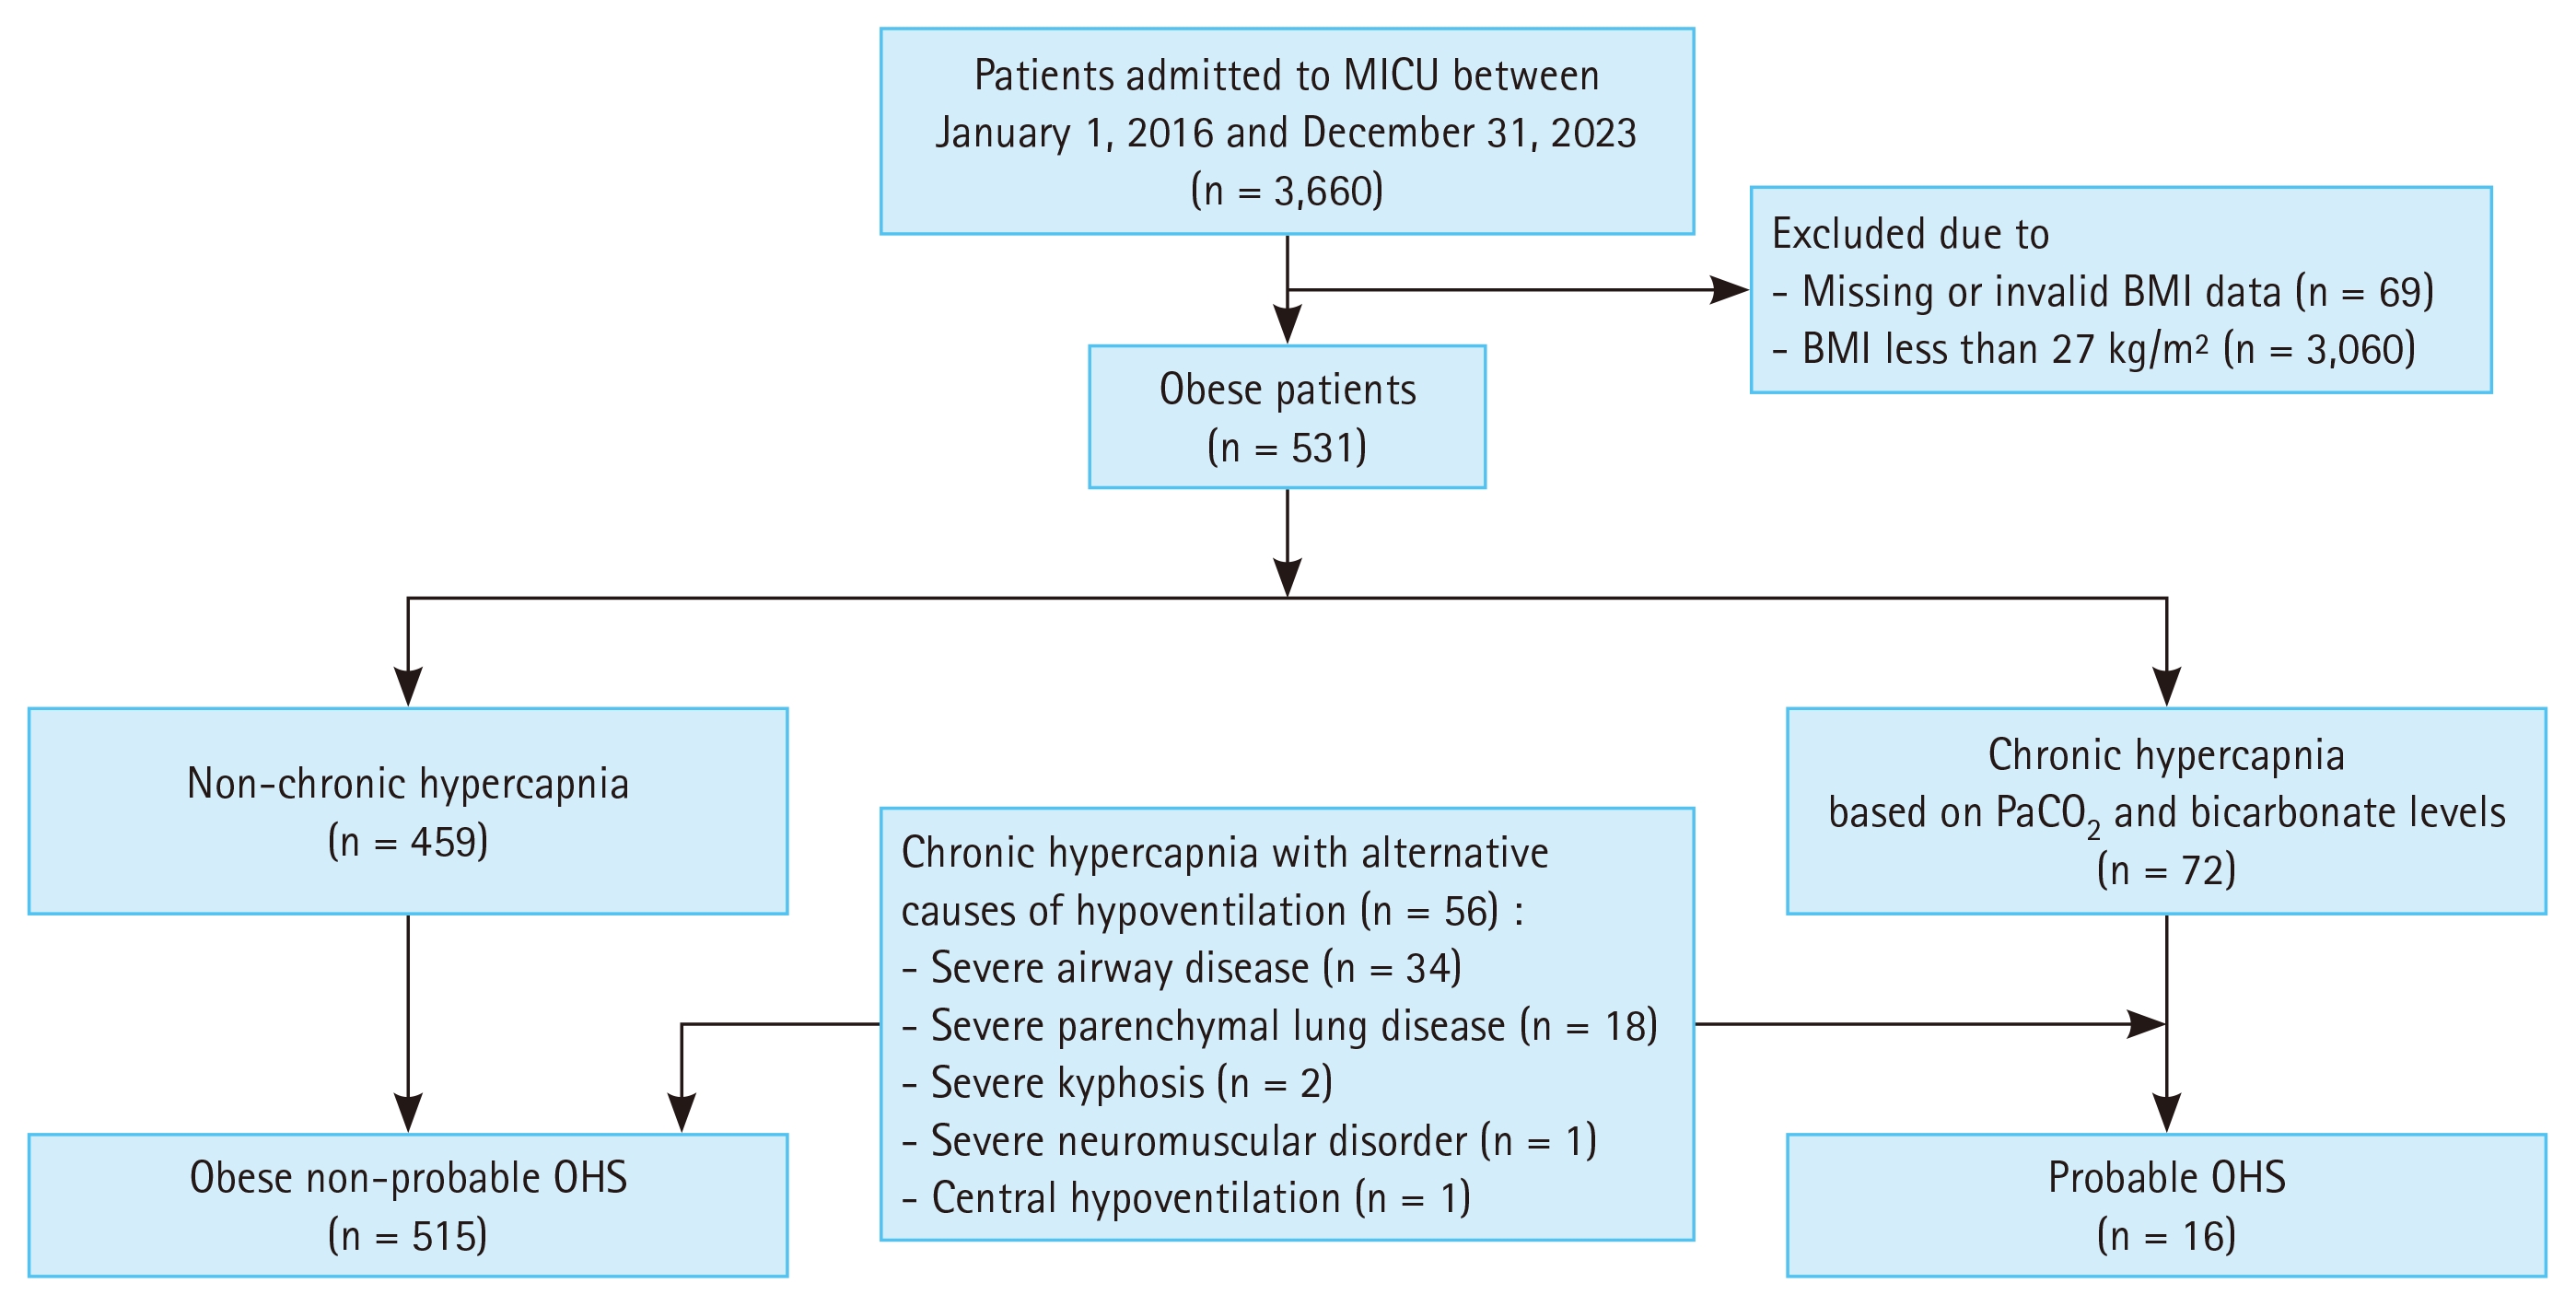
Flow chart of the study. MICU, medical intensive care unit; BMI, body mass index; OHS, obesity hypoventilation syndrome.
The proportion of patients meeting the criteria for probable OHS increased with higher BMI thresholds. Of the 531 patients with a BMI ≥ 27 kg/m2, 3.0% met the criteria for probable OHS. This proportion gradually increased to 4.4% (16/364) for BMI ≥ 28 kg/m2, 5.4% (14/261) for BMI ≥ 29 kg/m2, and 6.5% (12/186) for BMI ≥ 30 kg/m2 (Fig. 2).
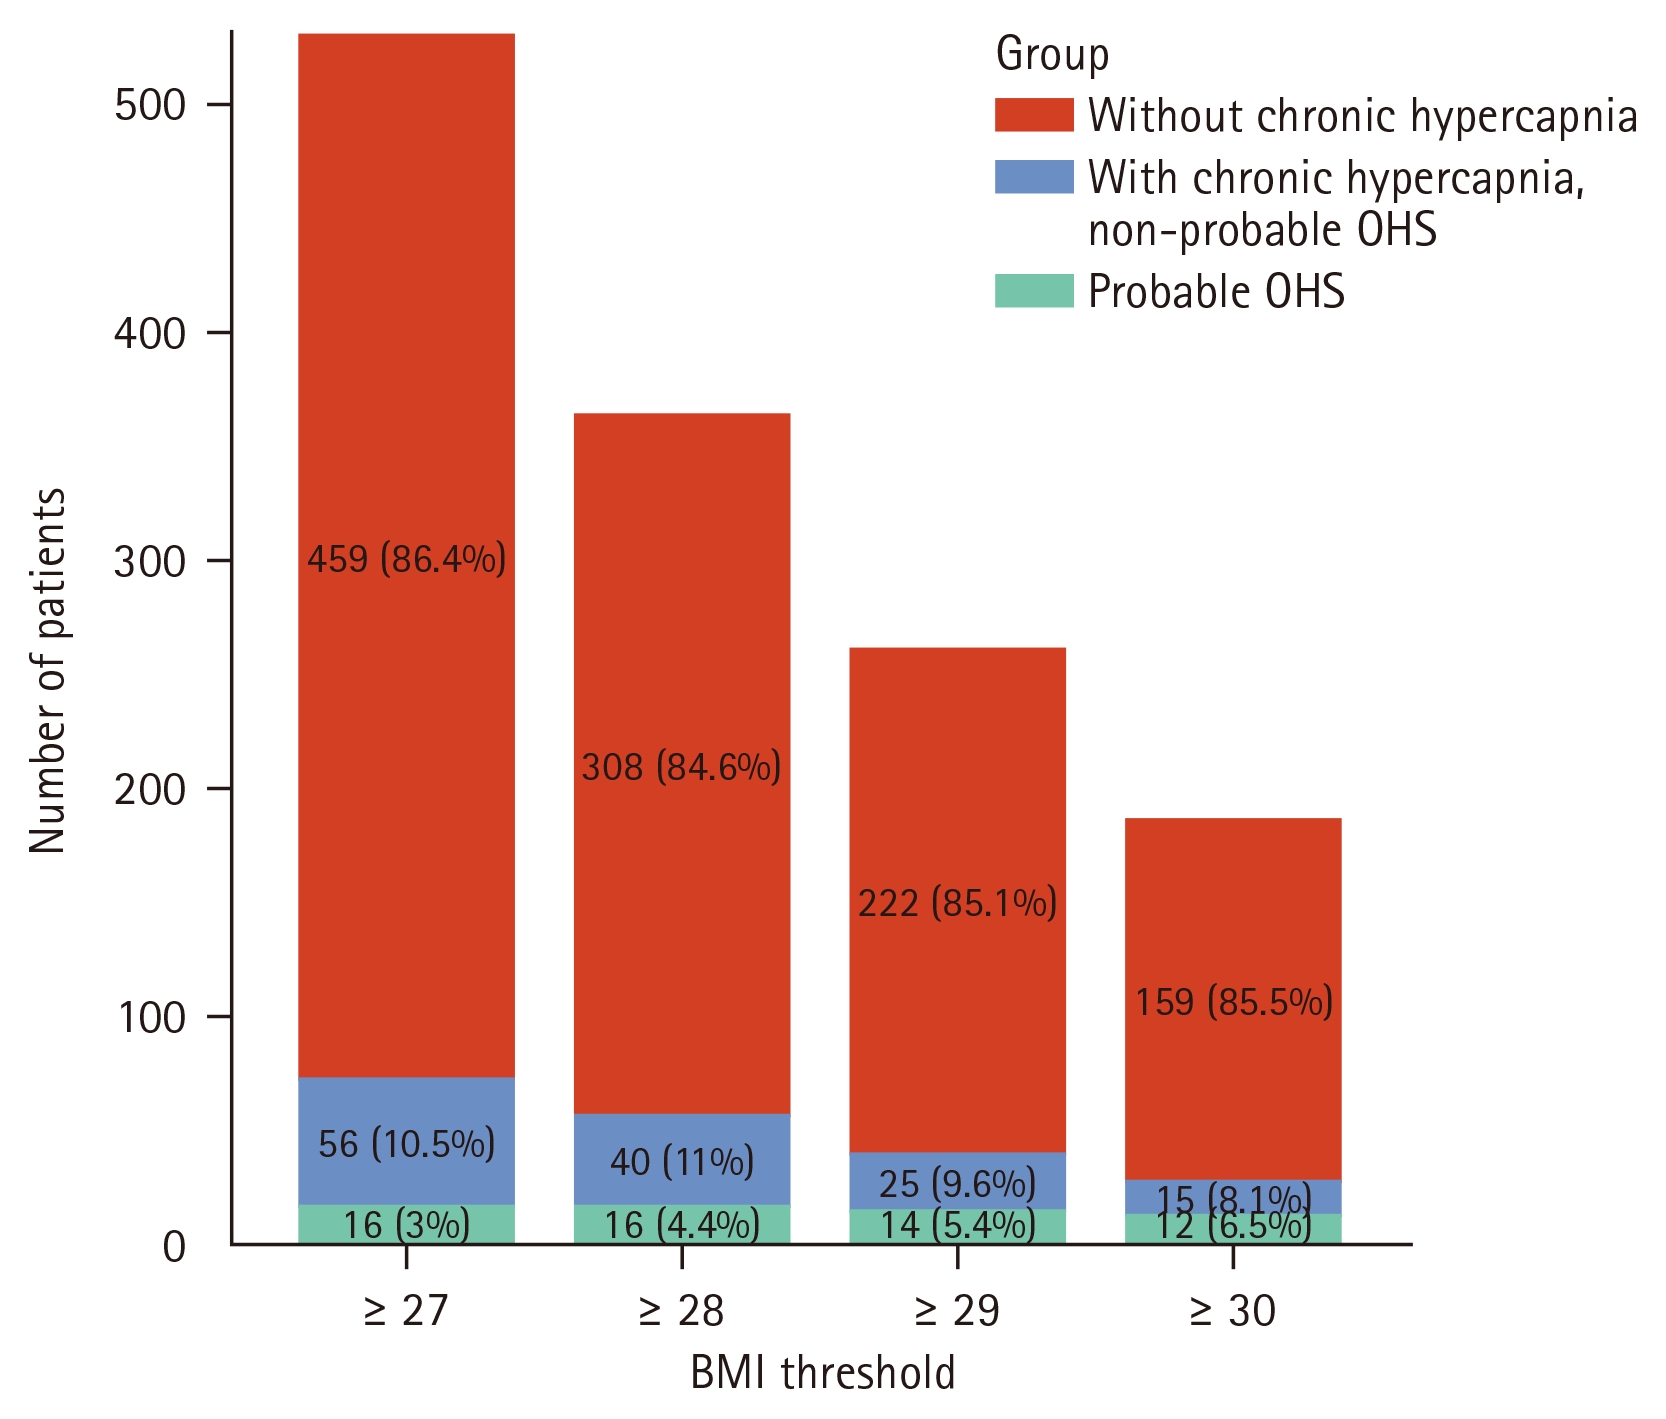
Proportion of probable OHS and chronic hypercapnia by BMI thresholds. BMI, body mass index; OHS, obesity hypoventilation syndrome.
Clinical characteristics
Table 1 presents the baseline characteristics of the study population according to probable OHS status. Among 531 obese patients with a BMI ≥ 27 kg/m2, 61.2% were male, and the median age was 65 years. Patients with probable OHS had a significantly higher BMI than obese patients without probable OHS (median 34.0 vs. 28.9 kg/m2, p < 0.001). Hypertension, type 2 diabetes mellitus, congestive heart failure, and gastroesophageal reflux disease were more prevalent in the probable OHS group, whereas a history of cancer was less common compared with the obese non-probable OHS group. The diagnosis of obstructive airway disease (such as COPD or asthma) based on ICD-10 codes was more frequent in the probable OHS group than in the obese non-probable OHS group (31.3% [5/16] vs. 10.7% [55/515], p = 0.026). However, when obstructive airway disease was defined more stringently, requiring both the presence of ICD-10 codes and the use of maintenance inhaler therapy (long-acting bronchodilators or inhaled corticosteroids), the proportions decreased: 25.0% (4/16) in the probable OHS group and 5.8% (30/515) in the obese non-probable OHS group (p = 0.015).
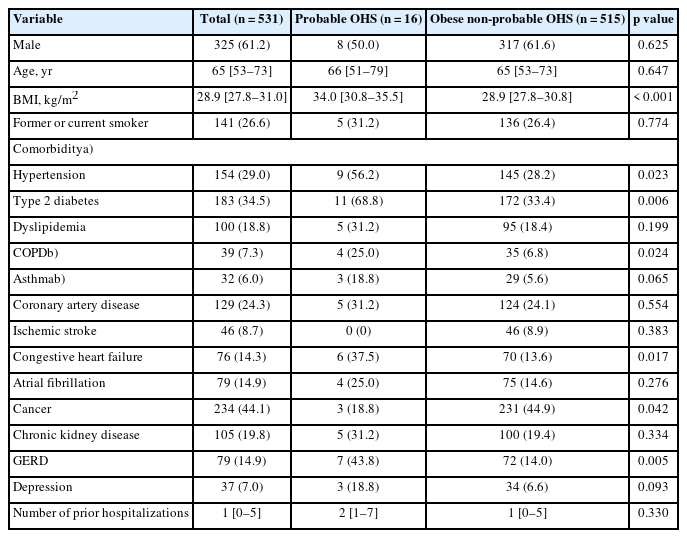
Baseline characteristics according to probable OHS status
Spirometry results were obtained for 11 patients (68.8%) in the probable OHS group and 222 patients (43.1%) in the obese non-probable OHS group. The probable OHS group exhibited lower FEV1 and FVC values, whereas FEV1/FVC ratios were comparable across the two groups (FEV1: 1.4 [1.2–1.5] vs. 2.1 [1.5–2.7] L; FEV1 % predicted: 64.0 [56.5–68.0] vs. 88.0 [68.0–103.0]; FVC: 1.8 [1.6–2.0] vs. 2.9 [2.1–3.6] L; FVC % predicted: 59.0 [56.0–65.0] vs. 84.0 [69.0–97.8]; FEV1/FVC: 79.0 [67.5–83.5] vs. 75.0 [70.0–81.0]). Polysomnography was performed in 4 patients (25%) in the probable OHS group and 17 patients (3.3%) in the obese non-probable OHS group. Among those who underwent polysomnography, the mean apnea-hypopnea index (AHI) was 45.9 ± 27.4 events/h in the probable OHS group, with 75% classified as having moderate-to-severe OSA (AHI ≥ 15 events/h). In the obese patients without probable OHS, the mean AHI was 37.0 ± 33.7 events/h, with 58.8% exhibiting moderate-to-severe OSA.
At the time of ICU admission, the APACHE II score was significantly lower in the probable OHS group (17 [14–20] vs. 20 [15–29], p = 0.029; Table 2). Respiratory failure was the most common reason for ICU admission in the probable OHS group, accounting for 81.2% of patients.
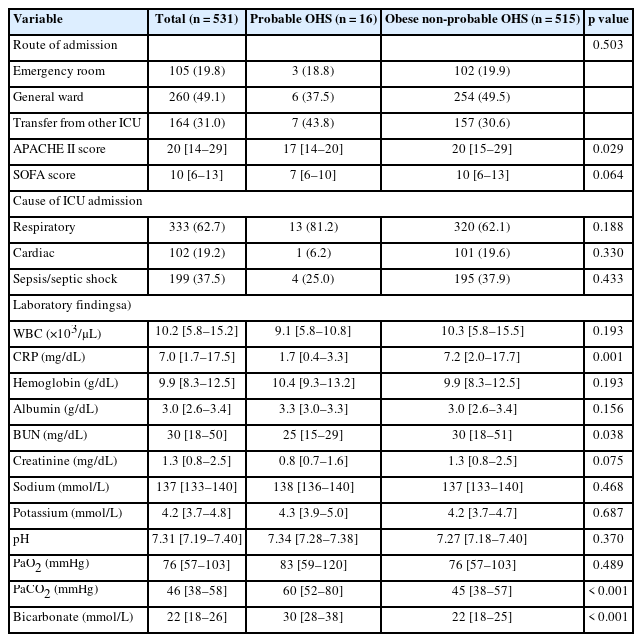
Clinical presentation at ICU admission according to probable OHS status
ICU and post-discharge outcomes
During ICU stay, patients with probable OHS had significantly lower rates of ARDS (6.2% vs. 29.3%, p = 0.049) and CKRT use (6.2% vs. 42.1%, p = 0.003) compared with patients without probable OHS (Table 3). There were no significant differences between the groups in the use of MV or tracheostomy. Although not statistically significant, the use of high-flow nasal cannula at ICU discharge was numerically higher in the probable OHS group (43.8% vs. 26.4%). While ICU length of stay did not differ significantly between groups (median 8 [3–17] vs. 6 [3–12] days, p = 0.451), total hospital length of stay tended to be longer in the probable OHS group compared with the obese non-probable OHS group (40 [18–69] vs. 24 [12–45] days, p = 0.083).
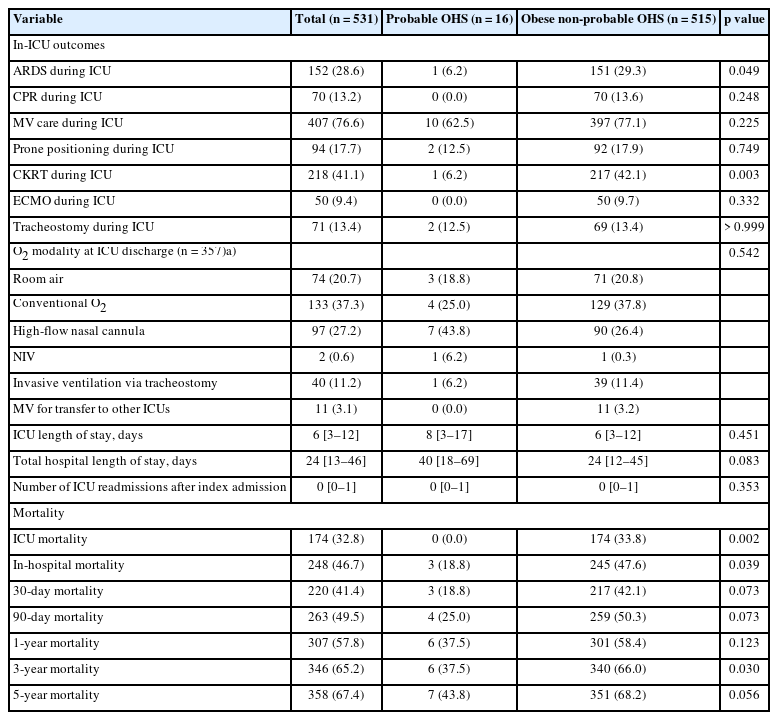
In-ICU, hospital, and long-term outcomes according to probable OHS status
Of the 16 patients meeting probable OHS criteria in this study, only one had a suspected diagnosis before the index MICU admission. This patient had initiated continuous PAP (CPAP) therapy four years earlier but discontinued it due to poor adherence. Following the index MICU admission, the patient was discharged without PAP; however, five years later, the patient presented with acute-on-chronic respiratory failure requiring noninvasive ventilation (NIV). Of two patients receiving CPAP therapy for OSA at the time of admission, one underwent tracheostomy and was prescribed bilevel PAP. Two additional patients were newly diagnosed with OHS during the index admission, with one initiating CPAP and the other not receiving PAP therapy despite suspicion of OHS. Of two other patients unrecognized as having OHS during the index admission, one received NIV for chronic hypercapnia and the other underwent tracheostomy.
Mortality
There were no ICU mortalities among patients in the probable OHS group, and in-hospital mortality was significantly lower than in the obese non-probable OHS group (18.8% vs. 47.6%, p = 0.039). Figure 3 shows the Kaplan–Meier survival curves according to probable OHS status, demonstrating better long-term survival in patients with probable OHS over 4.9 (3.2–6.9) years of follow-up (log-rank p = 0.034).
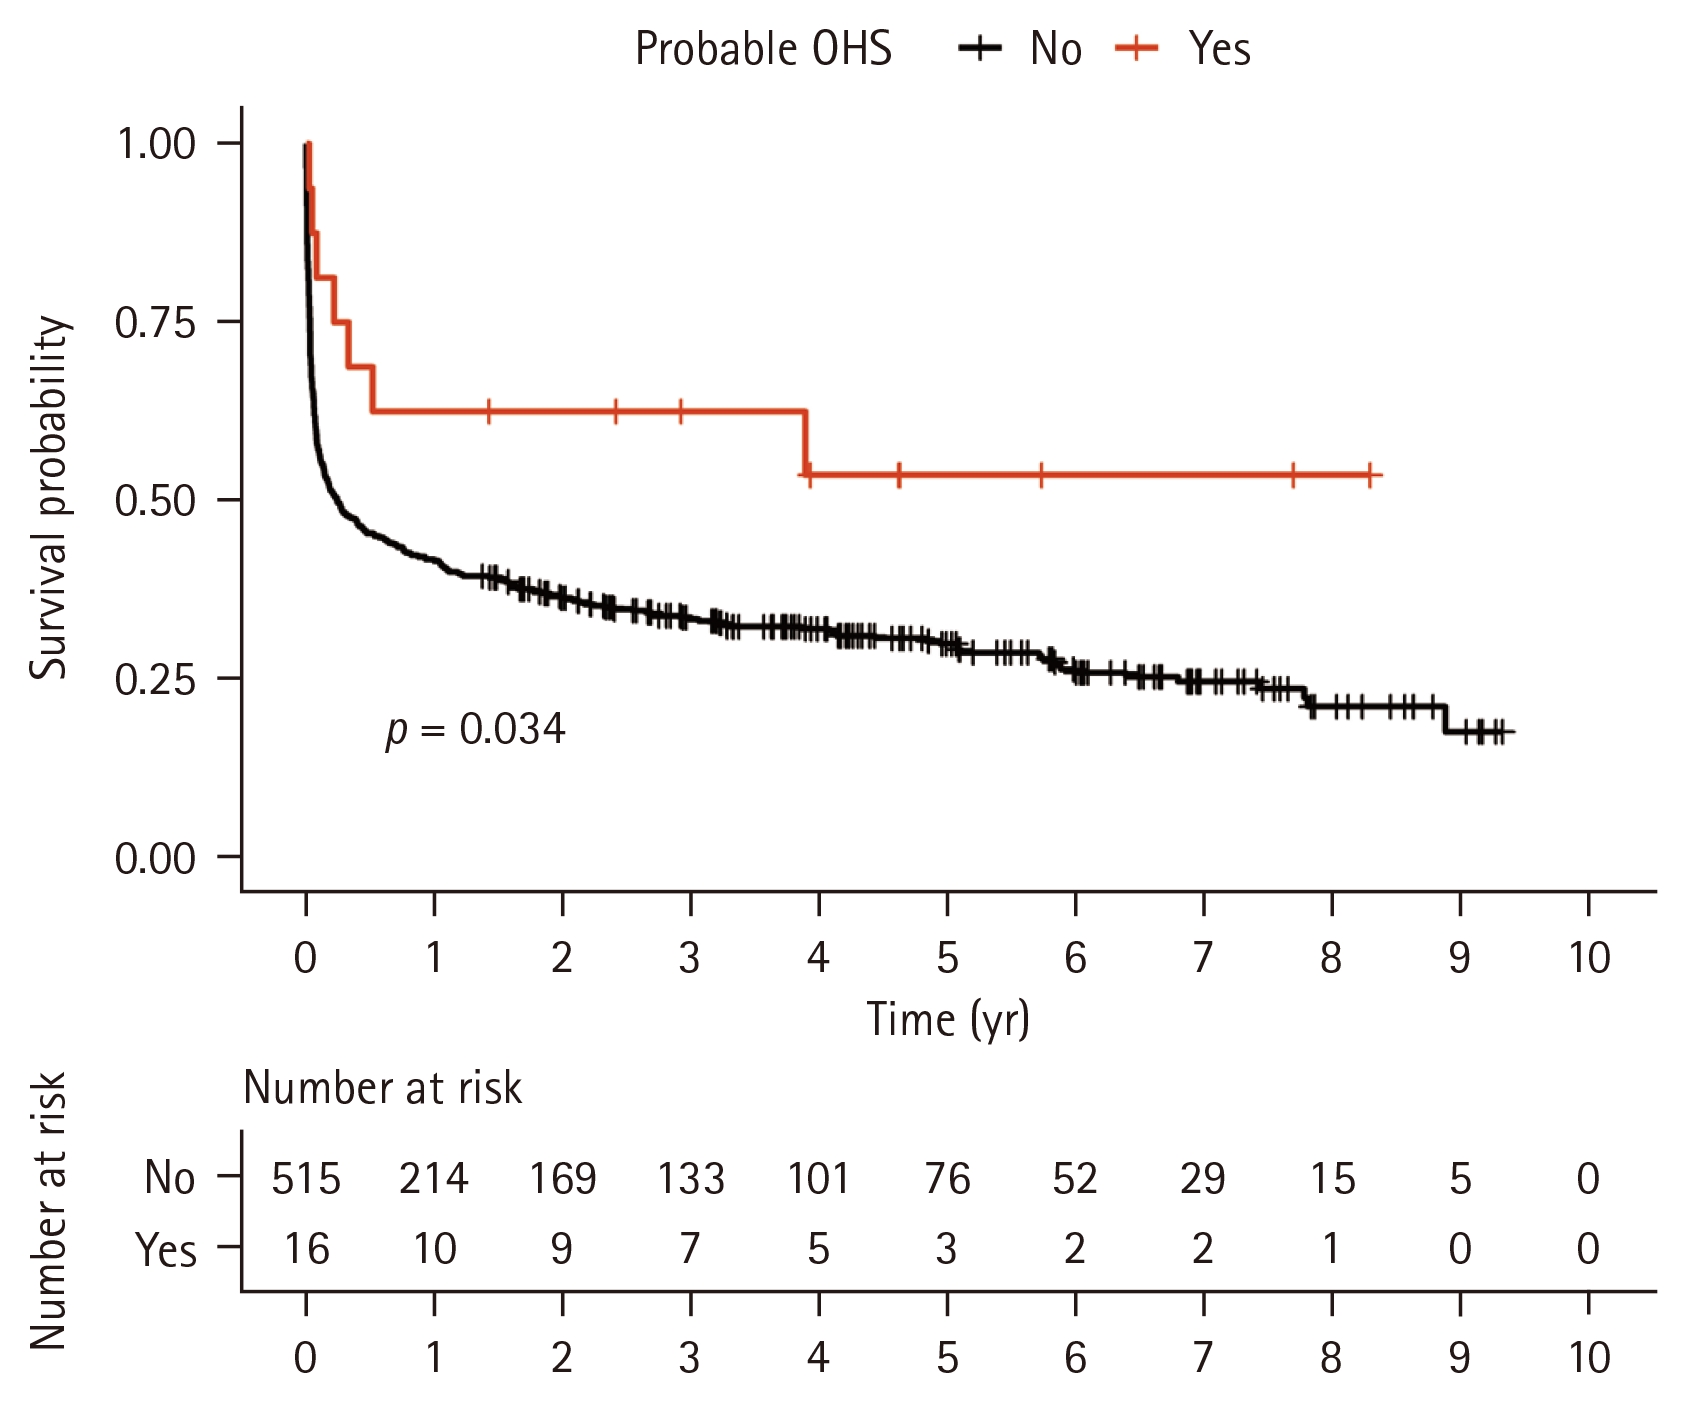
Kaplan–Meier survival curves for overall survival according to probable OHS status. OHS, obesity hypoventilation syndrome.
To adjust for baseline differences between the probable OHS and obese non-probable OHS groups before the index MICU admission, IPTW was applied. After weighting, overall covariate balance improved between the two groups (Supplementary Table 1). The clinical presentation at ICU admission following IPTW adjustment is presented in Supplementary Table 2. Both in-hospital and 90-day mortality were not significantly different between the probable OHS and obese non-probable OHS groups in either the crude IPTW-weighted model (in-hospital mortality: OR 0.36 [95% CI 0.09–1.40], p = 0.139; 90-day mortality: OR 0.42 [95% CI 0.12–1.46], p = 0.173) or the APACHE II–adjusted model (in-hospital mortality: OR 0.67 [95% CI 0.14–3.21], p = 0.620; 90-day mortality: OR 0.78 [95% CI 0.19–3.22], p = 0.727) (Table 4).
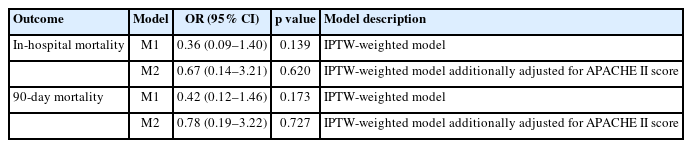
Association of probable OHS with in-hospital and 90-day mortality using IPTW-weighted logistic regression
DISCUSSION
This study evaluated the proportion of patients in the ICU who met the criteria for probable OHS using BMI thresholds relevant to Korean populations and assessed the recognition, hospital course, and outcomes of these patients compared with those of obese patients without probable OHS. Using a BMI threshold of 27 kg/m2, we found that 0.4% (16/3,660) of all MICU admissions and 3% of obese MICU patients met the probable OHS criteria. The proportion of probable OHS increased with higher BMI thresholds, reaching 6.5% at a BMI cutoff of 30 kg/m2. Nevertheless, many patients who met the criteria for probable OHS were not recognized as having the condition during their stay in the MICU. Additionally, patients with probable OHS tended to have longer hospital stays despite having a lower severity of critical illness at ICU admission. While unadjusted analyses showed lower mortality in the probable OHS group, in-hospital and 90-day mortality did not differ between the probable OHS and obese non-probable OHS groups after adjusting for baseline differences using IPTW.
While Western studies typically define obesity for OHS as BMI ≥ 30 kg/m2 [18], applying this threshold universally may not accurately reflect the clinical burden in Asian populations. Previous studies have shown that, at a given BMI, Asian populations tend to have a higher proportion of visceral and overall body fat compared with Western populations [10]. This increased adiposity may lead to chronic hyperleptinemia and subsequent leptin resistance, resulting in reduced ventilatory drive and a depressed hypercapnic ventilatory response [19]. Consequently, obesity-associated sleep hypoventilation may occur at relatively lower BMI levels. In addition, craniofacial morphology may contribute to structural narrowing of the upper airway, promoting sleep-disordered breathing and further exacerbating hypoventilation [11]. Therefore, although Korean guidelines often define obesity as BMI ≥ 25 kg/m2 based on the Asia-Pacific criteria of the WHO guidelines [2], a significant disparity remains as the global OHS definition continues to rely on the BMI ≥ 30 kg/m2 threshold regardless of ethnicity.
To address this, we operationally defined obesity using a BMI threshold of ≥ 27 kg/m2 as our primary cutoff. Evidence suggests that the risk of cardiometabolic diseases, including hypertension, diabetes mellitus, dyslipidemia, and cardiovascular disease, increases significantly from a BMI of approximately 27 kg/m2 in the Korean population [13]. This is consistent with the WHO Expert Consultation, which suggested a BMI of 27.5 kg/m2 as an additional action point for Asian populations and recommended that countries adopt cutoffs suited to local risk profiles [10]; for example, China has used BMI ≥ 28 kg/m2 to define obesity [20]. Accordingly, we used BMI ≥ 27 kg/m2 as a practical threshold to identify a high-risk obese MICU population in Korea while also reporting estimates using BMI ≥ 30 kg/m2 to facilitate comparisons with prior OHS literature.
To date, most evidence on OHS comes from Western countries. Studies from the United States and Hungary reported that approximately 8–9% of ICU patients had OHS [8,9]. In contrast, ICU-based studies are scarce, with only a Taiwanese ICU study reported in abstract form [21]. In that prospective screening study, undiagnosed OHS was identified in 10 of 1,783 ICU admissions (0.56%) and in 10 of 185 patients with BMI ≥ 30 kg/m2 (5.4%), similar to our corresponding estimates (0.4% overall and 6.5% among patients with BMI ≥ 30 kg/m2). Outside the ICU setting, existing evidence from East Asia is largely limited to Japanese outpatient or sleep-clinic cohorts. Akashiba et al. [22] analyzed 611 patients with moderate-to-severe OSA from seven sleep centers in Japan and reported an OHS prevalence of 9%. Similarly, Harada et al. [23] reported an OHS prevalence of 2.3% among patients with OSA (AHI ≥ 5 events/h) and 12.3% among those with obese OSA (BMI ≥ 30 kg/m2) in a study of 981 consecutive patients with suspected OSA.
The fact that most patients meeting the criteria for probable OHS were not recognized as such even after being admitted to the MICU highlights the significant clinical challenges involved in identifying this condition in an acute care setting. In our cohort, only one patient had a known diagnosis of OHS before MICU admission, and only two additional patients were newly diagnosed during the index admission. Consequently, even patients with obesity and chronic hypercapnia are often initially misclassified as having airway disease or obesity-related dyspnea, rather than being evaluated for underlying OHS. Approximately one-third of patients with probable OHS had a prior diagnosis of airway disease (COPD or asthma), and maintenance inhaler use was more common in the probable OHS group than in the obese non-probable OHS group. This pattern suggests that, in obese patients with chronic hypercapnia presenting with dyspnea, symptoms may be attributed to asthma or COPD, leading to a focus on inhaler optimization while underlying OHS or sleep-related hypoventilation remains unaddressed. Similar misclassification has been reported in ICU-based cohorts [8], and clinical practice guidelines note that delayed recognition and misdiagnosis are common in OHS [5]. Therefore, in patients with obesity—particularly those with chronic hypercapnia—evaluation for OHS and other sleep-related hypoventilation, including referral to sleep specialists for inpatient or outpatient sleep studies, should be considered alongside inhaler optimization.
Regarding outcomes, our IPTW-adjusted analysis showed no significant differences in in-hospital or 90-day mortality between the probable OHS and obese non-probable OHS groups. This finding is consistent with a Hungarian ICU cohort that compared patients suspected of having OHS with those without OHS risk factors (OR 1.27; 95% CI 0.79–2.03) [9]. However, in our study, hospital length of stay was numerically longer in the probable OHS group (median 40 vs. 24 days) despite lower acute severity at ICU admission, whereas ICU length of stay was similar between groups (median 8 vs. 6 days). This prolonged hospitalization likely reflects increased post-acute care needs, including optimization of PAP therapy, oxygen weaning, management of cardiometabolic comorbidities, rehabilitation, and careful discharge planning to prevent readmission, as suggested by a prior ICU cohort study [24].
This study has several limitations. First, it was a retrospective cohort study conducted at a single tertiary hospital with a relatively small sample size, which limits generalizability and statistical power. This limitation is particularly relevant for mortality outcomes, given the low number of events. Second, as is inherent in any retrospective analysis, unmeasured confounding is possible, and some variables were missing or not collected at uniform time points. Although IPTW was used to balance measured baseline characteristics between the groups, residual confounding may still exist. Third, we operationally defined obesity as a BMI of ≥ 27 kg/ m2, rather than the conventional BMI of ≥ 30 kg/m2 used in the standard diagnostic definition of OHS. Although this reflects the regional cardiometabolic risk profile, this adjustment was not intended to replace established diagnostic standards and could lead to misclassification. Fourth, arterial PaCO2 and bicarbonate levels measured close to MICU admission were used as surrogates for awake daytime hypercapnia. However, this approach may be limited in critically ill patients with concurrent metabolic acidosis or mixed acid–base disorders, where bicarbonate levels may be normal despite the presence of underlying OHS, which could lead to under-recognition in our cohort. Despite these limitations, our study provides real-world data on patients with probable OHS in a tertiary hospital in Korea and identifies critical gaps in its recognition and management. Large-scale, multicenter prospective studies are needed to validate our findings and refine diagnostic strategies for OHS in critical care settings.
In this single-center study, probable OHS accounted for 3% of obese patients admitted to the MICU in Korea and the condition was often unrecognized through discharge. Patients with probable OHS tended to have longer hospital stays despite lower acute illness severity at admission. These findings highlight the need for increased clinical awareness to identify this vulnerable population and optimize their long-term management after ICU discharge.
KEY MESSAGE
1. The proportion of probable OHS was 3.0% (BMI ≥ 27 kg/m2) and 6.5% (BMI ≥ 30 kg/m2) among obese patients in the MICU of a tertiary hospital in Korea.
2. Probable OHS patients had lower illness severity but tended to have longer hospital stays.
3. OHS may be misclassified as obstructive airway disease in hypercapnic obesity.
4. OHS was frequently unrecognized and remained undiagnosed at ICU discharge.
Notes
CRediT authorship contributions
Kyu Jin Lee: conceptualization, methodology, resources, investigation, data curation, formal analysis, software, writing - original draft, writing - review & editing, visualization; Hong Yeul Lee: resources, investigation, data curation, writing - review & editing, supervision; Jinwoo Lee: resources, investigation, data curation, writing - review & editing, supervision; Sang-Min Lee: resources, investigation, data curation, writing - review & editing, supervision; Jaeyoung Cho: conceptualization, methodology, investigation, validation, writing - original draft, writing - review & editing, supervision, project administration
Conflicts of interest
The authors disclose no conflicts.
Funding
None