Prognostic significance of artificial intelligence-quantified late gadolinium enhancement on cardiac magnetic resonance in hypertrophic cardiomyopathy
-
Young-Sang Jeong1, Jong-Il Park1, Kang-Un Choi1, Jong-Ho Nam1, Chan-Hee Lee1
 , Jang-Won Son1, Ung Kim1, Jong-Seon Park1, Eunjung Kong2
- Received February 9, 2026; Revised April 20, 2026; Accepted May 11, 2026;
- Abstract
-
- Background/Aims
- This study aimed to evaluate the prognostic value of artificial intelligence (AI)-based late gadolinium enhancement (LGE) quantification using cardiovascular magnetic resonance (CMR) in patients with hypertrophic cardiomyopathy (HCM).
- Methods
- We retrospectively analyzed 142 patients with HCM (mean age 58.5 ± 13.7 yr; 72.5% men) who underwent CMR at Yeungnam University Medical Center between 2015 and 2023. LGE was quantified using an AI-based segmentation algorithm with a 6-standard deviation method. Patients were stratified into a high LGE group (≥ 15%) and a low LGE group (< 15%). The primary outcome was a composite of cardiovascular death, including sudden cardiac death (SCD) and SCD-equivalent events.
- Results
- Over a median follow-up of 59 months, the high LGE group experienced a higher incidence of the primary outcome compared with the low LGE group (21.2% vs. 4.6%, p = 0.0067). After adjustment for age and left ventricular ejection fraction, a high AI-quantified LGE burden (≥ 15%) remained independently associated with the primary outcome (adjusted hazard ratio 4.67, 95% confidence interval 1.43–15.30, p = 0.011). Receiver operating characteristic analysis determined an optimal LGE cutoff of 8% for predicting the primary outcome (area under the curve 0.821). Patients with LGE ≥ 8% exhibited markedly increased rates of the primary outcome (18.2% vs. 0%, p < 0.001) and SCD/SCD-equivalent events (13.6% vs. 0%, p = 0.00074).
- Conclusions
- AI-based quantitative assessment of LGE is an independent predictor of adverse cardiovascular outcomes in patients with HCM and may represent a clinically meaningful imaging biomarker for risk stratification.
- Graphical abstract
- Graphical abstract
- INTRODUCTION
- INTRODUCTION
Hypertrophic cardiomyopathy (HCM) is a relatively prevalent inherited cardiomyopathy, affecting approximately 1 in 500 individuals in the general population [1,2]. In recent decades, advances in diagnostic and therapeutic strategies have markedly enhanced the management of HCM. Major society guidelines recommend implantable cardioverter-defibrillators (ICDs) for patients with high-risk features, as observational evidence has demonstrated their effectiveness in preventing sudden cardiac death (SCD) [3–5]. Despite this, cardiovascular complications, particularly SCD, remain a major cause of morbidity and mortality among patients with HCM, with observational studies reporting an annual SCD incidence of approximately 1%, especially in younger or high-risk patient groups [6,7].Cardiovascular magnetic resonance (CMR) with late gadolinium enhancement (LGE) enables the noninvasive evaluation of myocardial fibrosis, an arrhythmogenic substrate in HCM [8]. Numerous observational studies and meta-analyses consistently demonstrate a strong link between LGE extent and adverse outcomes, such as ventricular arrhythmias, SCD, and cardiovascular mortality [9–11]. In particular, an LGE burden of ≥ 15% of left ventricular mass has been identified as a threshold associated with an increased risk of composite events [12]. Accordingly, LGE has been established as a crucial imaging biomarker for SCD risk stratification in HCM.However, conventional LGE quantification techniques rely on manual or semiautomated delineation, which is time-consuming and prone to interobserver variability [13]. These limitations have restricted their wider adoption in routine practice. Recent advances in artificial intelligence (AI) have enabled automated segmentation and quantification of LGE, providing a faster, more reproducible, and standardized approach [14,15]. AI-based quantification may therefore augment the clinical utility of LGE for risk stratification in patients with HCM.Hence, this study aimed to evaluate the prognostic value of AI-based LGE quantification in a single-center cohort of patients with HCM. We specifically examined the relationship between AI-derived LGE extent and long-term cardiovascular outcomes and sought to identify an optimal threshold for risk stratification.
- METHODS
- METHODS
- Study population
- Study population
This retrospective cohort study enrolled patients who underwent cardiac PET-MR at Yeungnam University Medical Center between November 2015 and December 2023. A total of 184 patients underwent cardiac PET-MR for clinically suspected HCM, based on unexplained left ventricular wall thickening or other suggestive clinical features. Among them, 151 met the established diagnostic criteria for HCM. After excluding six patients with duplicate examinations and three with poor image quality due to magnetic resonance imaging (MRI) artifacts, a final cohort of 142 patients was included. Consistent with current guidelines [16], the patients were divided into two groups: low LGE group (LGE < 15%, n = 109) and high LGE group (LGE ≥ 15%, n = 33) (Fig. 1). The study protocol was approved by the Institutional Review Board of Yeungnam University Medical Center (IRB No.2025-10-021), and the requirement for informed consent was waived due to the retrospective nature of the study.- Imaging system
- Imaging system
Cardiac MRI was conducted on a 3.0-T integrated PET/MRI system (Biograph mMR; Siemens Healthcare, Erlangen, Germany). LGE images were acquired using an electrocardiographically gated, breath-hold, inversion-recovery-prepared turbo fast low-angle shot sequence with phase-sensitive reconstruction (PSIR). Imaging parameters included: repetition time 2.7–2.8 ms, echo time 1.1–1.2 ms, flip angle 40°, bandwidth 1,395 Hz/pixel, slice thickness 8 mm, and in-plane reconstructed resolution of 1.5 × 1.5 mm2. The inversion time (typically 400–450 ms) was individually optimized to nullify the normal myocardial signal. A gadolinium- based contrast agent (meglumine gadoterate, Dotarem; Guerbet, France) was administered intravenously at a dose of 0.2 mmol/kg body weight, and LGE imaging was performed 10–15 minutes post-contrast. Short-axis slices covering the entire left ventricle along with standard two-, three-, and four-chamber long-axis views were obtained.- CMR image analysis
- CMR image analysis
Post-processing of CMR images was performed using a commercially available deep learning-based software (Myomics; Phantomics Inc., Seoul, Korea). This tool has been validated in multicenter studies for automated cardiac MRI segmentation and quantitative mapping analyses [17,18]. Left ventricular epicardial and endocardial contours were automatically delineated on short-axis cine images from the base to the apex, excluding papillary muscles from the myocardial mass, and manually adjusted by an experienced operator (> 10 years of CMR expertise, blinded to clinical data). The software automatically selected a remote region of normal myocardium as a reference, which was reviewed visually by the operator and modified when necessary. LGE was defined as myocardial regions with signal intensity ≥ 6 standard deviations above the mean signal intensity of the reference myocardium. LGE volume and mass were then automatically quantified, and LGE extent was expressed as a percentage of the total left ventricular myocardial mass.Representative examples of AI-assisted myocardial fibrosis quantification are presented in Figure 2. Panels A and C demonstrate PSIR short-axis LGE images of patients with low and high fibrosis burden, respectively. Panels B and D depict AI-assisted quantification on the same images, including automated segmentation of the epicardial (green) and endocardial (red) borders with fibrosis regions (yellow) identified using the 6SD threshold method. This approach enables objective and reproducible quantification of myocardial fibrosis burden in HCM.- Reproducibility analysis
- Reproducibility analysis
To evaluate intraobserver reproducibility, the same observer repeated the LGE analysis in a random subset of 20 patients (~15% of the cohort) after a 2-week interval. The repeated measurements showed no apparent differences on descriptive review and were considered consistent. However, this repeat assessment was not designed as a formal reproducibility study, and repeated measurements were not systematically retained for statistical analysis. Therefore, formal reproducibility metrics, including intraclass correlation coefficients or Bland–Altman analysis, were not performed, and reproducibility was assessed descriptively.- Clinical outcomes and follow-up
- Clinical outcomes and follow-up
The primary outcome was a composite of cardiovascular death, including SCD, heart failure-related death, and cardiogenic shock-related death, as well as SCD-equivalent events (aborted SCD, sustained ventricular tachycardia/ventricular fibrillation, or appropriate ICD shock). The secondary outcome comprised the primary outcome plus all-cause mortality.For the analysis of SCD/SCD-equivalent events, patients who experienced nonarrhythmic cardiovascular death were censored at the time of death, as these events preclude subsequent arrhythmic events and were therefore not considered outcome events in this analysis.Follow-up data were collected retrospectively from electronic medical records. Patients were tracked from the date of the index CMR until the occurrence of study endpoints, death, or the final known follow-up, with a maximum censoring duration of 96 months.Baseline non-sustained ventricular tachycardia (NSVT) was defined as ≥ 3 consecutive ventricular beats at a rate of ≥ 120 beats per minute lasting < 30 seconds, identified on Holter monitoring or a ≥ 24-h ambulatory electrocardiogram (ECG) performed within 3 months before or after the index CMR and prior to any study endpoints. Because ambulatory ECG data were not uniformly available in all patients, NSVT analyses were limited to the subset with available data.- Statistical analysis
- Statistical analysis
Continuous variables are reported as mean ± SD or median with interquartile ranges (IQR), whereas categorical variables are expressed as frequencies and percentages. Between-group comparisons were performed using the Student’s t-test or the Mann–Whitney U-test for continuous variables and the chi-square or Fisher’s exact test for categorical variables, as appropriate. Survival analyses were performed using the Kaplan–Meier method with log-rank tests. Cox proportional hazards regression models were used to estimate hazard ratios (HRs) with 95% confidence intervals (CIs). Variables with a p value < 0.1 in univariate analyses were included in multivariate analyses. The proportional hazards assumption was tested using Schoenfeld residuals. The predictive performance of LGE for outcomes was evaluated using receiver operating characteristic (ROC) analysis, and the optimal cutoff value was identified using the Youden index. A two-tailed p value < 0.05 was considered statistically significant. All survival analyses were based on time-to-first-event data, with recurrent events excluded. Statistical analyses were performed using R software, version 2025.05.0 (R Foundation for Statistical Computing, Vienna, Austria).
- RESULTS
- RESULTS
- Baseline characteristics
- Baseline characteristics
The final analysis comprised 142 patients with HCM. The mean age was 58.5 ± 13.7 years, and 71% were male (Table 1). Patients were stratified into two groups based on the LGE extent using a 15% cutoff. Compared with the low LGE group (< 15%, n = 109), the high LGE group (n = 33) had a lower mean age (56.9 ± 16.3 vs. 59.2 ± 12.7 years, p = 0.45) and a higher proportion of male patients (84.8% vs. 68.8%, p = 0.11).Regarding comorbidities, hypertension was significantly less prevalent in the high LGE group (36.4% vs. 58.7%, p = 0.04). In contrast, the prevalence of diabetes mellitus (18.2% vs. 18.3%, p = 1.00), dyslipidemia (24.2% vs. 36.7%, p = 0.26), and atrial fibrillation (21.2% vs. 21.1%, p = 1.00) was comparable between groups. A family history of SCD was more frequently observed in the high LGE group, but without statistical significance (18.2% vs. 9.2%, p = 0.26).Echocardiographic findings demonstrated that patients with higher LGE burden had a lower left ventricular ejection fraction (LVEF) (61.3% ± 10.6% vs. 65.9% ± 6.3%, p = 0.02), increased maximal wall thickness (23.8 ± 3.5 mm vs. 20.6 ± 3.4 mm, p < 0.001), and a larger left atrial volume index (41.2 ± 17.6 mL/m2 vs. 34.7 ± 15.0 mL/m2, p = 0.07). The left atrial anteroposterior diameter was also greater in the high LGE group (44.7 ± 6.8 mm vs. 41.8 ± 6.7 mm, p = 0.04).On cardiac MRI, the mean LGE percentage calculated using the AI-based CMR analysis was 9.4% ± 8.4% (median, 7.1%). Participants in the high LGE group exhibited substantially greater LGE burden (21.9% ± 6.2%, median 20.0%) compared with those in the low LGE group (5.6% ± 4.2%, median 4.7%). Myocardial mass was significantly higher in the high LGE group compared with the low LGE group (142.4 ± 42.0 g vs. 122.5 ± 32.9 g, p = 0.02).Baseline ICD implantation was more common in the high LGE group than in the low LGE group (21.2% vs. 7.3%), largely driven by primary prevention ICD implantation (21.2% vs. 5.5%), while secondary prevention ICDs were uncommon (0.0% vs. 1.8%).Baseline ambulatory ECG data for NSVT assessment were available in 96 of 142 patients (67.6%). NSVT was identified in 25 (26.0%) of these patients. Its prevalence was 24.3% (18/74) in the low LGE group and 31.8% (7/22) in the high LGE group, with no significant difference between the groups (p = 0.581).- Primary outcomes
- Primary outcomes
Over a median follow-up of 59 months (IQR, 34–93 months; maximum, 96 months), the primary outcome (a composite of cardiovascular death and SCD equivalents) occurred in 12 patients (8.5%). Event rates were significantly higher in the high LGE group compared with the low LGE group (7/33 [21.2%] vs. 5/109 [4.6%]; Fisher’s exact test, p = 0.0067). The Kaplan–Meier analysis demonstrated significantly reduced event-free survival in the high LGE group (log-rank p = 0.012) (Fig. 3).Given the clinical importance of SCD and SCD-equivalent events in HCM, these events were also separately analyzed to better characterize their relationship with LGE extent. During follow-up, 9 (6.3%) patients experienced SCD or SCD-equivalent events. The event rate was higher in the high LGE group than in the low LGE group (4/33 [12.1%] vs. 5/109 [4.6%]); however, this difference was not statistically significant (Fisher’s exact test, p = 0.2127). Consistently, Kaplan–Meier analysis demonstrated no significant difference in event-free survival between the groups (log-rank p = 0.22; Fig. 4).A detailed breakdown of SCD-equivalent events showed that among the nine events, six were aborted SCD, six were sustained ventricular tachycardia/ventricular fibrillation (VT/VF), and one was an appropriate ICD shock. Because these categories were not mutually exclusive, there was overlap between events. Three sustained VT/VF events were also classified as aborted SCD, and the single ICD shock event occurred during a VT/VF event.In univariable Cox analysis, LGE %, modeled as a continuous variable (per 1% increase), was significantly associated with a higher risk of primary outcomes (HR 1.08, 95% CI 1.03–1.14, p = 0.002). After adjusting for age and LVEF, LGE % remained independently associated (HR 1.11, 95% CI 1.05–1.18, p < 0.001) (Table 2). When analyzed categorically, patients with LGE ≥ 15% demonstrated a significantly higher risk of primary outcomes compared with those with LGE < 15% (adjusted HR 4.67, 95% CI 1.43–15.30, p = 0.011).ROC analysis identified an optimal LGE threshold of 8.09% for predicting the primary outcome (area under the curve [AUC] of 0.821, 95% CI 0.733–0.908, sensitivity 100%, and specificity 59%) (Fig. 5). Using this LGE threshold, the high LGE cutoff group (≥ 8%) demonstrated markedly increased primary outcome rates (18.2% vs. 0%, p < 0.001) (Fig. 6). Similarly, this high LGE cutoff group also exhibited a higher incidence of SCD/SCD-equivalent events than the low cutoff group (13.6% vs. 0%, p = 0.00074) (Fig. 7).- Secondary outcomes
- Secondary outcomes
During follow-up, 14 secondary outcome events (9.9%) were observed. Event occurrence was higher in the high LGE group compared with the low LGE group (7/33 [21.2%] vs. 7/109 [6.4%]; Fisher’s exact test, p = 0.020). High LGE (≥ 15%) remained an independent predictor of the secondary outcome after adjustment for age and LVEF (HR 3.49, 95% CI 1.19–10.26, p = 0.023). In addition, a cause-of-death analysis revealed that patients who experienced cardiac death exhibited a higher LGE burden than those with non-cardiac death (Table 3), suggesting a close relationship between LGE extent and cardiovascular mortality.
- DISCUSSION
- DISCUSSION
- Comparison with previous studies
- Comparison with previous studies
Our findings are consistent with previous evidence linking LGE burden with prognosis in patients with HCM. Chan et al. [10] reported a continuous association between increasing LGE extent and SCD, while Mentias et al. [12] found that LGE ≥ 15% strongly predicted SCD and appropriate ICD therapies in patients with preserved ejection fraction. A meta-analysis of nearly 3,000 patients confirmed that both the presence and extent of LGE were independently associated with adverse clinical outcomes [9]. In this context, our findings provide complementary evidence that an AI-based cutoff of 8% may help identify a low-risk subgroup with minimal event rates, potentially refining risk stratification in patients with borderline LGE burden.- Clinical implications of AI-based quantification
- Clinical implications of AI-based quantification
Conventional LGE quantification is labor-intensive, prone to interobserver variability, and limited in reproducibility. In contrast, AI-based quantification overcomes these limitations by providing fully automated, highly reproducible analysis with improved consistency across repeated measurements [19,20]. Moreover, AI systems can detect subtle and patchy fibrotic patterns that are often overlooked by human observers, which is particularly relevant in HCM, given its marked phenotypic heterogeneity and irregular distribution of myocardial fibrosis [21]. This approach also minimizes interobserver and intraobserver variability and enables more consistent LGE interpretation, even among clinicians without specialized imaging expertise. From a workflow perspective, AI-based analysis decreases operator dependence and standardizes LGE quantification, facilitating its incorporation into routine clinical practice.- Implications for ICD decision-making and guideline perspective
- Implications for ICD decision-making and guideline perspective
ICD implantation in HCM remains a complex clinical decision, particularly in patients lacking conventional major risk factors or those classified as low-to-intermediate risk according to current European Society of Cardiology and American College of Cardiology/American Heart Association guidelines [3,4]. Although both guidelines acknowledge LGE as a prognostic imaging marker, no specific threshold is recommended for clinical decision-making, largely owing to variability in quantification methods, imaging protocols, and study populations across previous studies.In this context, our results suggest that an AI-based, reproducible LGE cutoff of 8% may function as a potential safety margin to further refine current risk stratification by identifying a subgroup with very low event rates. Importantly, this threshold should be considered complementary to the established ≥ 15% cutoff rather than a substitute, and it should not be applied in isolation for clinical decision-making. Further validation in larger prospective multicenter cohorts is required before clinical adoption.Although baseline ICD implantation differed between groups (21.2% vs. 7.3%), only a single instance of appropriate ICD shock occurred across the entire cohort, suggesting a minimal impact of ICD-related events on the overall results.- Study limitations
- Study limitations
This study has several limitations. First, the absence of events in patients with LGE < 8% should be interpreted cautiously, as this may be due to limited statistical power and sample size rather than a true absence of risk. Threshold validation in larger, multicenter cohorts is therefore required. The cutoff value was derived and evaluated within the same cohort, raising the possibility of overfitting and optimism bias, potentially leading to overestimation of its discriminative performance.The retrospective, single-center design also introduces the potential for selection bias and limits generalizability. NSVT, an established marker in HCM risk stratification, was additionally assessed; however, because ambulatory ECG data were not uniformly available due to the retrospective design, NSVT was analyzed descriptively in the subset with available measurements and was excluded from multivariable analysis. In addition, patients unable to undergo CMR due to severe clinical conditions or those who died before imaging were excluded. This may have led to an underestimation of the true risk burden in the HCM population. The proposed 8% cutoff may not be universally applicable, as LGE thresholds are influenced by quantification methods, imaging parameters, and population characteristics; external validation is, therefore, warranted.Finally, although AI-based quantification demonstrated feasibility and reproducibility, a direct head-to-head comparison with manual LGE assessment was not performed to confirm its incremental accuracy.
In this study, we found that AI-based quantification of LGE extent using CMR was independently associated with adverse cardiovascular outcomes in patients with HCM. While a threshold of ≥ 15% LGE has been consistently reported as a high-risk marker in prior large-scale studies [9,10,12], our analysis suggested that an 8% LGE cutoff may also be associated with event-free survival. However, this threshold should be interpreted cautiously, as it was derived from ROC analysis within the same dataset and remains exploratory.Notably, no adverse events occurred during follow-up among patients with LGE < 8%, suggesting that this threshold may help identify a subgroup with very low event risk.
- KEY MESSAGE
- KEY MESSAGE
1. Artificial intelligence (AI)-based quantification of late gadolinium enhancement (LGE) on cardiac magnetic resonance independently predicts adverse cardiovascular outcomes in patients with hypertrophic cardiomyopathy.2. Automated and reproducible AI-based LGE analysis may minimize interobserver variability and may support the incorporation of myocardial fibrosis assessment into routine clinical workflows, enabling individualized clinical decision-making.3. An LGE threshold of 8% served as a potential safety margin for risk stratification, highlighting the clinical utility of AI-based LGE quantification.
- Notes
- Notes
-
Acknowledgments The authors thank Mr. Sang-Won Kim at the Institute of Medical Science, Yeungnam University School of Medicine, for his support in data management and technical assistance throughout the study.
- Notes
- Notes
-
CRedit authorship contributions Young-Sang Jeong: conceptualization, methodology, investigation, data curation, formal analysis, writing - original draft, visualization; Jong-Il Park: investigation, data curation; Kang-Un Choi: investigation, data curation; Jong-Ho Nam: investigation, data curation; Chan-Hee Lee: conceptualization, methodology, writing - review & editing, supervision, project administration; Jang-Won Son: methodology, writing - review & editing, supervision; Ung Kim: formal analysis, writing - review & editing, supervision; Jong-Seon Park: resources, writing - review & editing, supervision; Eunjung Kong: conceptualization, methodology, software, writing - review & editing, supervision
- Conflicts of Interest
- Conflicts of Interest
-
Conflicts of interest The authors disclose no conflicts.
- Notes
- Notes
-
Funding None
Figure 1
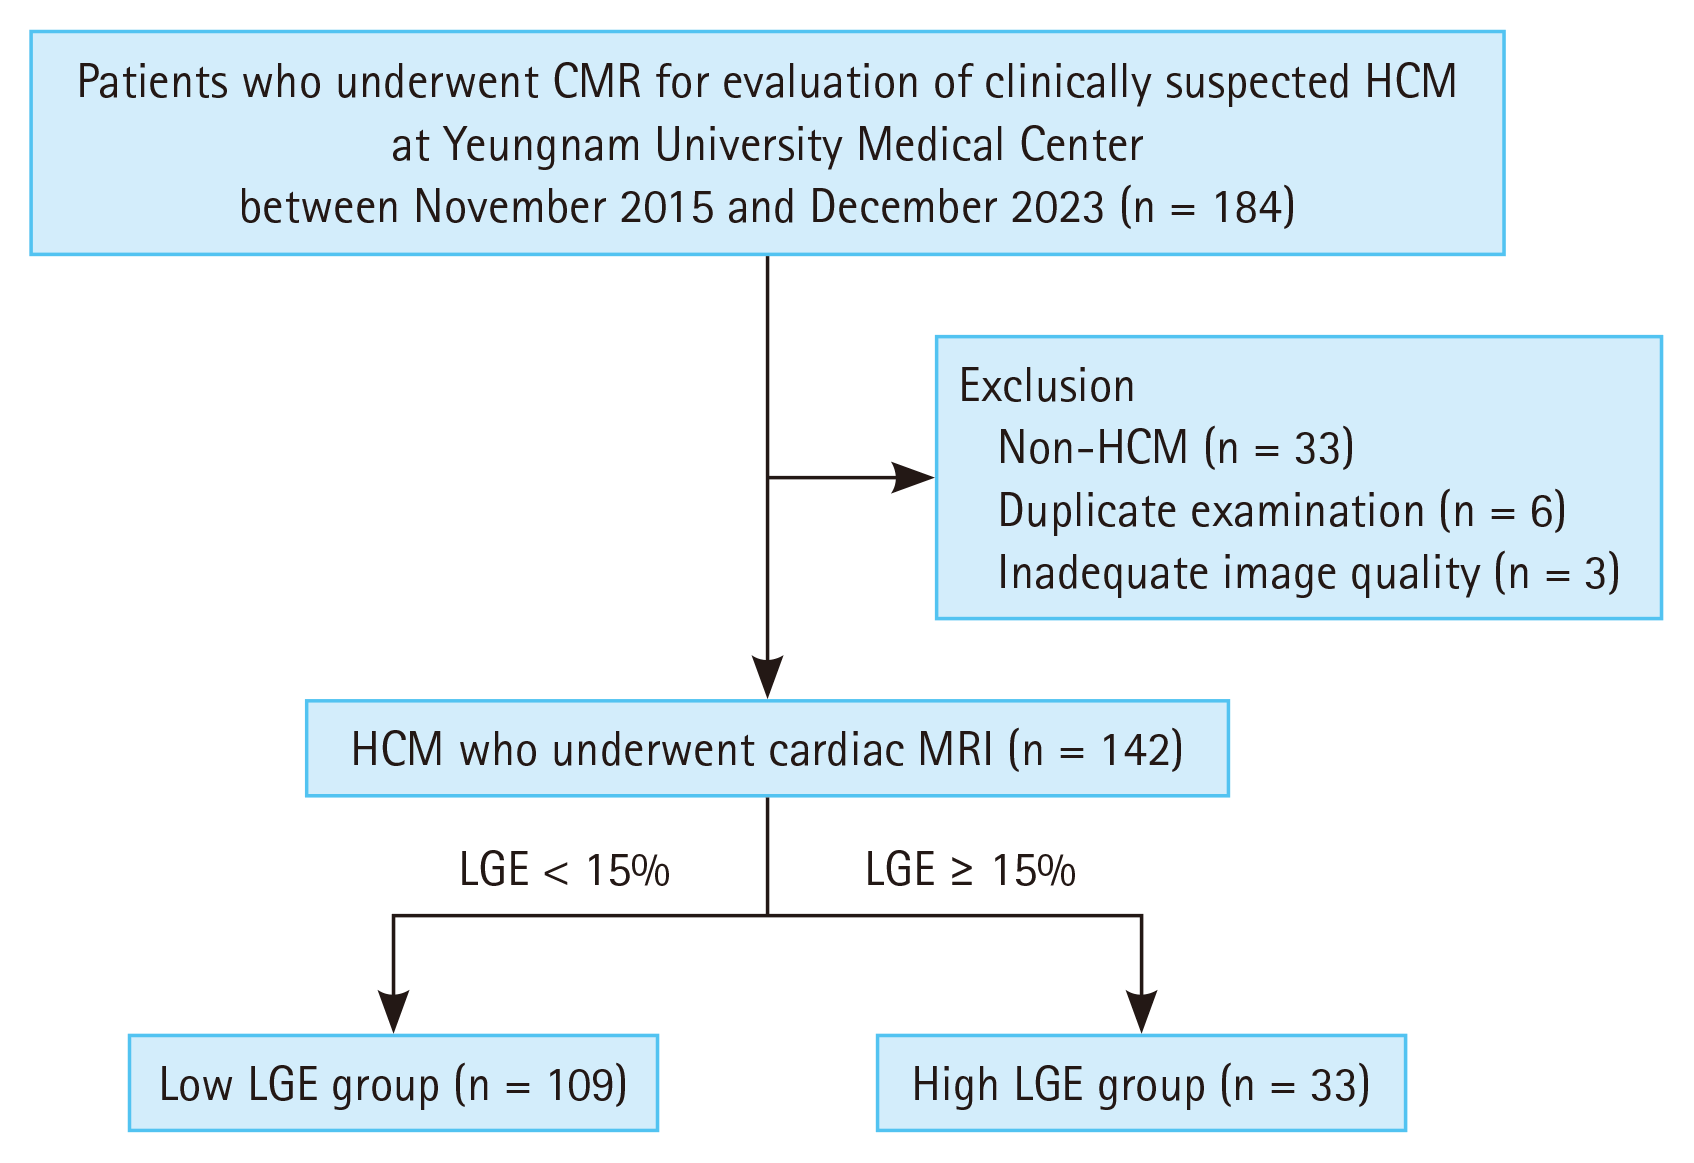
Figure 2
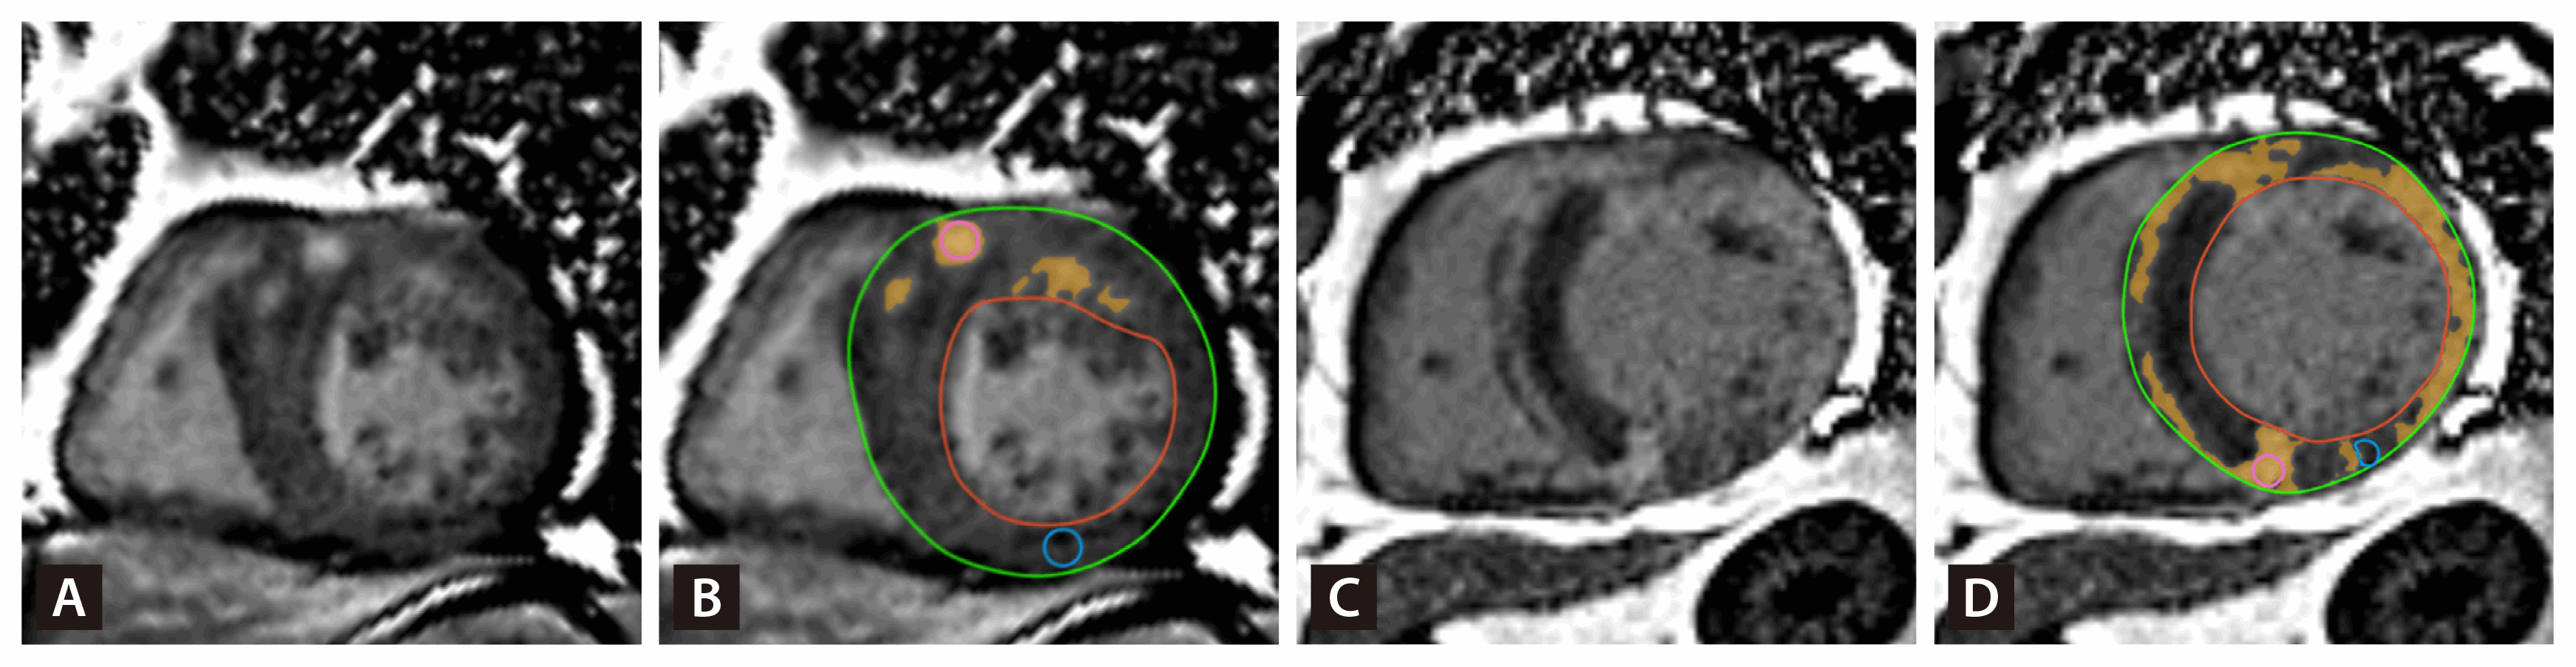
Figure 3
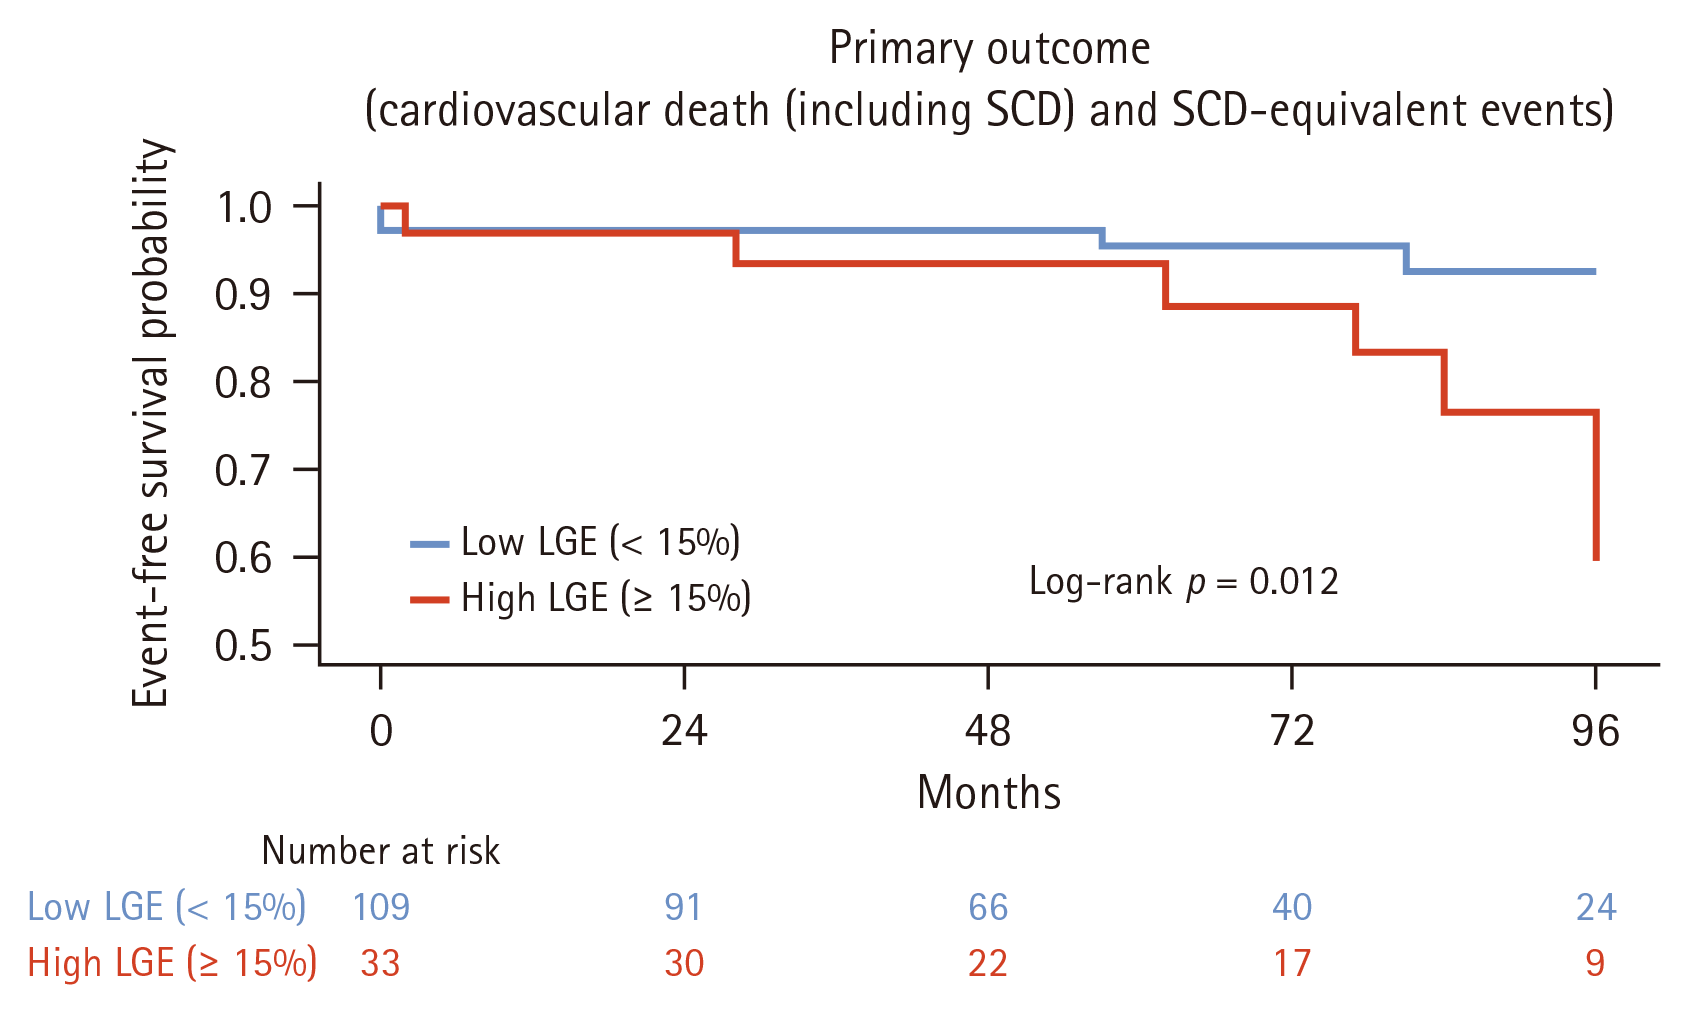
Figure 4
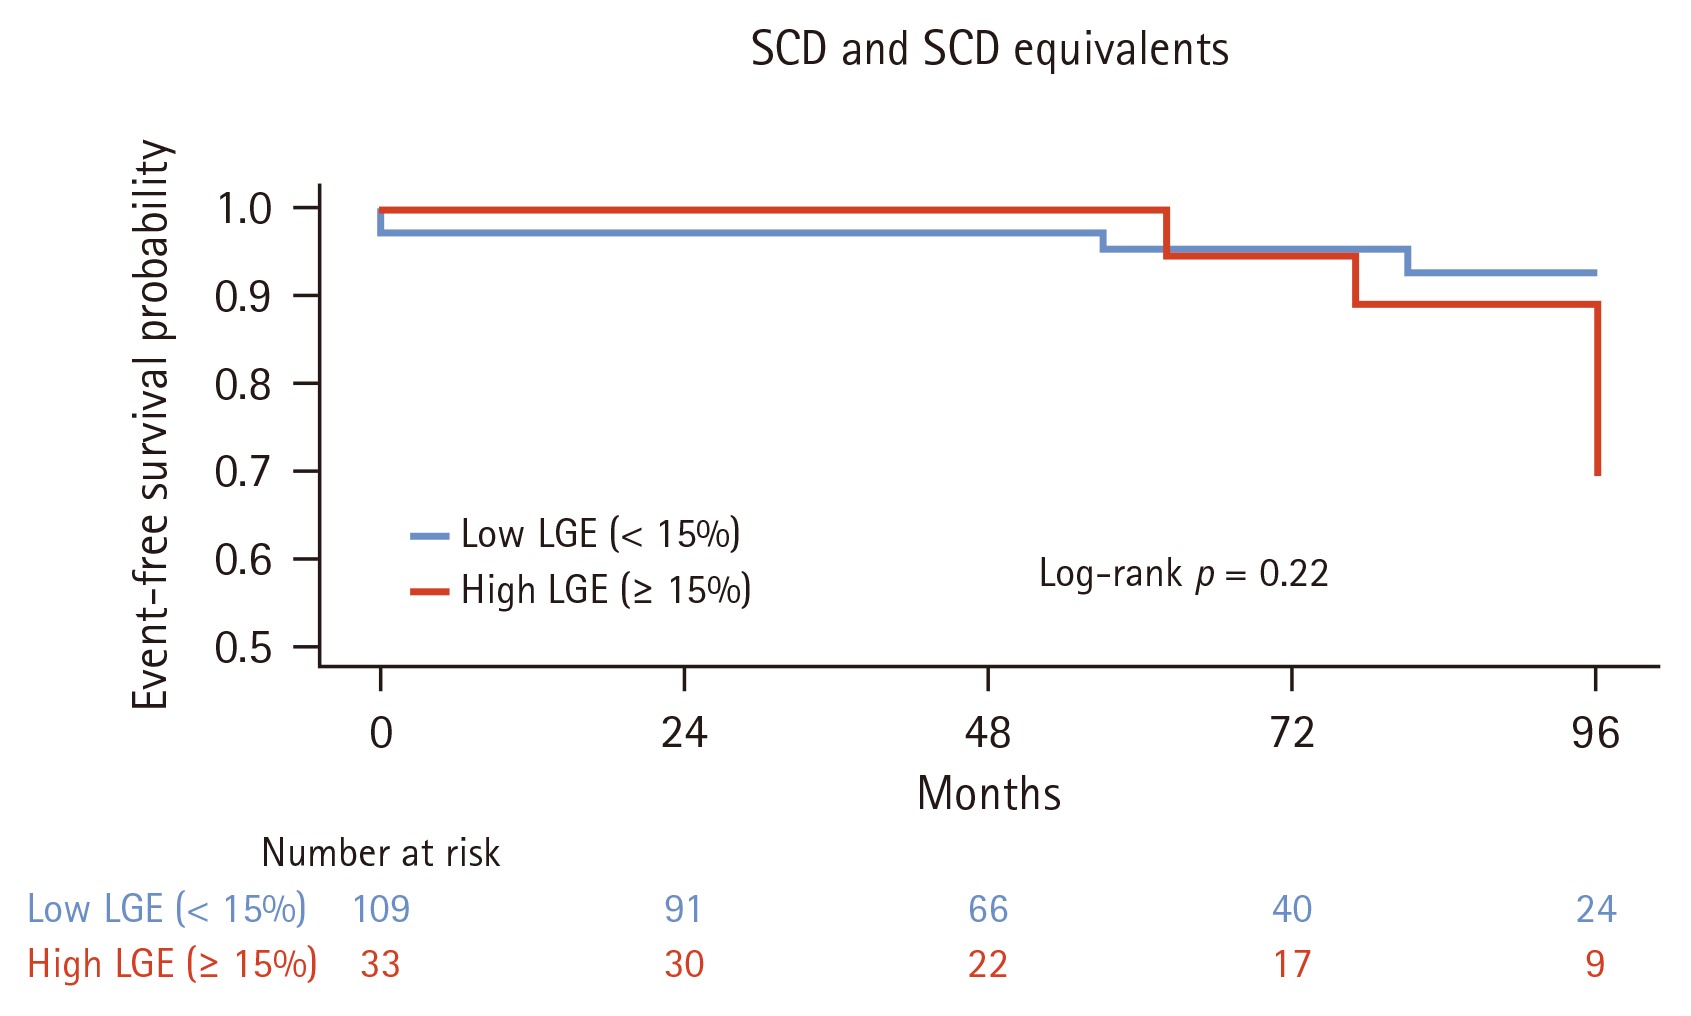
Figure 5
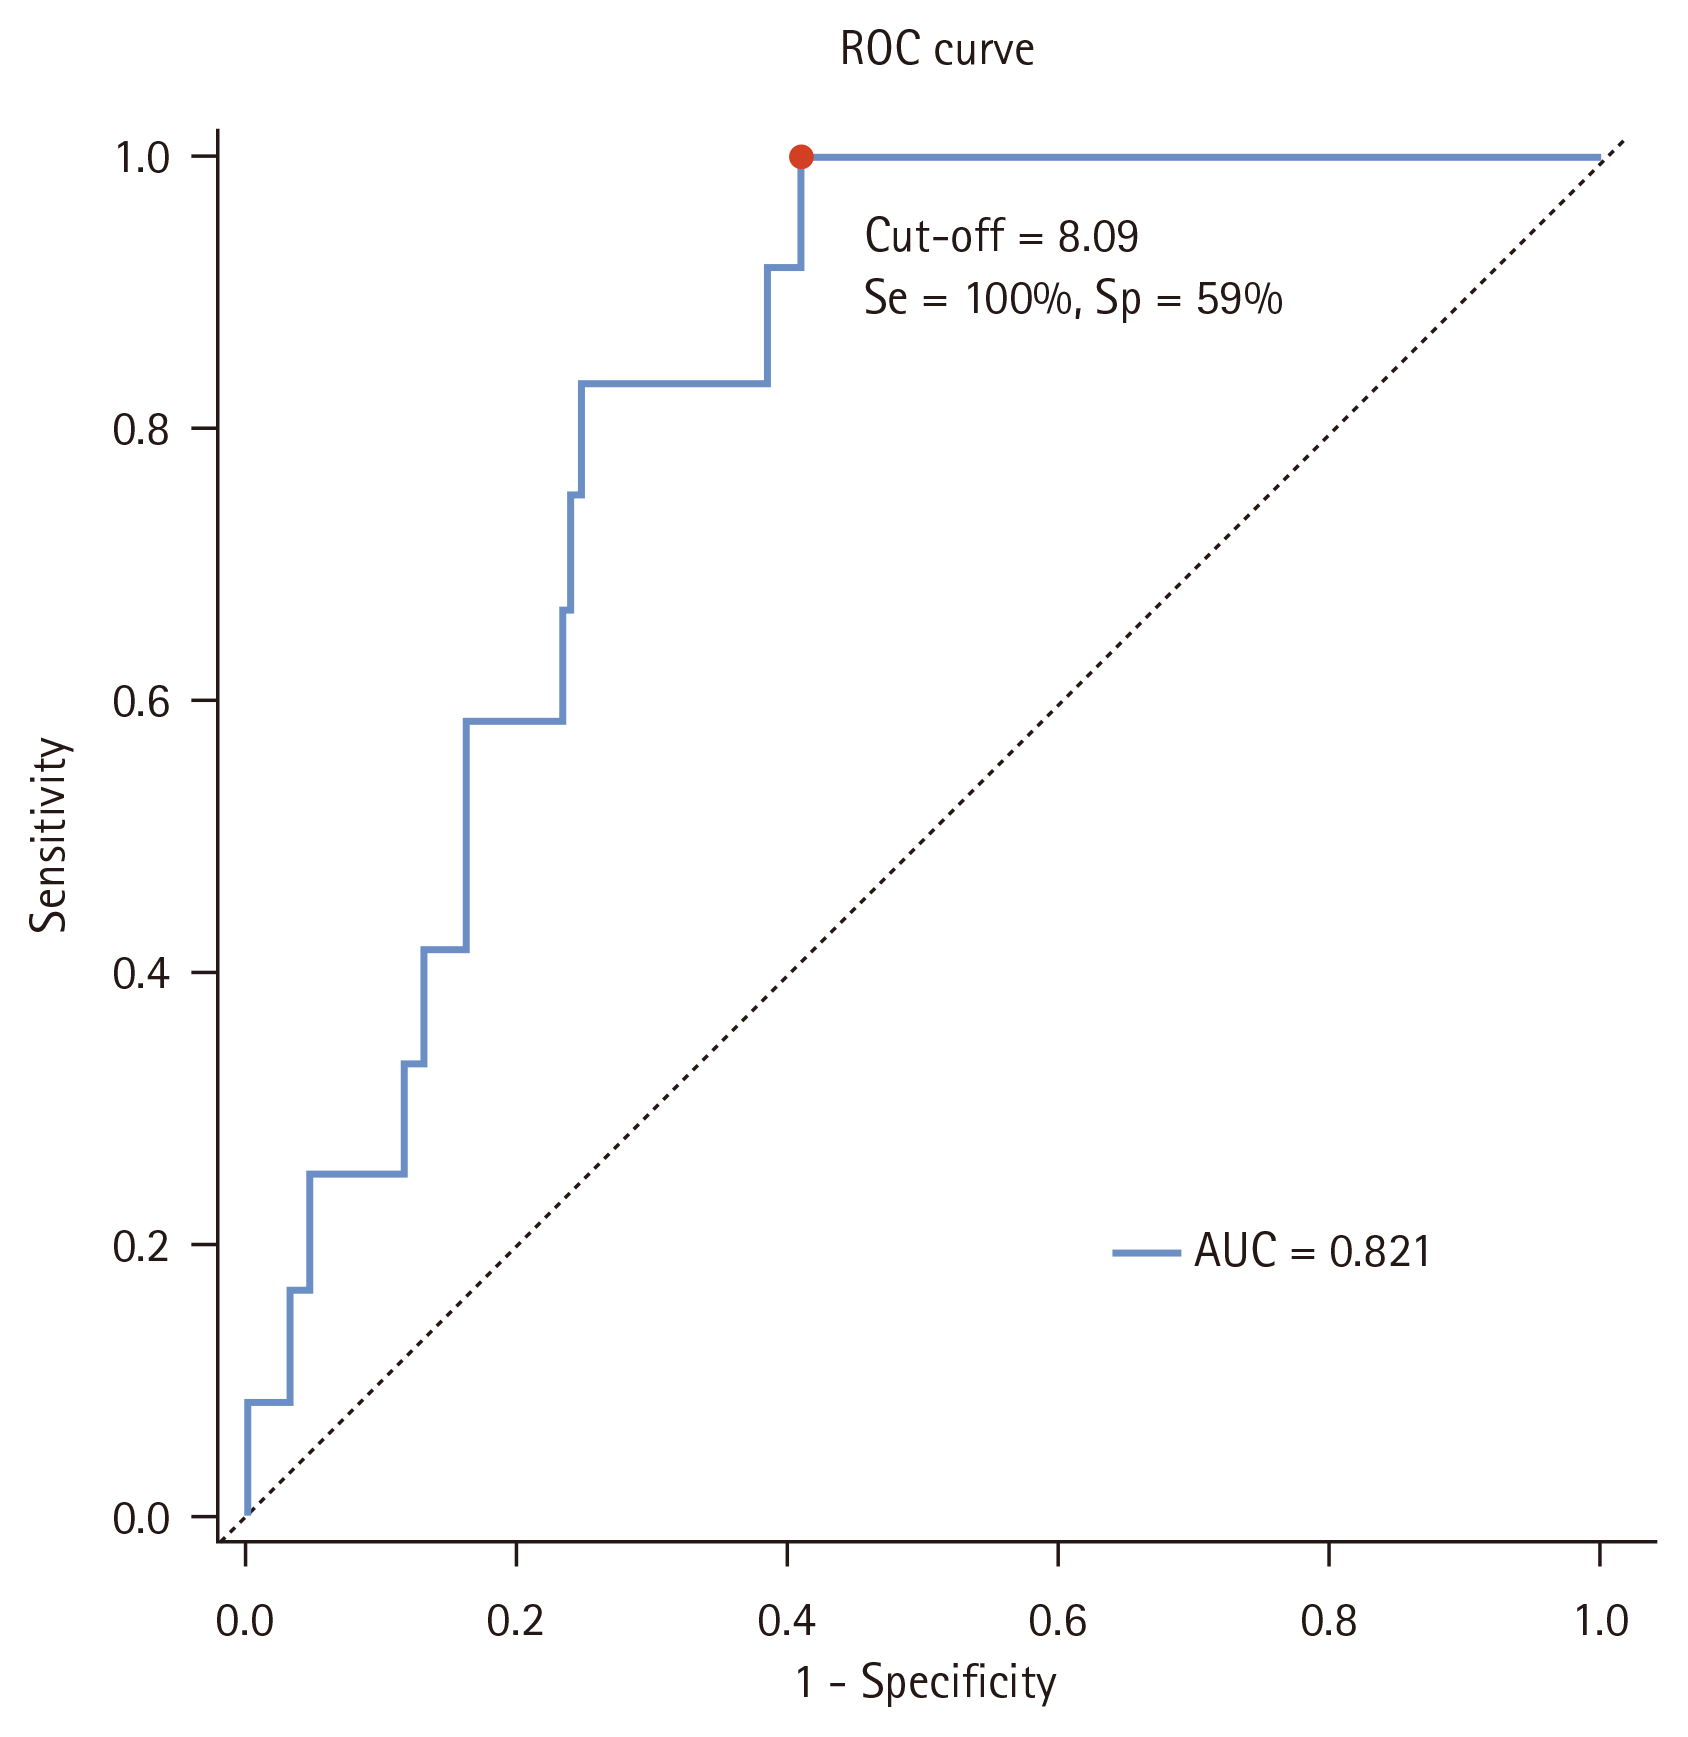
Figure 6
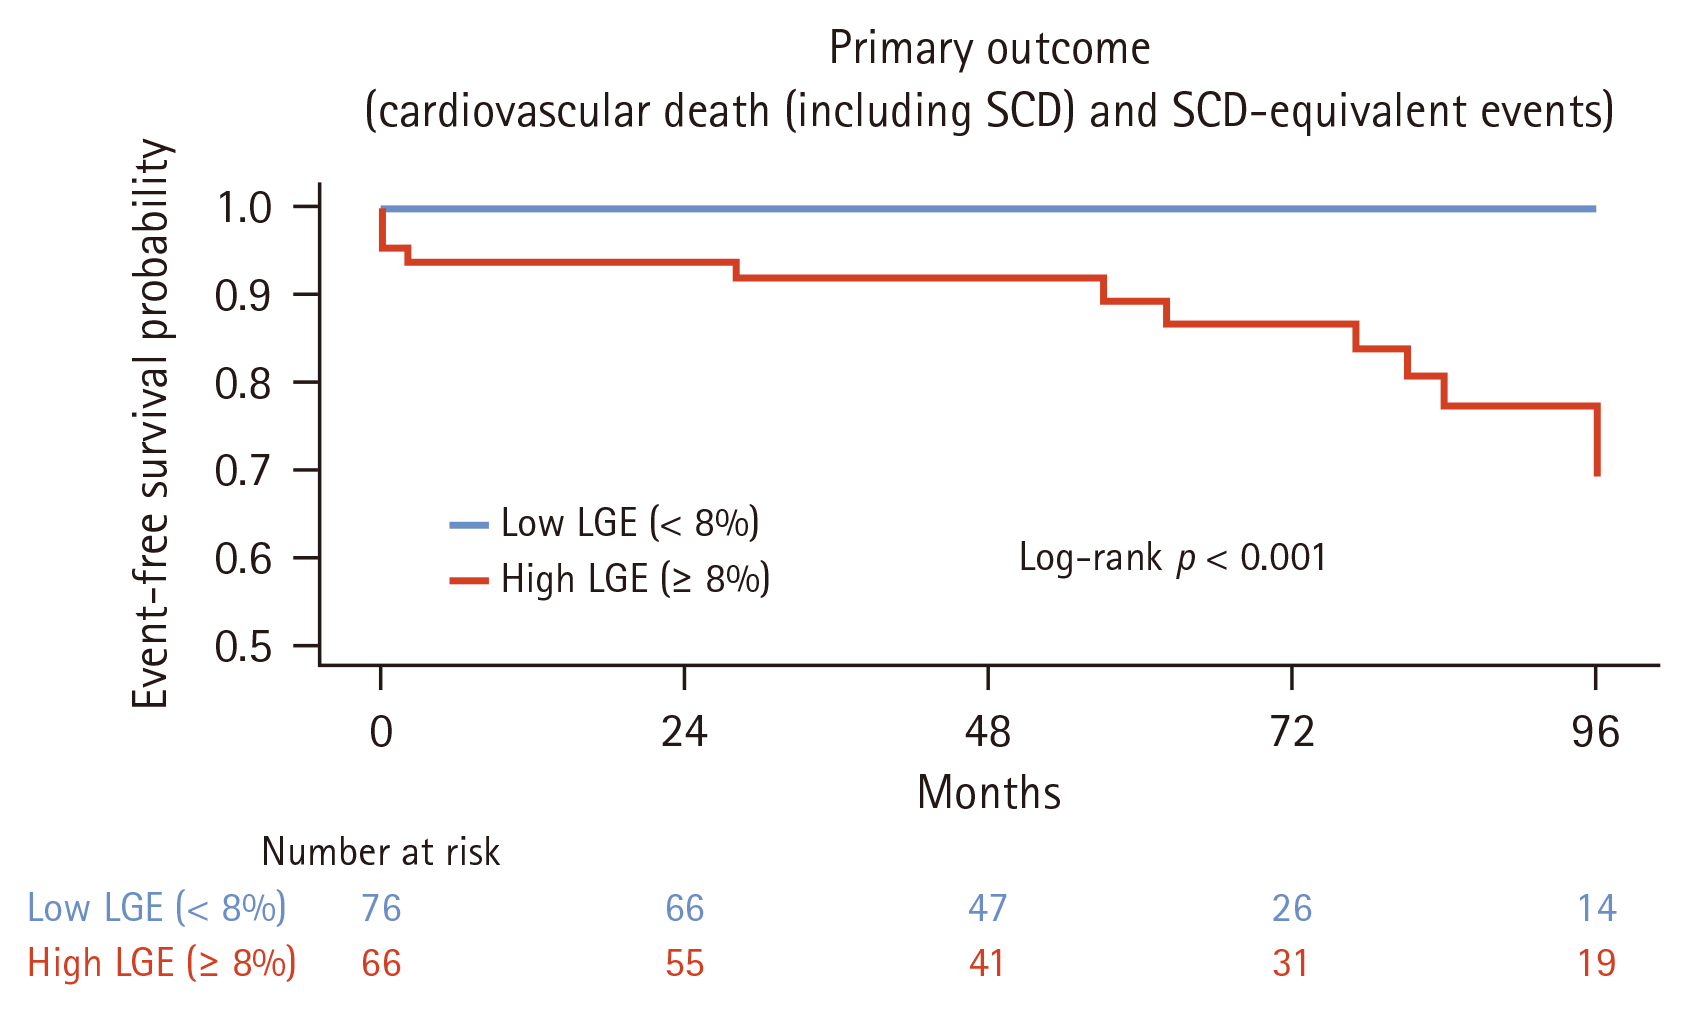
Figure 7
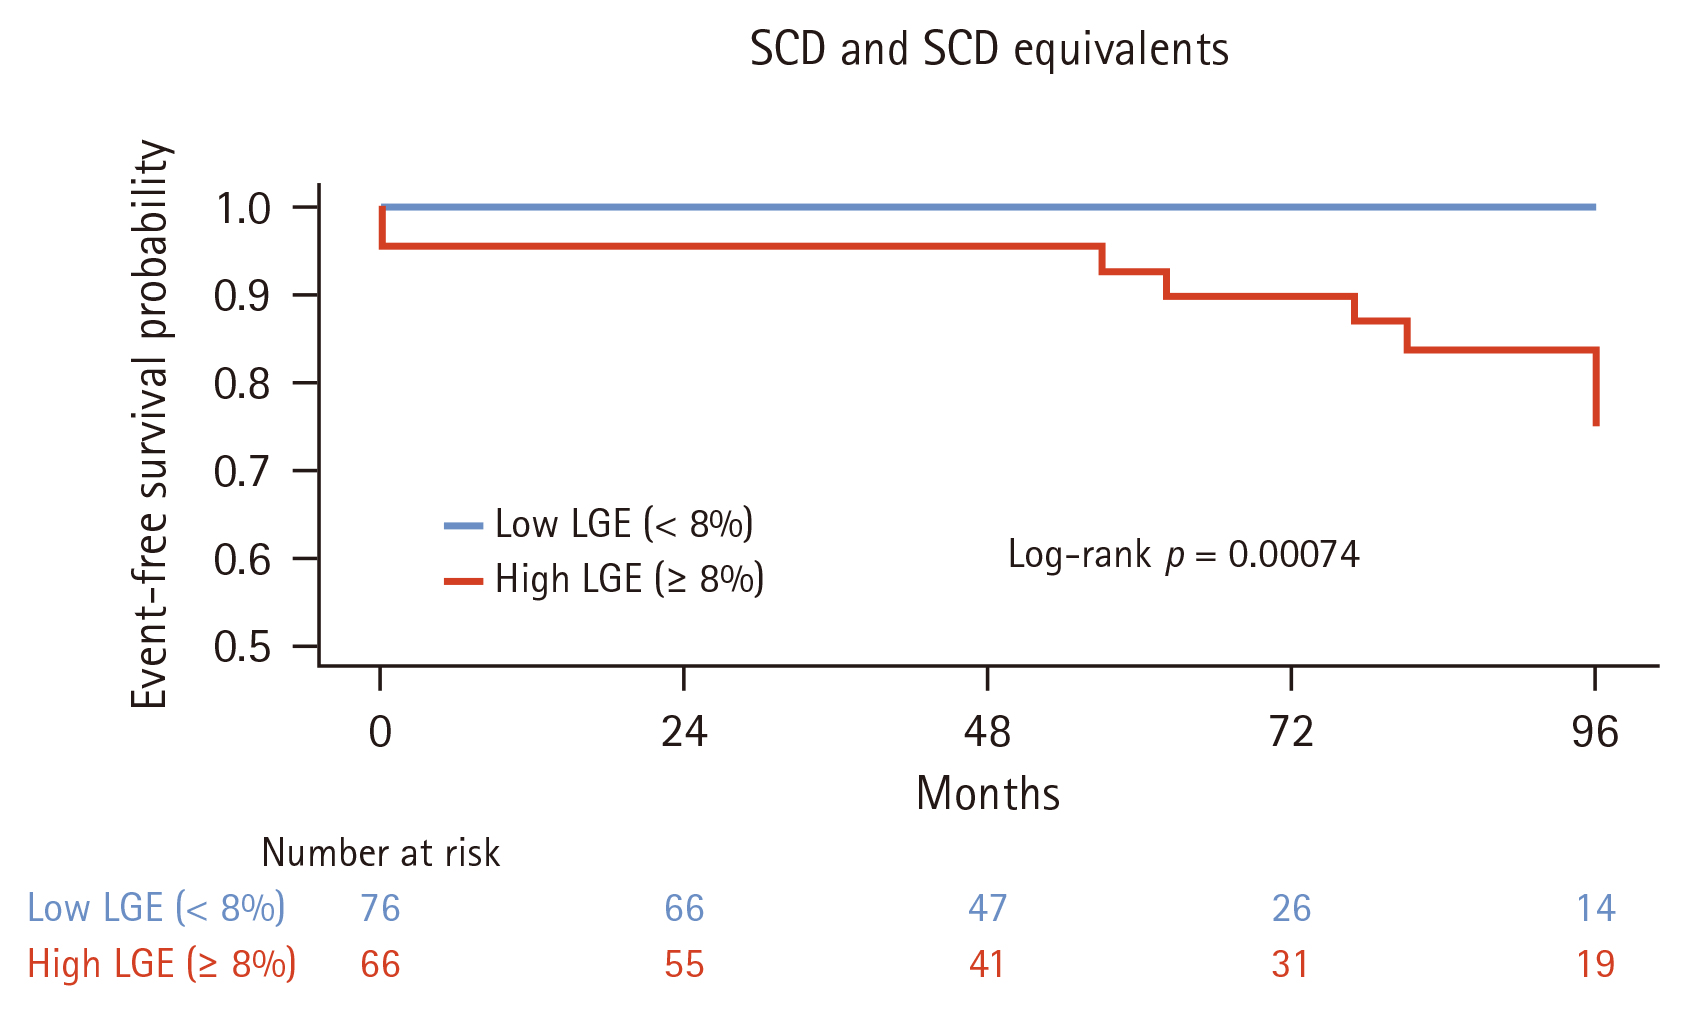
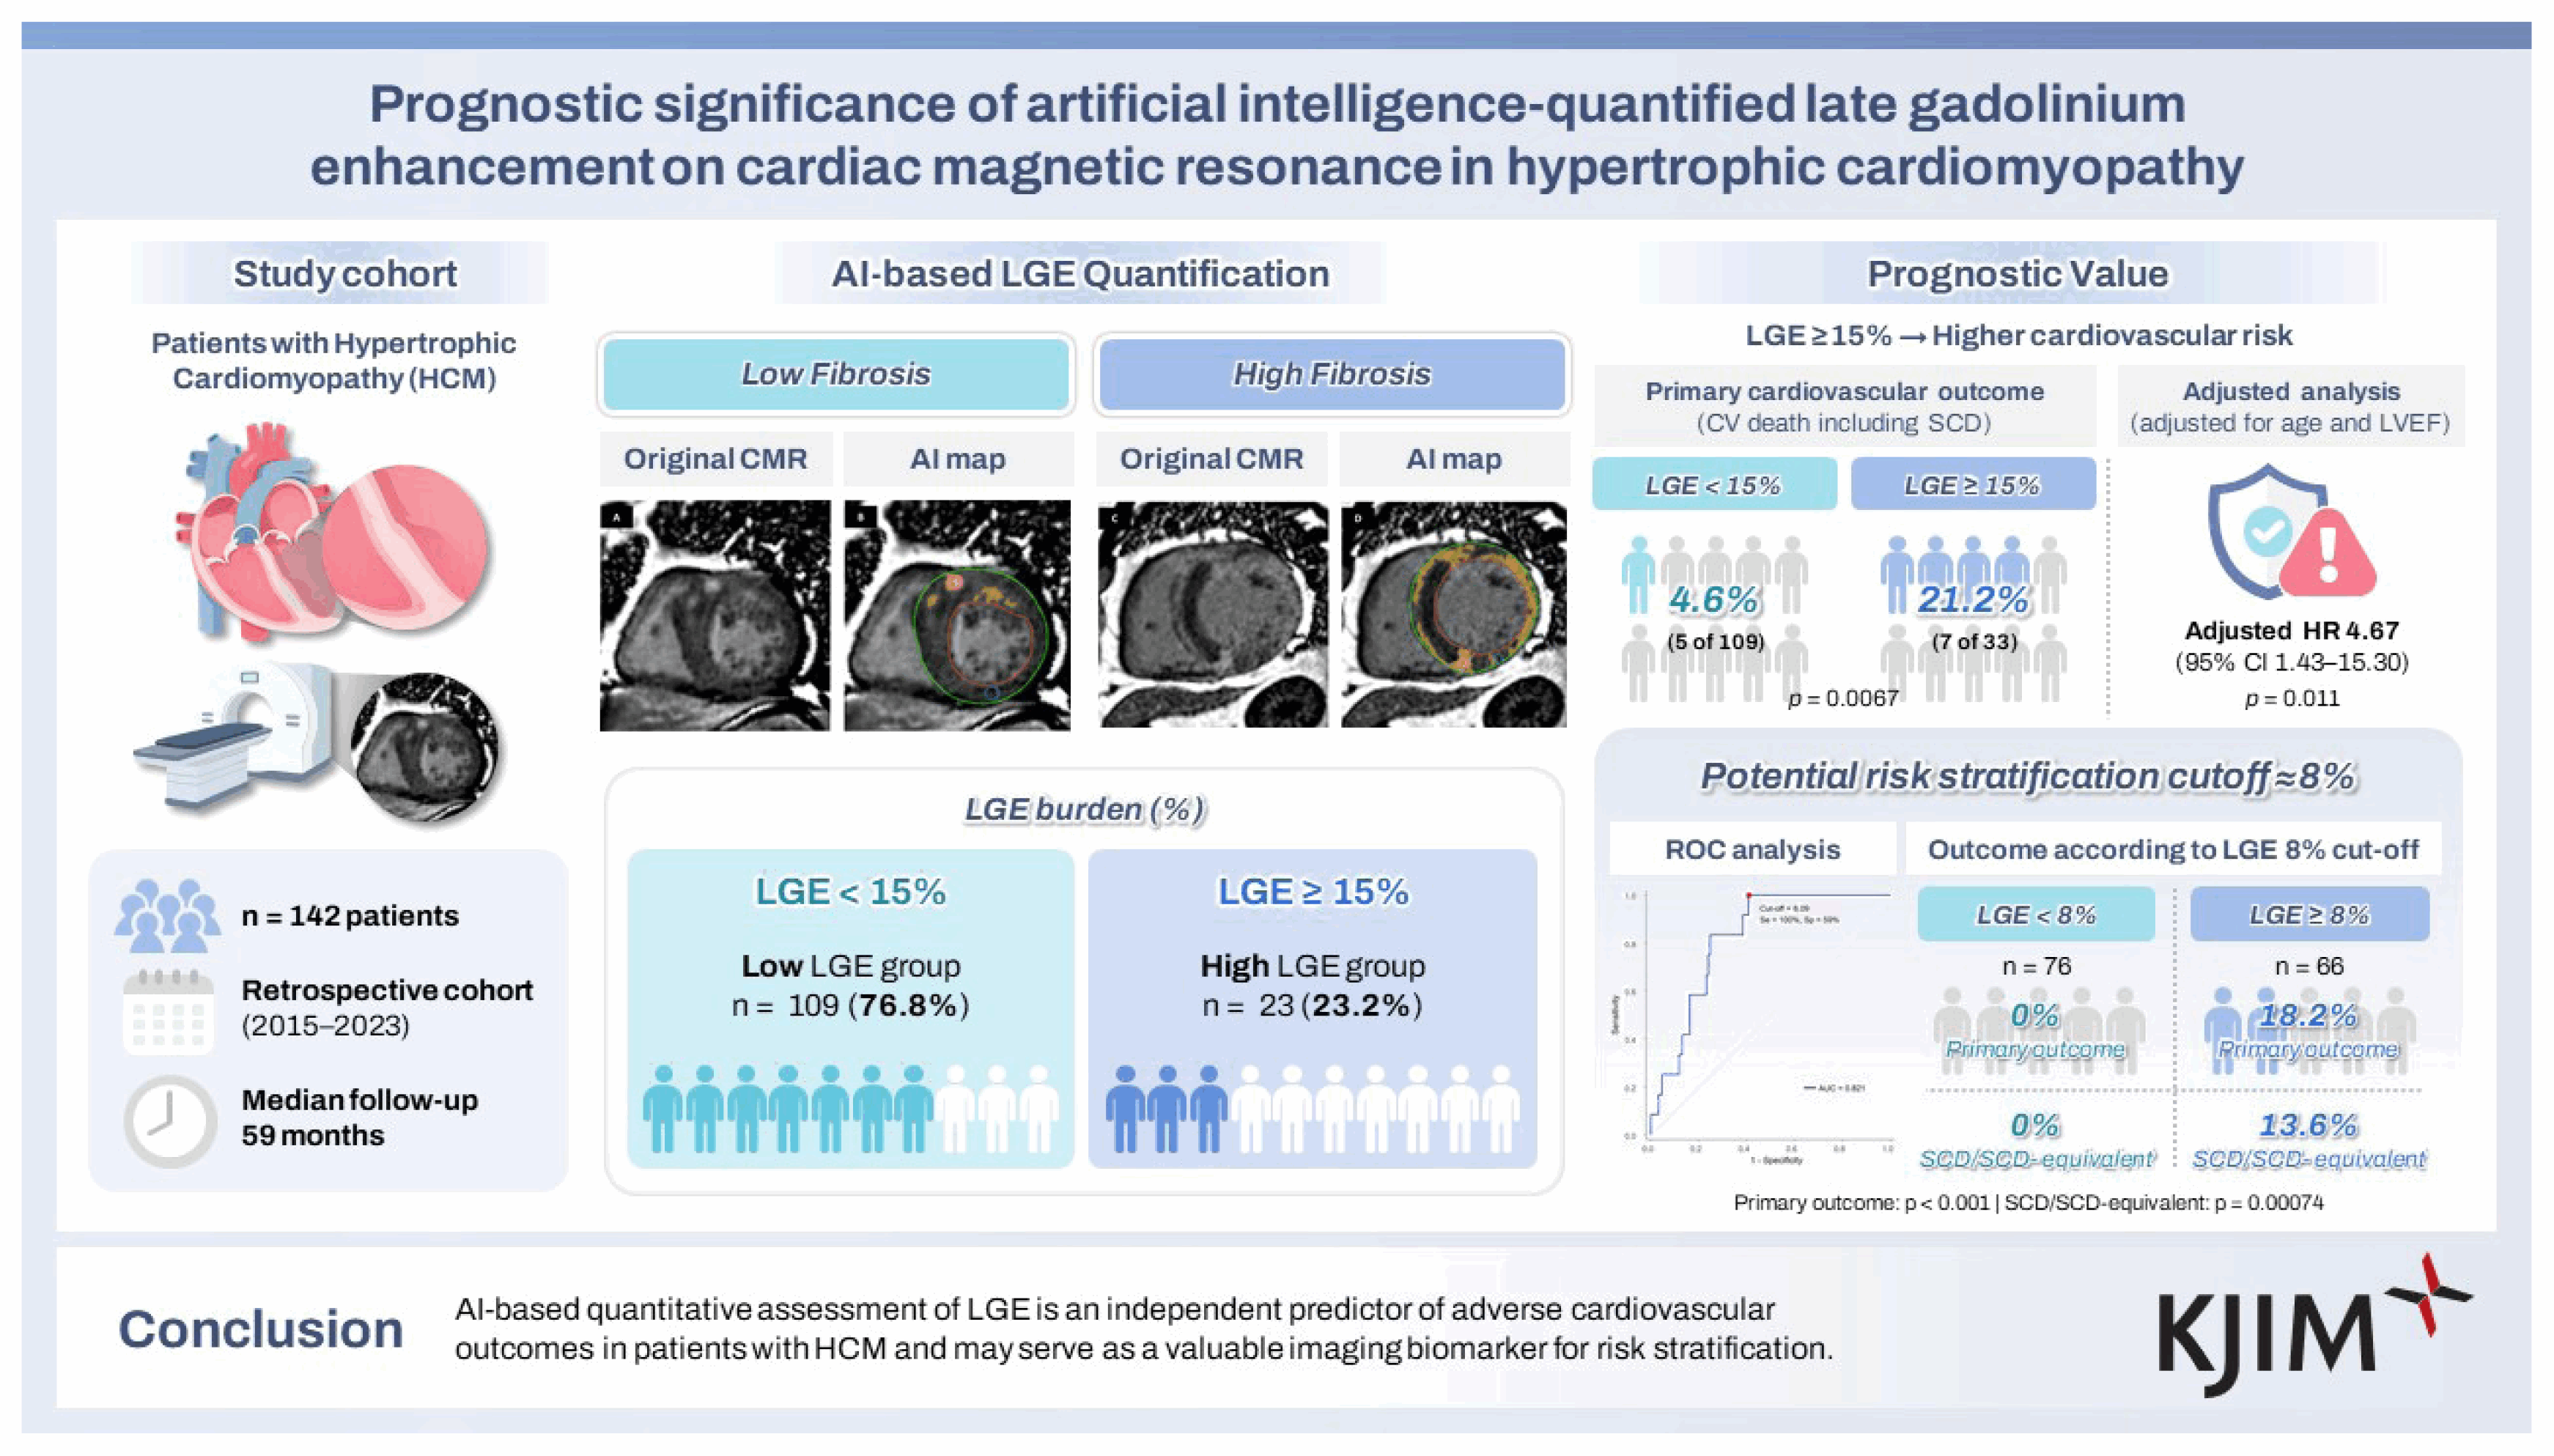
Table 1
Table 2
| Variable | Univariate analysis | Multivariate analysisa) | ||
|---|---|---|---|---|
|
|
|
|||
| HR (95% CI) | p value | HR (95% CI) | p value | |
| Primary outcome | ||||
|
|
||||
| LGE, % | 1.08 (1.03–1.14) | 0.002 | 1.11 (1.05–1.18) | < 0.001 |
|
|
||||
| LGE ≥ 15% | 3.96 (1.25–12.52) | 0.019 | 4.67 (1.43–15.30) | 0.011 |
|
|
||||
| SCD/SCD equivalents | ||||
|
|
||||
| LGE, % | 1.06 (0.99–1.12) | 0.093 | 1.08 (1.00–1.16) | 0.055 |
|
|
||||
| LGE ≥ 15% | 2.23 (0.60–8.34) | 0.233 | 2.46 (0.62–9.74) | 0.200 |
|
|
||||
| Secondary outcome | ||||
|
|
||||
| LGE, % | 1.07 (1.02–1.12) | 0.009 | 1.10 (1.04–1.16) | 0.002 |
|
|
||||
| LGE ≥ 15% | 2.78 (0.97–7.96) | 0.056 | 3.49 (1.19–10.26) | 0.023 |
Table 3
- References
- References
REFERENCES
1. Massera D, Sherrid MV, Maron MS, Rowin EJ, Maron BJ. How common is hypertrophic cardiomyopathy…really?: disease prevalence revisited 27 years after CARDIA. Int J Cardiol 2023;382:64–67.
[Article] [PubMed]2. Semsarian C, Ingles J, Maron MS, Maron BJ. New perspectives on the prevalence of hypertrophic cardiomyopathy. J Am Coll Cardiol 2015;65:1249–1254.
[Article] [PubMed] [PMC]3. Arbelo E, Protonotarios A, Gimeno JR, et al. 2023 ESC Guidelines for the management of cardiomyopathies: developed by the task force on the management of cardiomyopathies of the European Society of Cardiology (ESC). Eur Heart J 2023;44:3503–3626.
[PubMed]4. Ommen SR, Mital S, Burke MA, et al. 2020 AHA/ACC guideline for the diagnosis and treatment of patients with hypertrophic cardiomyopathy: executive summary: a report of the American College of Cardiology/American Heart Association Joint Committee on Clinical Practice Guidelines. Circulation 2020;142:e533–e557.
[PubMed]5. Rowin EJ, Burrows A, Madias C, et al. Long-term outcome in high-risk patients with hypertrophic cardiomyopathy after primary prevention defibrillator implants. Circ Arrhythm Electrophysiol 2020;13:e008123.
[Article] [PubMed]6. Hong Y, Su WW, Li X. Risk factors of sudden cardiac death in hypertrophic cardiomyopathy. Curr Opin Cardiol 2022;37:15–21.
[Article] [PubMed] [PMC]7. O’Mahony C, Elliott P, McKenna W. Sudden cardiac death in hypertrophic cardiomyopathy. Circ Arrhythm Electrophysiol 2013;6:443–451.
[Article] [PubMed]8. Moravsky G, Ofek E, Rakowski H, et al. Myocardial fibrosis in hypertrophic cardiomyopathy: accurate reflection of histopathological findings by CMR. JACC Cardiovasc Imaging 2013;6:587–596.
[PubMed]9. Weng Z, Yao J, Chan RH, et al. Prognostic value of LGE-CMR in HCM: a meta-analysis. JACC Cardiovasc Imaging 2016;9:1392–1402.
[PubMed]10. Chan RH, Maron BJ, Olivotto I, et al. Prognostic value of quantitative contrast-enhanced cardiovascular magnetic resonance for the evaluation of sudden death risk in patients with hypertrophic cardiomyopathy. Circulation 2014;130:484–495.
[Article] [PubMed] [PMC]11. Bruder O, Wagner A, Jensen CJ, et al. Myocardial scar visualized by cardiovascular magnetic resonance imaging predicts major adverse events in patients with hypertrophic cardiomyopathy. J Am Coll Cardiol 2010;56:875–887.
[Article] [PubMed]12. Mentias A, Raeisi-Giglou P, Smedira NG, et al. Late gadolinium enhancement in patients with hypertrophic cardiomyopathy and preserved systolic function. J Am Coll Cardiol 2018;72:857–870.
[Article] [PubMed]13. Harrigan CJ, Peters DC, Gibson CM, et al. Hypertrophic cardiomyopathy: quantification of late gadolinium enhancement with contrast-enhanced cardiovascular MR imaging. Radiology 2011;258:128–133.
[Article] [PubMed]14. Kiaos A, Daskalopoulos GN, Kamperidis V, Ziakas A, Efthimiadis G, Karamitsos TD. Quantitative late gadolinium enhancement cardiac magnetic resonance and sudden death in hypertrophic cardiomyopathy: a meta-analysis. JACC Cardiovasc Imaging 2024;17:489–497.
[PubMed]15. Mahrholdt H, Seitz A. Refining the prognostic value of LGE in hypertrophic cardiomyopathy: presence, extent, and location-What’s next? JACC Cardiovasc Imaging 2023;16:1178–1180.
[PubMed]16. Ommen SR, Ho CY, Asif IM, et al. 2024 AHA/ACC/AMSSM/HRS/PACES/SCMR guideline for the management of hypertrophic cardiomyopathy: a report of the American Heart Association/American College of Cardiology Joint Committee on Clinical Practice Guidelines. Circulation 2024;149:e1239–e1311.
[PubMed]17. Kim H, Yang YJ, Han K, et al. Validation of a deep learning-based software for automated analysis of T2 mapping in cardiac magnetic resonance imaging. Quant Imaging Med Surg 2023;13:6750–6760.
[Article] [PubMed] [PMC]18. Lee S, Kim P, Im DJ, et al. The image quality and diagnostic accuracy of T1-mapping-based synthetic late gadolinium enhancement imaging: comparison with conventional late gadolinium enhancement imaging in real-life clinical situation. J Cardiovasc Magn Reson 2022;24:28.
[Article] [PubMed] [PMC]19. Bai W, Sinclair M, Tarroni G, et al. Automated cardiovascular magnetic resonance image analysis with fully convolutional networks. J Cardiovasc Magn Reson 2018;20:65.
[Article] [PubMed] [PMC]