Diabetes progression and severe hypoglycemia: a nationwide cohort study of 2,475,605 adults with type 2 diabetes mellitus
-
Kyu-Na Lee1, Bongseong Kim2, Mee Kyoung Kim3,*
 , Sukil Kim1,*
- Received February 20, 2026; Revised April 22, 2026; Accepted May 11, 2026;
- Abstract
-
- Background/Aims
- Severe hypoglycemia (SH) is a major concern in type 2 diabetes mellitus (T2DM). We evaluated whether a composite diabetes progression score could predict incident SH.
- Methods
- Using the Korean National Health Insurance Service database, we identified 2,475,605 adults with T2DM who underwent health examinations in 2015–2016. Incident SH was defined by ICD–10 codes plus emergency department visit or hospitalization. The progression score (range, 0–6) comprised six indicators: longer diabetes duration, use of ≥ 3 oral glucose-lowering drug classes, insulin use, chronic kidney disease (CKD), cardiovascular disease, and diabetic retinopathy.
- Results
- During 1 year of follow-up, 1,186 SH events occurred. Each component of diabetes progression was independently associated with SH risk hazard ratios (HRs) from 1.19–3.27, with insulin use and CKD showing the largest effects. SH risk increased stepwise with higher progression scores. Compared with a score of 0, the adjusted HRs (95% confidence intervals) were 3.35 (2.63–4.27), 7.74 (6.15–9.74), 12.61 (9.97–15.95), 22.39 (17.44–28.75) for scores 1, 2, 3, and ≥ 4, respectively.
- Conclusions
- A concise diabetes progression score strongly stratified short-term SH risk in this nationwide cohort, and may help target proactive prevention and early intervention.
- Graphical abstract
- Graphical abstract
- INTRODUCTION
- INTRODUCTION
Severe hypoglycemia (SH) is one of the most serious acute complications of diabetes mellitus (DM), and may lead to cardiovascular disease (CVD), dementia, falls, and death [1]. Repeated episodes of SH adversely affect patient prognosis and are associated with cognitive decline, stress, reduced quality of life, and increased hospital readmissions [2]. This is a significant burden for both patients and the entire healthcare system. SH should not be regarded as a failure of diabetes management, but rather as a condition requiring more proactive prevention and early intervention.The prevalence of SH increased steadily from 0.29% in 2002 to a peak of 0.87% in 2012, before gradually declining to 0.60% in 2019 with an incidence rate of 4.43 per 1,000 person-years [3]. The observed reduction in SH incidence is likely attributable to increased use of newer glucose-lowering agents associated with a lower risk of hypoglycemia, adoption of less stringent glycemic targets, and growing emphasis on individualized treatment strategies [3]. Although the incidence has shown a declining trend, SH events remain a significant clinical concern among patients with type 2 diabetes mellitus (T2DM) [3].As with other diabetes-related complications, prevention is the best approach to SH management, and identification of associated risk factors is the first essential step. Established risk factors for SH include older age, multiple comorbidities, renal impairment, cognitive dysfunction, CVD, longer duration of diabetes, and intensive glycemic control [4]. Although many studies have examined the associations between these individual factors and SH risk, such clinical characteristics often coexist within a single patient. Previous reports have also shown that certain classes of antidiabetic agents, such as sulfonylureas, insulin, as well as polypharmacy, are associated with an increased risk of hypoglycemia [5]. Compared with patients prescribed a single class, those prescribed three or more classes of glucose-lowering drugs (GLDs) showed approximately a fourfold higher risk of hypoglycemia [5]. Collectively, these findings suggest that as diabetes progresses—characterized by a longer disease duration, a greater need for multiple GLDs, and development of diabetes-related complications—the likelihood of SH increases. Therefore, this study was conducted to investigate this potential relationship.
- METHODS
- METHODS
- Data source
- Data source
We conducted a retrospective cohort study analysis using nationwide, population-based data from the Korean National Health Insurance Service (NHIS). NHIS serves as a single insurer, providing mandatory health insurance to 97% of Koreans, while the Medical Aid program covers the remaining 3% [6,7]. The NHIS database contains diagnostic codes as classified by the International Classification of Disease, 10th revision (ICD–10), medical treatments, procedures, prescriptions, and demographics and socioeconomics, such as age, sex, and income level. The NHIS also provides biennial national health screening to subscribers older than 40 years. The screening data include anthropometric measurements, laboratory tests, and self-reported questionnaires [7].- Study population
- Study population
We analyzed patients with T2DM aged 20 years and above who underwent national health examination programs from January 2015 to December 2016. T2DM was defined as a fasting blood glucose level of 126 mg/dL or higher as measured at the health examination, or the presence of the ICD–10 codes E11 with a prescription for oral GLDs or insulin. Participants with missing data were excluded, resulting in a final cohort of 2,475,605 patients. This study was approved by the Institutional Review Board, College of Medicine, The Catholic University of Korea (MC25ZASI0052). This study was conducted in accordance with the Strengthening the Reporting of Observational Studies in Epidemiology (STROBE) reporting guidelines [8].- Definition of diabetes progression score
- Definition of diabetes progression score
The progression of diabetes was scored based on six components: (1) diabetes duration of ≥ 10 years, (2) use of ≥ 3 oral GLDs, (3) use of insulin, (4) presence of chronic kidney disease (CKD), (5) presence of diabetic retinopathy (DR), and (6) presence of CVD [9–11]. One point was assigned for each component, yielding a total diabetes progression score ranging from 0 to 6. CKD was defined as an estimated glomerular filtration rate (eGFR) < 60 mL/min/1.73 m2 at the health examination or the presence of rare intractable diseases codes (hemodialysis, V001; peritoneal dialysis, V003; kidney transplantation V005) before the index date. The eGFR was calculated using CKD Epidemiology Collaboration method [12]. CVD was defined as prior myocardial infarction (ICD–10 codes I21, I22) or prior stroke (ICD–10 codes I63, I64), diagnosed within 3 years before the index date. DR was defined as the ICD–10 code H36.0 recorded at least once as an inpatient, or twice as an outpatient within 3 years before the index date.- Definition of SH
- Definition of SH
SH was defined using the ICD–10 codes E16.0 and E11.63 with emergency care or hospitalization [13]. All patients were followed from the index date until the occurrence of SH, death, or 1 year after the index date, whichever occurred first.- Covariates
- Covariates
Body mass index (BMI) was calculated as weight (kg) divided by the square of height (m2). Low household income was defined as the lowest quartile or as medical aid beneficiaries. Smoking status, alcohol consumption, and physical activity were assessed using self-reported questionnaires. Alcohol consumption was categorized as heavy (≥ 30 g/day), mild (1–29 g/day), or non-consumption (0 g/day). Regular exercise was defined as performing > 20 min of strenuous physical activity ≥ 3 times per week, or > 30 min of moderate physical activity ≥ 5 times per week. Blood samples were collected after overnight fasting for measurement of serum glucose, total cholesterol, and serum creatinine. Hypertension was defined as a systolic/diastolic blood pressure of 140/90 mmHg or higher, or the presence of the ICD–10 code I10–13 and I15 with a prescription for anti-hypertensive agents. Dyslipidemia was defined as a total cholesterol level of 240 mg/dL or higher, or the presence of the ICD–10 code E78 with a prescription for lipid-lowering agents. The history of SH was defined by the presence of the ICD–10 codes for SH within 3 years before the index date. The glucose-lowering agents analyzed in this study were grouped into 8 classes: insulin, metformin, sulfonylureas, meglitinides, thiazolidinediones, dipeptidyl–peptidase IV inhibitors, sodium–glucose cotransporter–2 inhibitors (SGLT2 inhibitors), and alpha–glucosidase inhibitors. GLP–1 receptor agonists were not considered in the present analysis, due to their very low prescription rate (< 1%).- Statistical analysis
- Statistical analysis
Baseline characteristics were presented as the mean ± standard deviation or number (%) for categorical variables. For non-normally distributed variables, the variables were log-transformed, and presented as geometric means (95% confidence intervals [CI]). Chi-square tests were performed for categorical variables and independent t–tests for continuous variables to analyze differences according to the incidence of SH. The incidence rate of SH was calculated by dividing the number of incident cases by the total follow-up duration (person–years). Kaplan–Meier curves were used to present the cumulative incidence of diagnosed SH according to the diabetes progression score, and the log–rank test was used to assess differences between groups. The Cox proportional hazards regression was used to estimate hazard ratios (HRs) and 95% CIs for SH. The proportional hazards assumption was evaluated using both the Schoenfeld residuals test and a log–log plot. This assumption was found to be satisfied. The multivariable model was adjusted for age, sex, low income, BMI, smoking, alcohol consumption, regular exercise, hypertension, dyslipidemia, history of SH, and fasting glucose. In the analysis of diabetes progression, the model was adjusted for other variables, excluding the components used to calculate the progression. All statistical analyses were performed using SAS software (SAS Enterprise Guide 7.1; SAS Institute Inc., Cary, NC, USA). All statistical tests were two-tailed, and statistical significance was set at p < 0.05.
- RESULTS
- RESULTS
- Baseline characteristics of the study population
- Baseline characteristics of the study population
During the 1-year follow-up, a total of 1,186 SH events were recorded. The baseline characteristics were presented according to the incidence of SH (Table 1). At baseline, patients with incident SH were older, more likely to be female, and had lower income levels. They also used more oral GLDs (except for SGLT2 inhibitors) and insulin, and had a higher prevalence of CVD and DR. In addition, these patients had a lower BMI, fasting blood glucose levels, and eGFR.- Risk of SH according to diabetes progression score components
- Risk of SH according to diabetes progression score components
Each component of the diabetes progression score was significantly associated with an increased risk of SH after adjustment for covariates (Table 2). The risk of SH was 1.47-fold higher in individuals with a diabetes duration of ≥ 10 years than in those with a duration of < 10 years (adjusted HR [aHR]: 1.47, 95% CI: 1.29–1.68). Patients receiving three or more oral GLDs had a 2.07-fold higher risk compared with those receiving fewer than three (aHR: 2.07, 95% CI: 1.84–2.34). Insulin use was associated with a 3.27-fold higher risk of SH compared with non-use (aHR: 3.27, 95% CI: 2.87–3.72). The presence of CKD conferred a 3.16-fold increased risk (aHR: 3.16, 95% CI: 2.78–3.59), while CVD and DR were associated with 1.31-fold (aHR: 1.31, 95% CI: 1.14–1.51) and 1.19-fold (aHR: 1.19, 95% CI: 1.05–1.36) higher risks of SH, respectively.- Risk of SH according to diabetes progression score
- Risk of SH according to diabetes progression score
The Kaplan–Meier curve and log–rank test demonstrated a significant linear trend between higher diabetes progression scores and the incidence of SH (Fig. 1). After adjusting for covariates, an increase in the diabetes progression score was shown to be significantly associated with increased risk of SH (Table 3). Compared with patients who had a diabetes progression score of 0, the risk of SH increased progressively with higher scores: 3.35-fold for a score of 1 (aHR: 3.35, 95% CI: 2.63–4.27), 7.74-fold for a score of 2 (aHR: 7.74, 95% CI: 6.15–9.74), 12.61-fold for a score of 3 (aHR: 12.61, 95% CI: 9.97–15.95), 22.39-fold for a score of 4 (aHR: 22.39, 95% CI: 17.44–28.75), 25.90-fold for a score of 5 (aHR: 25.90, 95% CI: 18.62–35.94), and 45.03-fold for a score of 6 (aHR: 45.03, 95% CI: 25.49–79.55).- Subgroup analyses and sensitivity analyses
- Subgroup analyses and sensitivity analyses
Subgroup analyses were conducted, with patients divided into two groups according to their age, sex, BMI, and history of SH (Fig. 2, Supplementary Table 1). Patients with higher diabetes progression score had a significantly increased risk of SH, compared with those with a score of 0. This association was consistently observed across all subgroups. It was particularly pronounced among younger patients (< 65 years), those with obesity (BMI ≥ 25 kg/m2), and patients without a history of SH (all p for interaction < 0.05), whereas no significant interaction was observed by sex (p for interaction = 0.3189). The HR for younger patients with a score of ≥ 4 was 37.07 (95% CI: 24.50–56.08), while the HR for older patients with a score of ≥ 4 was 17.84 (95% CI: 13.39–23.76). For patients with obesity and a score of ≥ 4, the HR was 34.49 (95% CI: 23.45–50.73), while in patients without obesity, the HR was 18.59 (95% CI: 13.82–25.01). For patients without a history of SH, the HR for a score ≥ 4 was 24.80 (95% CI: 19.40–31.71), while for those with a history of SH was 6.56 (95% CI: 2.03–21.22).We performed two additional sensitivity analyses to confirm the robustness of our findings. Firstly, we used a weighted score based on the regression coefficients derived from the multivariable Cox regression analysis for each component of diabetes progression (Supplementary Table 2). Secondly, we evaluated the long-term follow-up results over a median follow-up period of 7.59 years (Supplementary Table 3). Both sensitivity analyses yielded results that were very similar to those of the primary analysis, showing a consistent and significant increase in the risk of SH with higher scores.
- DISCUSSION
- DISCUSSION
We found that, apart from insulin use, the accumulation of other indicators reflecting diabetes progression was associated with an increased risk of SH. These findings highlight the importance of preventive strategies and patient education to mitigate the risk of SH in such patients. Notably, patients with multiple coexisting complications or overlapping with clinical characteristics indicating diabetes progression exhibited an even higher risk of SH. Beyond insulin use, CKD, a disease duration of more than 10 years, and DR were sequentially associated with an increased risk of SH. More importantly, when these clinical characteristics coexisted in a single patient, the risk of SH was further amplified. Patients with a progression score of 2 or higher demonstrated more than a 7–fold increase in the risk of SH. Those with a score of 3 exhibited a more than 12–fold higher risk. For example, patients with a diabetes duration of ≥ 10 years, CKD, and CVD had an approximately 12–fold increased risk of developing SH.Currently, there is no universally accepted scoring system to quantify diabetes progression [9–11]. This lack of consensus reflects the heterogeneous nature of T2DM, where disease trajectories may vary widely among patients. In this context, our study proposed a pragmatic approach by integrating multiple clinical indicators—such as disease duration, the presence of complications, and treatment intensity—to capture the extent of diabetes progression [9–11]. Previous studies have used a variety of surrogate indicators to reflect diabetes progression, including complication burden, glycemic parameters, treatment intensity, and medication burden [14–16]. Although laboratory measures such as blood glucose and HbA1c are widely used in clinical practice, they may not fully represent cumulative disease severity because they can vary over time. Escalation of glucose-lowering therapy, including the initiation of insulin, often reflects increasing difficulty in glycemic management. Therefore, the number of oral GLDs and the need for insulin therapy may serve as practical markers of disease progression. Likewise, longer diabetes duration has been associated with more advanced disease status and worse clinical outcomes, likely reflecting prolonged exposure to hyperglycemia and an increased risk of vascular and other diabetes-related complications. Based on these considerations, we constructed a simple diabetes progression score using 3 clinical indicators: use of 3 or more oral GLDs, diabetes duration of at least 10 years, and insulin therapy. We further incorporated the number of diabetes-related complications to reflect the cumulative burden of disease progression. In our previous studies, this approach was associated with increased risks of diabetic foot amputation [10] and Parkinson’s disease [9].This concept is also broadly aligned with the recent Korean Diabetes Association framework for severe DM, which integrates both difficulty in glycemic control and disease progression, including glycemic deterioration and complication progression [17]. Severe diabetes was defined as either a metabolic grade ≥ 3, indicating marked insulin deficiency or severe insulin resistance that often requires intensive treatment, including basal-bolus insulin therapy, or a complication stage ≥ 3, indicating overt diabetes-related complications such as CKD with macroalbuminuria and stable angina. In this context, our diabetes progression score was intended as a simple and pragmatic measure that captures treatment intensity together with complication burden. Moreover, we performed a sensitivity analysis using a weighted score based on the regression coefficients derived from the multivariable Cox regression analysis for each component of diabetes progression (Supplementary Table 2). In the weighted score model, the risk of SH also increased consistently and significantly with increasing score, showing findings very similar to those of the original analysis. This is because a simple unweighted score is more practical and easier to apply in routine clinical settings than a more complex weighted calculation. We retained the diabetes progression score constructed by simple counting of diabetes progression components.Importantly, we demonstrated that a higher progression score was strongly associated with an increased risk of SH, one of the most serious adverse events in patients with diabetes. SH is a life-threatening condition that can cause loss of consciousness and CVD, and has a negative impact on health-related quality of life, as well as increased healthcare costs. Most importantly, because prevention is critical in the management of SH, careful evaluation and identification of its risk factors are of paramount importance. In this study, patients who experienced incident SH were more likely to be treated with insulin and sulfonylureas. In addition to these agents, most oral GLDs were more frequently prescribed in the SH group (Table 1). The use of SGLT2 inhibitors was low and did not differ significantly between groups, likely reflecting their relatively recent introduction. Patients with T2DM requiring insulin therapy are generally considered to exhibit indicators of diabetes progression. The intensification of treatment—particularly the initiation of insulin therapy or the use of multiple oral GLDs—often reflects worsening glycemic control and increased insulin resistance, both of which are characteristic features of diabetes progression. Therefore, risk factors for SH may include not only glucose-lowering agents that can induce hypoglycemia, but also the concurrent use of multiple antidiabetic medications—reflecting a more advanced stage of diabetes.In terms of SH risk, CKD, DR, and longer disease duration appeared to be stronger predictors than CVD history. Nevertheless, previous studies have reported that CVD is both a risk factor for SH, and contributes to increased CVD risk and mortality associated with SH [18]. It is plausible that medications administered for the management of CVD may contribute to the risk of SH. Previous studies have reported that the concomitant use of sulfonylureas and beta-blockers was associated with a 53% increase in the risk of SH, compared with the use of sulfonylureas alone [19]. Beta-blockers may lower blood glucose levels by suppressing glycogenolysis and inhibiting hepatic glucose production [19]. In addition, beta-blockers can mask early hypoglycemic symptoms, such as tachycardia, thereby leading to delayed recognition of SH.A history of prior SH also played a critical role, with a HR exceeding 10 (HR: 11.4; 95% CI: 10.8–12.1; fully adjusted model), which was comparable to the elevated risk observed in patients with a progression score of three or more. In analyses stratified by prior SH history, the association between diabetes progression score and SH risk was more pronounced among patients without a prior history of SH. In patients with prior SH, previous SH itself is a strong predictor of subsequent SH, which may have attenuated the relative contribution of the progression score. In contrast, among those without prior SH, the score may function as a more sensitive indicator of future SH risk, resulting in higher HRs. Notably, after adjustment for prior SH history, diabetes progression remained significantly associated with SH risk, suggesting that this relationship was independent of previous SH events. Patients with both prior SH and an elevated diabetes progression score may therefore warrant particularly careful monitoring for recurrent SH.CKD represents a major risk factor for SH, as consistently reported in previous studies [4,20]. In this study, CKD also exhibited the highest HR, apart from insulin use, underscoring the need for heightened vigilance in patients with impaired renal function. Several mechanisms may explain this association: kidney impairment reduces the clearance of hypoglycemic agents, decreases the degradation of insulin in peripheral tissues, impairs renal gluconeogenesis, and alters insulin metabolism, all of which can predispose patients with CKD to hypoglycemia [4,20]. Furthermore, recent studies have reported that participants who experienced SH in the presence of renal impairment had an 11–12-fold higher risk of progressing to end-stage kidney disease compared to those without SH and renal impairment, highlighting the bidirectional relationship between SH and kidney outcomes [20]. The apparent increase in the risk of SH among patients with DR may be explained by other underlying clinical characteristics, as CKD frequently coexists with DR. The evidence that DR per se increases the risk of SH is mixed, and likely confounded by coexisting factors, such as longer diabetes duration, insulin use, and renal impairment. Previous studies have indicated that a history of SH is associated with a higher risk of incident or progressive DR. In retinal cells, glucose deprivation leads to the upregulation of vascular endothelial growth factor [21]. Rapid normalization of glucose status with intensive glucose management was suggested to have a potential role in aggravating the progression of DR, known as ‘early worsening’. The entire mechanism of this early worsening has not been fully elucidated, but hypoglycemia is known to induce changes in blood viscosity and microcirculatory flow, along with white cell activation, vasoconstriction, and the release of inflammatory mediators and cytokines.This study has several limitations. First, HbA1c levels were not measured. Furthermore, some biochemical parameters only reflected information at a single point in time, excluding from the analysis glycemic variability, or changes during treatment. Furthermore, as this study is a retrospective observational study using NHIS claims data, establishing a definitive causal relationship between diabetes progression and SH risk remains challenging. Diabetes-related complications are known risk factors for SH, SH events can also exacerbate these complications. Due to this bidirectional relationship, the potential for reverse causality cannot be entirely excluded in our findings. Future studies should assess actual hypoglycemic exposure time using continuous glucose monitoring, and evaluate impaired hypoglycemic awareness through patient-reported outcomes or structured surveys. Lastly, further validation of the diabetes progression score used in this study is warranted in independent cohorts, such as hospital-based cohorts or prospective community-based cohorts. Nevertheless, the strengths of this study include the assessment of diabetes progression by incorporating information on diabetes complications, medication use, and other clinical factors through the linkage of large-scale nationwide health insurance claims data with health screening information. This comprehensive approach has allowed for a more accurate evaluation of the degree of diabetes progression and its relationship to the risk of SH.In conclusion, the risk of incident SH is notably elevated in individuals with multiple indicators of diabetes progression, such as prolonged duration of diabetes, presence of CKD, and poor glycemic control requiring the use of insulin or multiple oral GLDs. Because prevention is critical in the management of SH, identifying high-risk individuals is of importance. Our findings suggest that, beyond insulin use, patients exhibiting multiple features of advanced diabetes—such as CKD and long disease duration—are at substantially higher risk of developing SH.
- KEY MESSAGE
- KEY MESSAGE
1. A diabetes progression score (ranging from 0 to 6)—based on diabetes duration, number of oral glucose-lowering drugs, insulin use, and the presence of chronic kidney disease, cardiovascular disease, and diabetic retinopathy—significantly increases the risk of incident severe hypoglycemia (SH).2. Among the individual components of the score, insulin use and chronic kidney disease are the most potent predictors of SH risk, with adjusted hazard ratios of 3.27 and 3.16, respectively.3. The risk of SH increases in a stepwise manner as the progression score rises, with patients scoring ≥ 4 exhibiting a more than 22-fold higher risk compared to those with a score of 0.
Supplementary Information
Supplementary Information
- Notes
- Notes
-
CRedit authorship contributions Kyu-Na Lee: investigation, data curation, formal analysis, writing - original draft, writing - review & editing, visualization; Bongseong Kim: methodology, data curation, formal analysis, writing - review & editing, visualization; Mee Kyoung Kim: conceptualization, writing - original draft, writing - review & editing, supervision, project administration; Sukil Kim: methodology, writing - review & editing, supervision, project administration
- Conflicts of Interest
- Conflicts of Interest
-
Conflicts of interest The authors disclose no conflicts.
- Notes
- Notes
-
Funding None
Figure 1
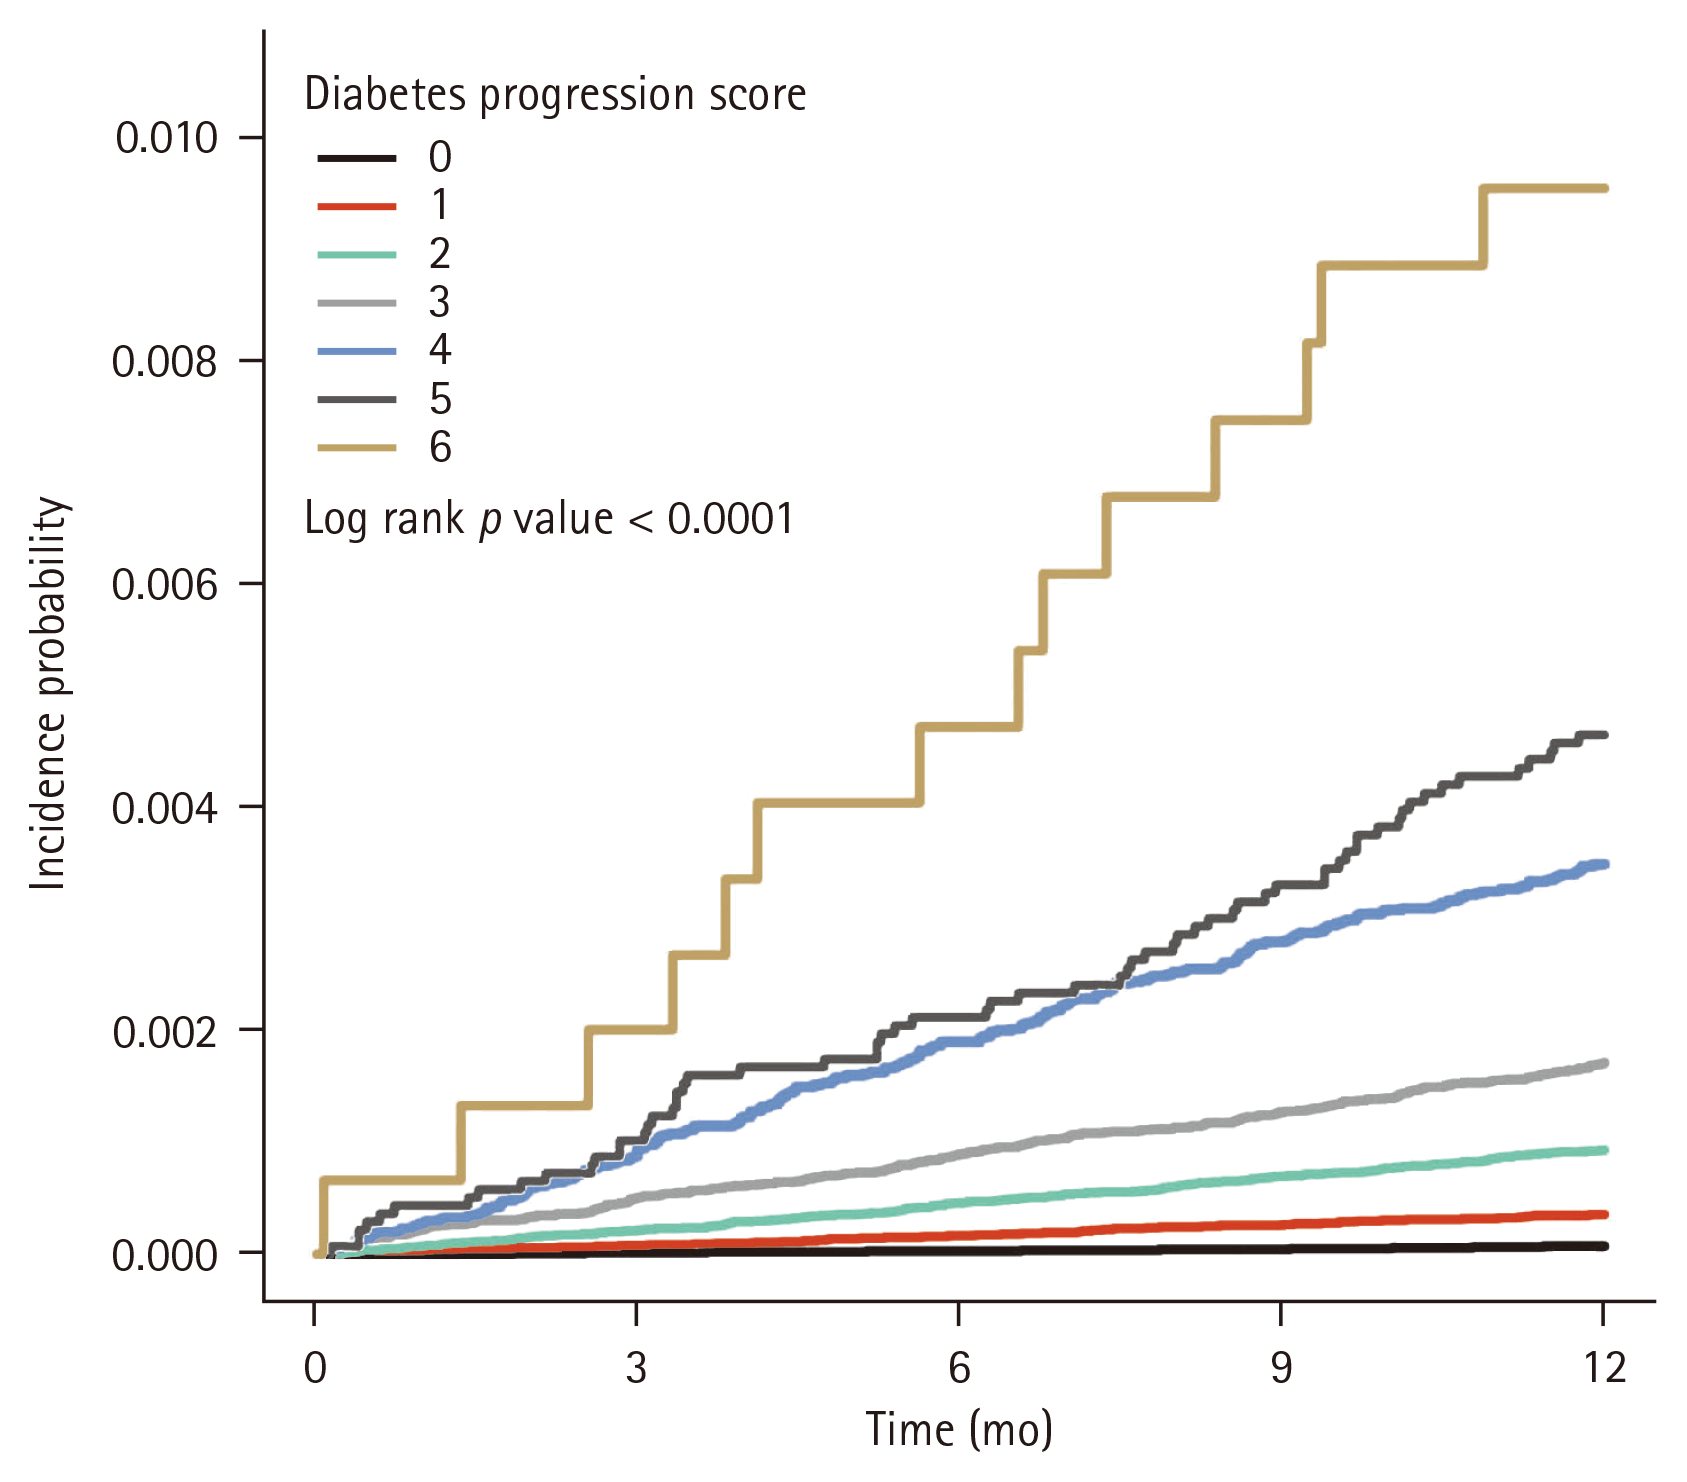
Figure 2
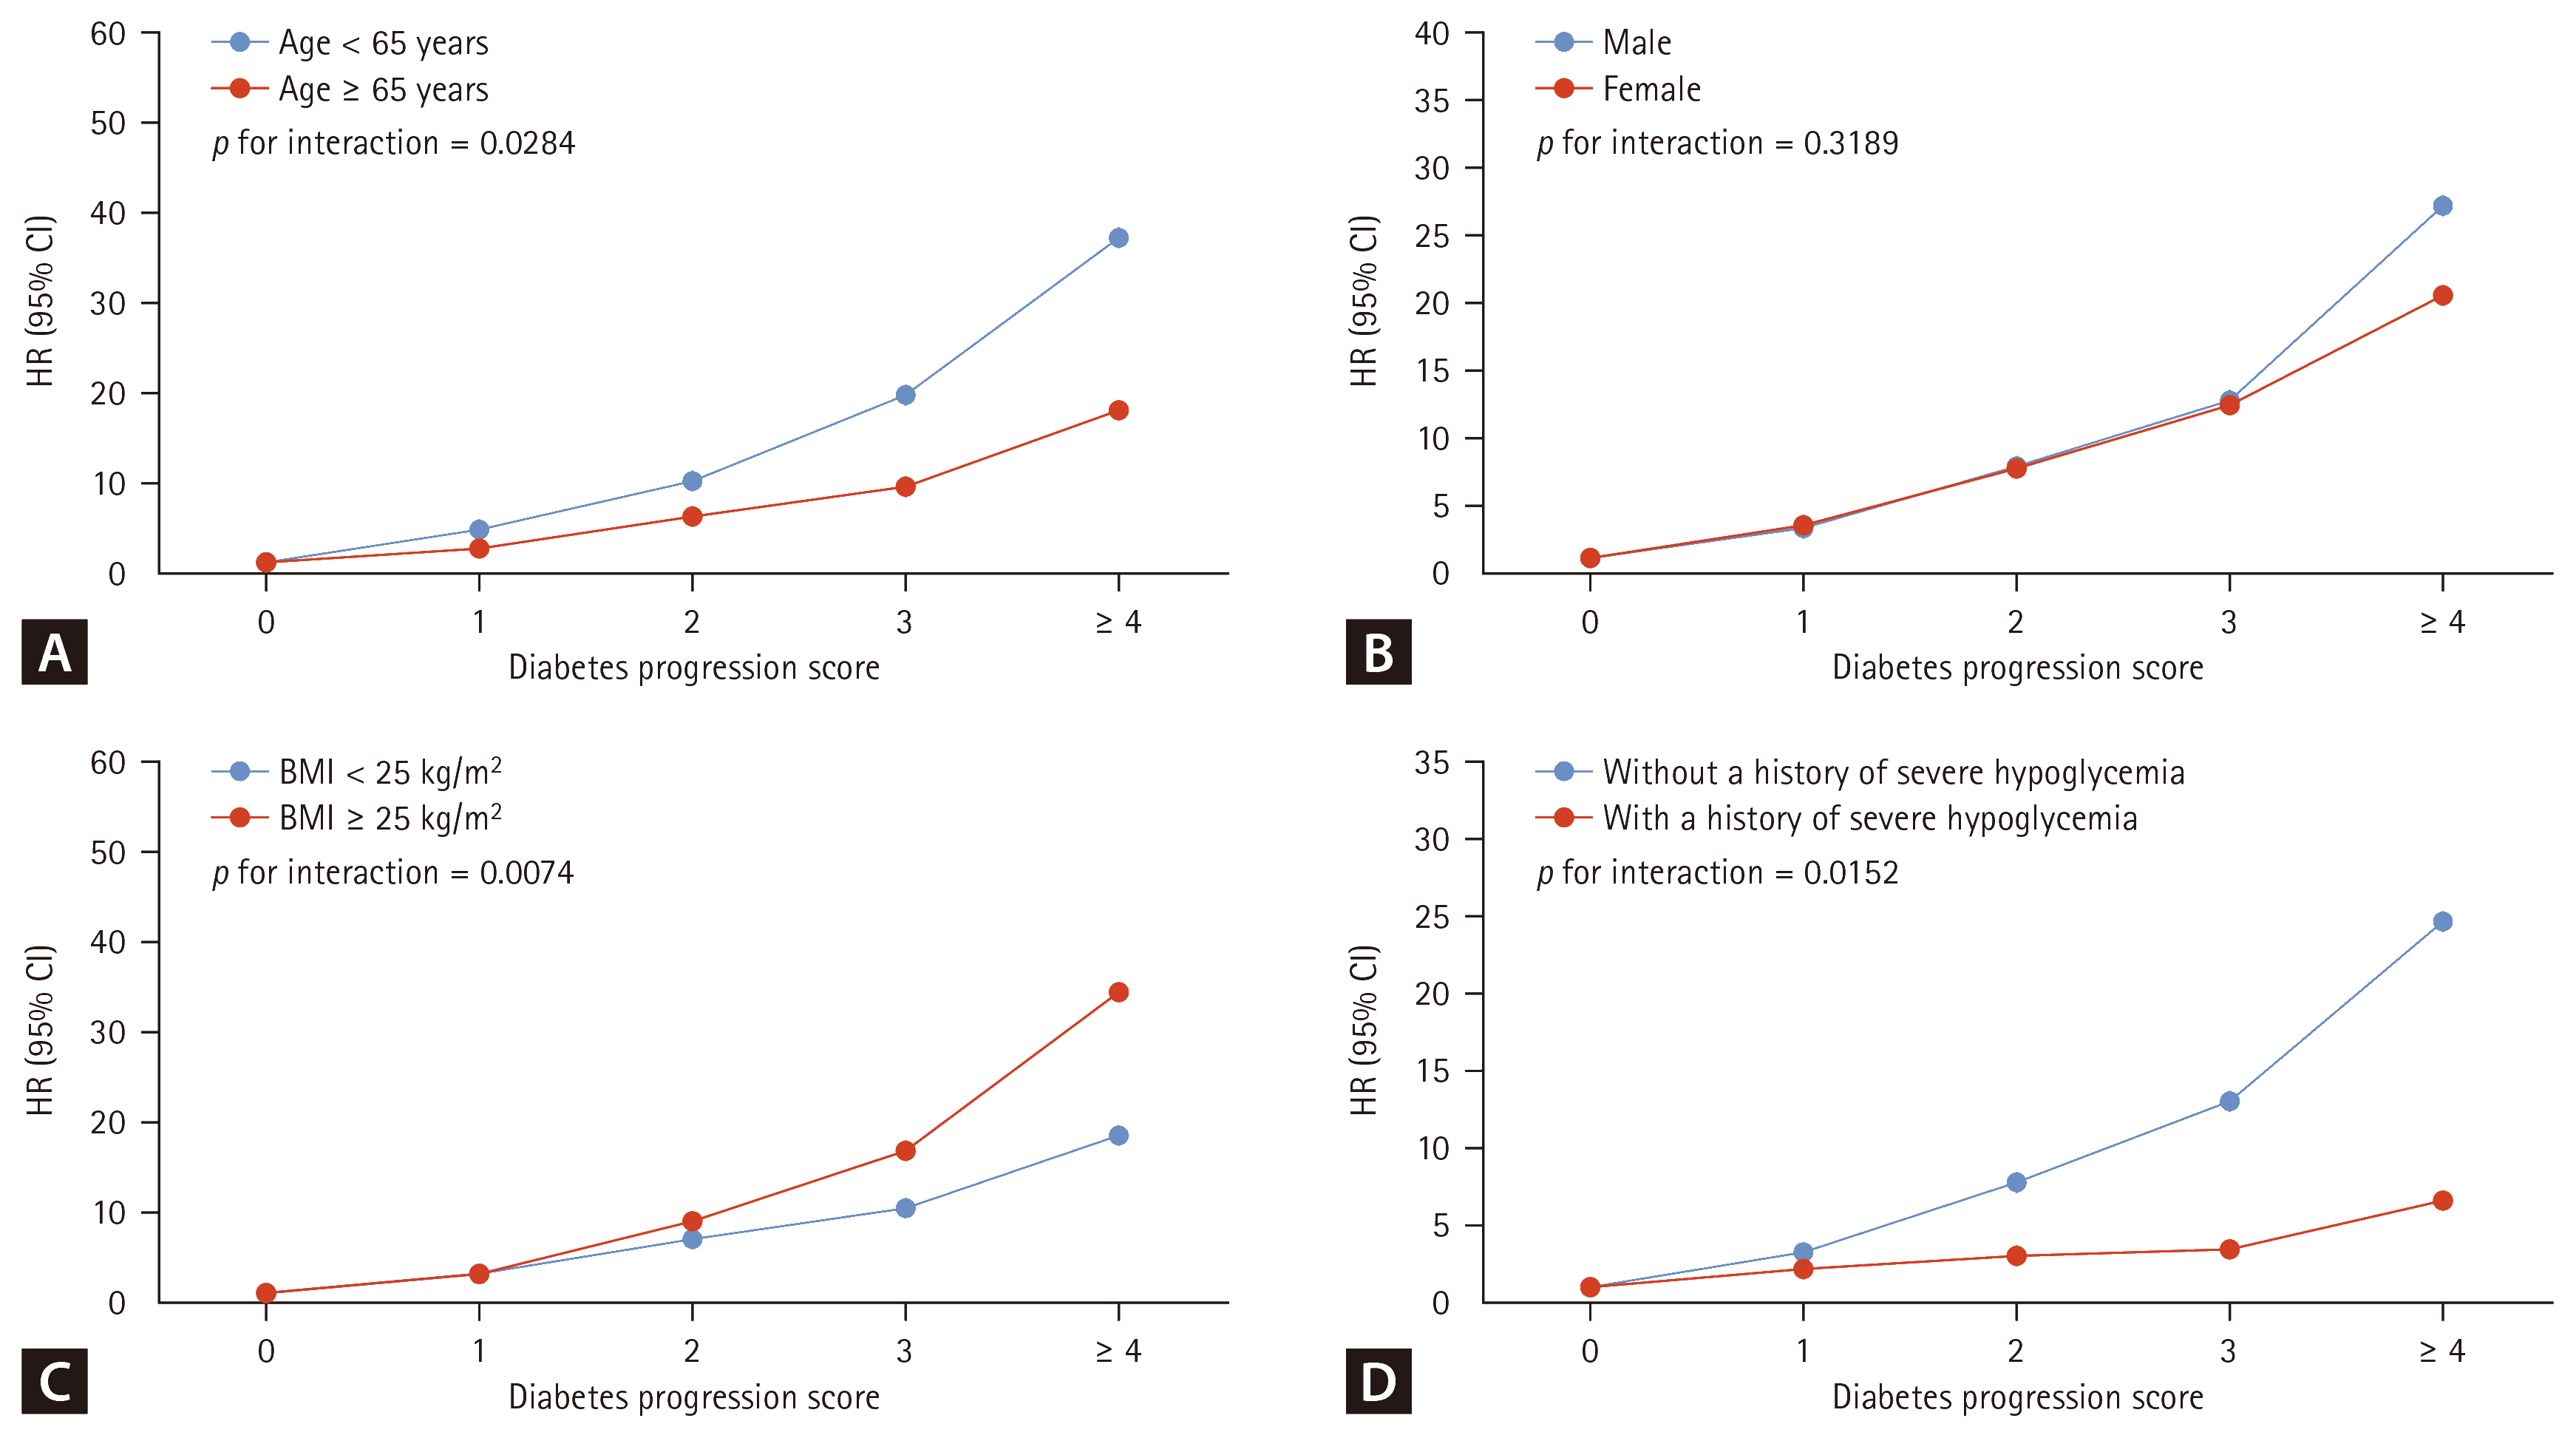
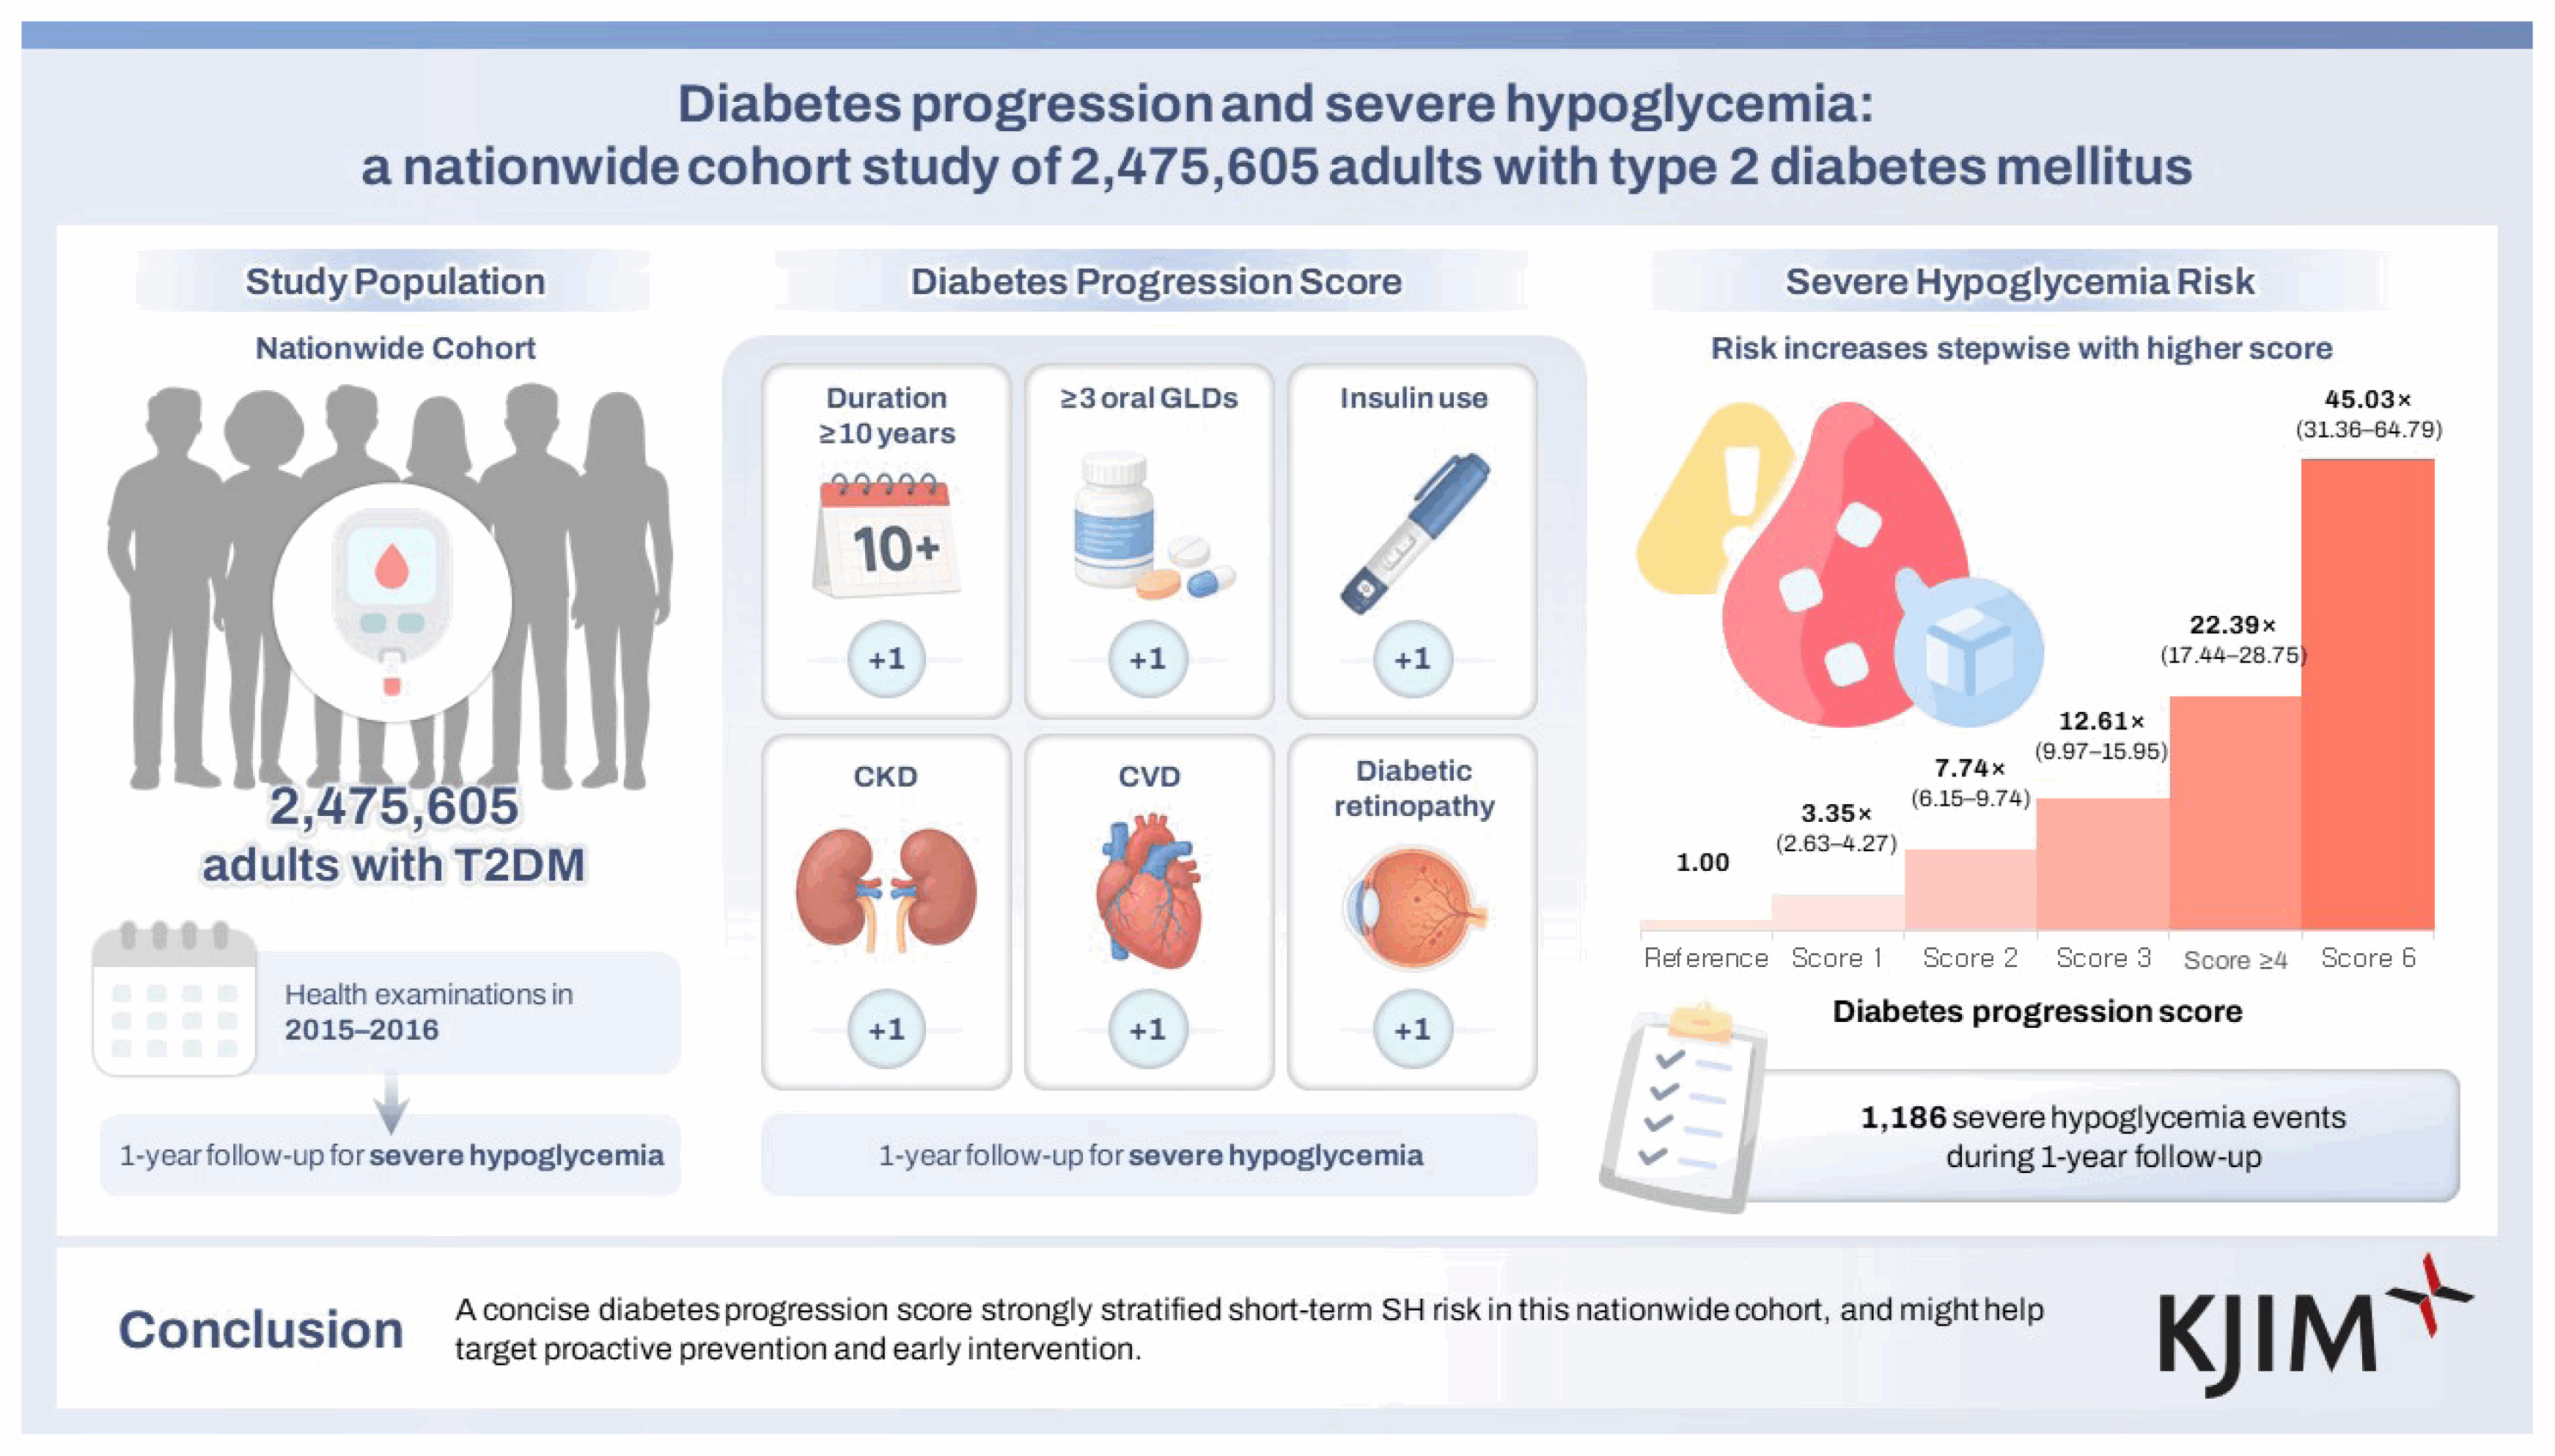
Table 1
Table 2
| Diabetes progression components | Total (n) | Events (n) | IR | Hazard ratioa) (95% confidence interval) |
|---|---|---|---|---|
| Duration of diabetes | ||||
| < 10 yr | 1,899,099 | 487 | 0.26 | 1 (reference) |
| ≥ 10 yr | 576,506 | 699 | 1.22 | 1.47 (1.29, 1.68) |
| Number of oral glucose-lowering drugs (GLDs) | ||||
| < 3 | 1,946,599 | 628 | 0.32 | 1 (reference) |
| ≥ 3 | 529,006 | 558 | 1.06 | 2.07 (1.84, 2.34) |
| Use of insulin | ||||
| No | 2,284,608 | 738 | 0.32 | 1 (reference) |
| Yes | 190,997 | 448 | 2.37 | 3.27 (2.87, 3.72) |
| Chronic kidney disease | ||||
| No | 2,264,103 | 642 | 0.28 | 1 (reference) |
| Yes | 211,502 | 544 | 2.60 | 3.16 (2.78, 3.59) |
| Cardiovascular disease | ||||
| No | 2,265,615 | 900 | 0.40 | 1 (reference) |
| Yes | 209,990 | 286 | 1.38 | 1.31 (1.14, 1.51) |
| Diabetic retinopathy | ||||
| No | 2,150,049 | 796 | 0.37 | 1 (reference) |
| Yes | 325,556 | 390 | 1.20 | 1.19 (1.05, 1.36) |
a) Adjusted for age, sex, body mass index, low income, smoking, alcohol consumption, regular exercise, hypertension, dyslipidemia, history of severe hypoglycemia, fasting glucose, and each of the diabetes progression components (duration of diabetes, number of oral GLDs, insulin, chronic kidney disease, cardiovascular disease, diabetic retinopathy–except for same component).
Table 3
| Diabetes progression score | Total (n) | Events (n) | IR | Hazard ratioa) (95% confidence interval) |
|---|---|---|---|---|
| 0 | 1,345,459 | 100 | 0.07 | 1 (Ref.) |
| 1 | 552,783 | 199 | 0.36 | 3.35 (2.63, 4.27) |
| 2 | 333,007 | 311 | 0.94 | 7.74 (6.15, 9.74) |
| 3 | 169,333 | 291 | 1.73 | 12.61 (9.97, 15.95) |
| 4 | 59,844 | 208 | 3.51 | 22.39 (17.44, 28.75) |
| 5 | 13,689 | 63 | 4.68 | 25.90 (18.62, 35.94) |
| 6 | 1,490 | 14 | 9.64 | 45.03 (25.49, 79.55) |
- References
- References
REFERENCES
1. Seaquist ER, Anderson J, Childs B, et al. Hypoglycemia and diabetes: a report of a workgroup of the American Diabetes Association and the Endocrine Society. Diabetes Care 2013;36:1384–1395.
[Article] [PubMed] [PMC]2. Lopez JM, Annunziata K, Bailey RA, Rupnow MF, Morisky DE. Impact of hypoglycemia on patients with type 2 diabetes mellitus and their quality of life, work productivity, and medication adherence. Patient Prefer Adherence 2014;8:683–692.
[Article] [PubMed] [PMC]3. Yun JS, Han K, Ko SH. Trends of severe hypoglycemia in patients with type 2 diabetes in Korea: a longitudinal nationwide cohort study. J Diabetes Investig 2022;13:1438–1443.
[Article] [PubMed] [PMC]4. Yun JS, Ko SH. Risk factors and adverse outcomes of severe hypoglycemia in type 2 diabetes mellitus. Diabetes Metab J 2016;40:423–432.
[Article] [PubMed] [PMC]5. Lee SE, Kim KA, Son KJ, et al. Trends and risk factors in severe hypoglycemia among individuals with type 2 diabetes in Korea. Diabetes Res Clin Pract 2021;178:108946.
[Article] [PubMed]6. Seong SC, Kim YY, Khang YH, et al. Data resource profile: The National Health Information Database of the National Health Insurance Service in South Korea. Int J Epidemiol 2017;46:799–800.
[PubMed] [PMC]7. Kim MK, Han K, Lee SH. Current trends of big data research using the Korean National Health Information Database. Diabetes Metab J 2022;46:552–563.
[Article] [PubMed] [PMC]8. von Elm E, Altman DG, Egger M, et al. The Strengthening the Reporting of Observational Studies in Epidemiology (STROBE) statement: guidelines for reporting observational studies. Lancet 2007;370:1453–1457.
[Article] [PubMed] [PMC]9. Han K, Kim B, Lee SH, Kim MK. A nationwide cohort study on diabetes severity and risk of Parkinson disease. NPJ Parkinsons Dis 2023;9:11.
[Article] [PubMed] [PMC]10. Yu J, Kim JH, Kim B, et al. The severity of diabetes and the risk of diabetic foot amputation: a national cohort study. Endocrinol Metab (Seoul) 2025;40:574–582.
[Article] [PubMed] [PMC]11. Yu J, Kim B, Han K, Kim MK. Diabetes progression and its impact on kidney cancer risk: insights from a longitudinal Korean cohort study. J Clin Endocrinol Metab 2025;111:e125–e133.
[Article] [PubMed]12. Inker LA, Eneanya ND, Coresh J, et al. New creatinine- and cystatin C-based equations to estimate GFR without race. N Engl J Med 2021;385:1737–1749.
[Article] [PubMed] [PMC]13. Han K, Yun JS, Park YM, et al. Development and validation of a risk prediction model for severe hypoglycemia in adult patients with type 2 diabetes: a nationwide population-based cohort study. Clin Epidemiol 2018;10:1545–1559.
[Article] [PubMed] [PMC]14. Zghebi SS, Panagioti M, Rutter MK, et al. Assessing the severity of Type 2 diabetes using clinical data-based measures: a systematic review. Diabet Med 2019;36:688–701.
[Article] [PubMed]15. Zghebi SS, Mamas MA, Ashcroft DM, et al. Development and validation of the DIabetes Severity SCOre (DISSCO) in 139 626 individuals with type 2 diabetes: a retrospective cohort study. BMJ Open Diabetes Res Care 2020;8:e000962.
[Article] [PubMed] [PMC]16. Aminian A, Brethauer SA, Andalib A, et al. Individualized metabolic surgery score: procedure selection based on diabetes severity. Ann Surg 2017;266:650–657.
[PubMed]17. Bae JH, Choe HJ, Yang YS, et al. Defining severe diabetes mellitus: a consensus framework for grading and staging diabetes based on pathophysiology and complications. Diabetes Metab J 2025;49:1141–1154.
[Article] [PubMed] [PMC]18. Yun JS, Park YM, Han K, Cha SA, Ahn YB, Ko SH. Severe hypoglycemia and the risk of cardiovascular disease and mortality in type 2 diabetes: a nationwide population-based cohort study. Cardiovasc Diabetol 2019;18:103.
[Article] [PubMed] [PMC]19. Dimakos J, Cui Y, Platt RW, Renoux C, Filion KB, Douros A. Concomitant use of sulfonylureas and β-blockers and the risk of severe hypoglycemia among patients with type 2 diabetes: a population-based cohort study. Diabetes Care 2023;46:377–383.
[Article] [PubMed]