


INTRODUCTION
Gestational diabetes mellitus (GDM) is an abnormal glucose intolerance status that is discovered during pregnancy [1]. Although GDM has a relatively high prevalence (3% to 8%) in Western countries, its prevalence in Asian countries is increasing, and ranges from 1.7% to 3.9% in Korea [2]. An increased risk of GDM is associated with obesity, age > 30 years, family history of diabetes, and glucosuria [3].
GDM is not only associated with adverse pregnancy outcomes, which include macrosomia, dystocia, birth trauma, and metabolic complications in newborns [4], but it is also a strong predictor of risk for impaired glucose tolerance and transitioning to overt type 2 diabetes postpartum [5]. In addition, GDM is similar to type 2 diabetes in terms of pathophysiology, in that insulin resistance is the primary factor [6]. Therefore, the pathophysiology of GDM is important for understanding type 2 diabetes and assessing its associated risk factors.
Recently, Endo et al. [7] found that the insulin sensitivities of overweight women with normal glucose tolerance (NGT) and women with GDM were lower than those of normal weight women with NGT, and that insulin sensitivity in women with GDM worsened as gestation progressed. Furthermore, Retnakaran et al. [8] have reported that GDM, or indeed any degree of abnormal glucose homeostasis in pregnancy, independently predicts an increased risk of postpartum glucose intolerance.
However, there are few reports of the insulin sensitivities and secretion capacities of pregnant women in Korea. In the present study, we examined the differences in the insulin sensitivity and secretion index between women with NGT, gestational impaired glucose tolerance (GIGT), and GDM. We also evaluated the clinical and metabolic phenotypes of women with GIGT in relation to the timing of isolated hyperglycemia during gestation.
METHODS
Study subjects
Between January 2004 and August 2006, all pregnant women who visited the Cheil General Hospital & Women's Healthcare Center were screened at 24 to 28 weeks of gestation for GDM using a universal two-step GDM screening program. This study was approved by the Cheil General Hospital & Women's Healthcare Center Ethics Committee and the Institutional Review Boards at each study site, and written informed consent was obtained from all participants. The study was performed according to the Good Clinical Practice guidelines and the Declaration of Helsinki.
The first step was a 50-g glucose challenge test. Women who had a positive result were followed up with a 3-hour 100-g oral glucose tolerance test (OGTT) according to the criteria outlined by Carpenter and Coustan [9]. Thus, the fasting plasma glucose level was < 5.3 mmol/L, the 1-hour plasma glucose level was < 10 mmol/L, and the 2-hour and 3-hour plasma glucose levels were 8.6 and 7.8 mmol/L, respectively.
In total, 1,163 pregnant women were selected for participation in this study. Based on the OGTT results, these selected patients were stratified into the following three glucose tolerance groups: 1) NGT (no abnormal value in the 3-hour 100-g OGTT, as defined by Carpenter and Coustan); 2) GIGT (only one abnormal value according to the Carpenter and Coustan criteria); and 3) GDM (at least two abnormal values according to the Carpenter and Coustan criteria).
In the GIGT group, there were three heterogeneous subgroups stratified by the criteria for 1-hour, 2-hour, and 3-hour abnormal values. Nine women had an abnormal fasting glucose value only, but these subjects were few in number and had heterogeneous metabolic profiles. Therefore, these patients were excluded from the subgroup analysis.
Laboratory measurements and assessments
Anthropometric measurements, including prepregnancy body weight, parity, and history of type 2 diabetes among first-degree relatives were recorded. The prepregnancy body mass index (BMI) of each study subject was calculated as weight/height2 (kg/m2). Blood samples were drawn after a 12-hour overnight fast and stored at -80℃ until laboratory analysis. A glucose oxidase method (YSI 2300-STAT, Yellow Springs Instrument Co., Yellow Springs, OH, USA) was used to determine plasma glucose levels, and a radioimmunoassay kit (Linco Research Inc., St. Louis, MO, USA) was used to measure insulin levels.
Measurements of insulin secretion and sensitivity index
Insulin resistance was calculated using the homeostasis model assessment (homeostasis model assessment of insulin resistance, HOMA-IR) [10,11]. Insulin sensitivity index (ISOGTT) values were calculated as described previously [12]. We also used the quantitative insulin sensitivity check index (QUICKI) to evaluate insulin resistance using the mathematical formula described previously [13]. Homeostasis model assessment for estimation of index β-cell secretion (HOMA-B), the index of insulin secretion capacity, was calculated as follows: HOMA-B = 20 × fasting plasma insulin (µU/mL) / (fasting plasma glucose [mmol/L] - 3.5).
The total area under curve (AUC) for glucose and AUC for insulin from premeal to 120 minutes were calculated using the trapezoidal rule. Estimated first and second phase insulin values were calculated according to the Stumvoll index, as described previously [14]. We also calculated the insulin secretion-sensitivity index (ISSI) for insulin secretion capacity, as described previously [15]. The formulae used in the calculations are summarized in Supplementary Table 1 online.
Statistical analysis
Data are expressed as means ± SD, medians (interquartile range), or percentages (%). Differences between groups were assessed using one-way analysis of variance (ANOVA) or the Kruskal-Wallis test for continuous variables. Tukey's multiple comparison test and the Wilcoxon rank-sum test were used for multiple comparisons. The Bonferroni correction was used to adjust for multiple comparisons. Fisher's exact test or Pearson's chi-squared test was used to analyze categorical variables. Data were analyzed using the SPSS version 12.0 for Windows software (SPSS Inc., Chicago, IL, USA). A p value < 0.05 was considered to indicate statistical significance.
RESULTS
Patients' characteristics
The clinical and biochemical characteristics of the study subjects are shown in Table 1. There were 588 (50.5%) NGT subjects, 306 (26.3%) GIGT subjects, and 269 (23.1%) GDM subjects, for a total of 1,163 participants. The subjects in the GDM group were on average older than those in the NGT group and they had significantly higher prepregnancy BMI values than the other two groups. Furthermore, the subjects in the GDM group were more likely to have a family history of diabetes, a higher glucose value in the 50-g oral glucose challenge test (OGCT), and increased blood pressure. However, the percentage of nulliparous participants was significantly lower in the GDM group.
Metabolic parameters based on the 100-g OGTT
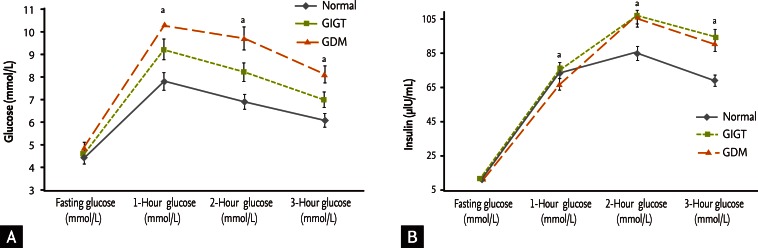
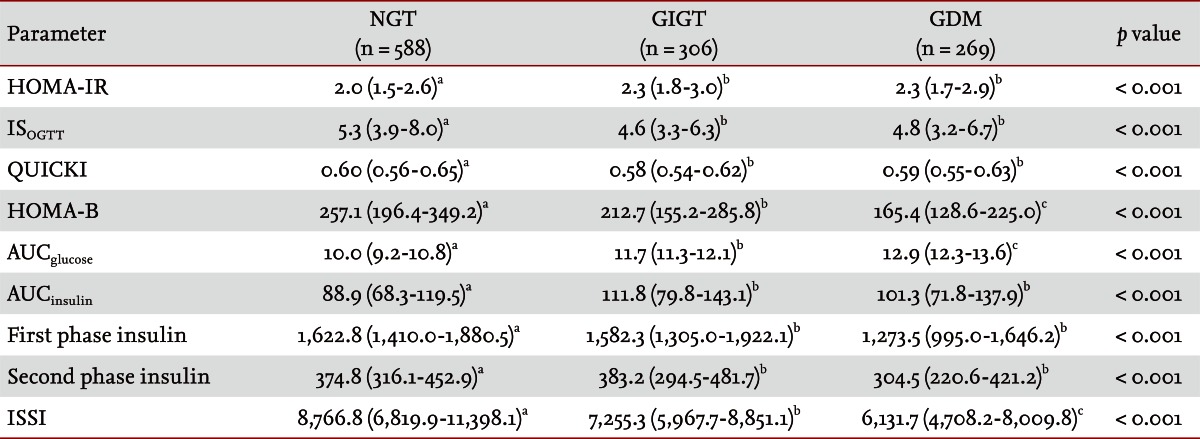
In the 100-g OGTT, the glucose levels showed a gradual increase from the NGT group to the GDM group (Fig. 1A). However, the insulin levels were significantly higher in the GIGT group than in the GDM group, except for fasting insulin (Fig. 1B). The insulin resistance index values were significantly worse in the GDM group than in the GIGT group; the HOMA-IR gave the following results: NGT 2.0 (1.5 to 2.6) versus GIGT 2.3 (1.8 to 3.0) versus GDM 2.3 (1.7 to 2.9) (p < 0.001). The QUICKI results were similar. The ISOGTT values were: NGT 5.3 (3.9 to 8.0) versus GIGT 4.6 (3.3 to 6.3) versus GDM 4.8 (3.2 to 6.7) (p < 0.001).
Moreover, the insulin secretion index values were significantly lower in the GDM group than in the other two groups (Table 1). The HOMA-B values, which reflect β-cell function, were progressively lower in the order of: NGT, GIGT, GDM (p < 0.001). The average ISSI values were as follows: for the NGT group, 8,766.8 (6,819.9 to 11,398.1); for the GIGT group, 7,255.3 (5,967.7 to 8,851.1); and for the GDM group, 6,131.7 (4,708.2 to 8,009.8) (p < 0.001) (Table 2).
Subjects' characteristics with respect to one abnormal value on the 100-g OGTT
Among the GIGT subjects, the 2-hour abnormal values subgroup was the largest (135 subjects, 44% of the total GIGT subjects). The 1-hour abnormal values group and the 3-hour abnormal values group had similar numbers of subjects. Importantly, the 1-hour abnormal values group showed a significantly higher weight gain during pregnancy, and the values of the 50-g OGCT for this group were higher than those for the other two groups. Although the HOMA-IR values showed differences between the groups by tests, the median values for the 1-hour abnormal values group and 3-hour abnormal values group were the same. The 1-hour and 2-hour abnormal values groups showed poorer insulin secretion, according to the decreased HOMA-B, although the first phase insulin values of the 2-hour abnormal values group were higher than those of the other two groups (Table 3).
DISCUSSION
To the best of our knowledge, this is the first report of the insulin sensitivity and secretion index of pregnant Korean women. The present study shows that GIGT patients already have deteriorated insulin sensitivity and decreased insulin secretion. In previous studies, not only GDM, but also GIGT status resulted in perinatal complications [16,17]. These results implicated GIGT as an early, albeit serious, condition that led to neonatal complications and serious perinatal outcomes. In addition, GIGT has also been proposed as an important risk factor for type 2 diabetes after delivery. Indeed, the 1-hour abnormal values group had higher weight gain during pregnancy, higher values in the 50-g OGTT, and higher HOMA-IR values than the other groups, and the 1-hour and 2-hour abnormal values groups had lower HOMA-B values than the 3-hour abnormal values group.
Previously, Buchanan et al. [18] reported on mild gestational diabetes characterized by an impairment of pancreatic β-cell function, and Ryan and colleagues [19] studied 14 women with normal oral glucose tolerance who had a history of GDM. Both studies reported that women who had a history of GDM showed defects in insulin secretion and activity. However, these studies were conducted after delivery, and few studies have analyzed insulin secretion, resistance, and sensitivity during pregnancy. Kwak et al. [20] reported that GDM recurred in almost 50% of subsequent pregnancies in Korean women, and that fasting glucose at 2-month postpartum may be a clinically valuable predictor of risk for recurrent GDM. They also reported mean HOMA-IR values of 2.2 to 3.2 for Korean women who had a history of GDM; these values are not markedly different from those obtained in the present study (median HOMA-IR of 2.3 in GDM subjects).
As the pathophysiology of GDM is similar to that of type 2 diabetes, we cautiously suggest that our results demonstrate that the insulin secretion and sensitivity capacities of Asian women are different from those of women in Western countries. Since even nonobese Asians were found to exhibit onset of type 2 diabetes at a younger age, insulin secretion appears to be a major factor in the development of type 2 diabetes in Asian populations [21]. In Asians, the pancreatic β-cell mass is relatively smaller than in Westerners, and insulin secretion capacity is also lower. In addition, abdominal obesity is more common in Asians than in Westerners with similar body weights. These pathophysiologic differences with regard to type 2 diabetes may explain the early onset of impaired glucose tolerance in Asian countries [21]. In the present study, the GIGT group had insulin deficiency compared with the NGT group. There are many pathophysiologic similarities between gestational glucose impairment and gestational diabetes. However, further studies are warranted to elucidate the factors that aggravate glucose tolerance status in Asians, and more specifically, Koreans.
In the present study, the 1-hour abnormal values group had significantly higher weight gain during pregnancy and higher values in the 50-g OGCT than did the other two groups. Moreover, the 1-hour abnormal values group had worse insulin resistance. This finding is consistent with that reported in a study conducted by Retnakaran et al. [22]. In 2010, the International Association of Diabetes and Pregnancy Groups proposed a new set of criteria, based on the incidence of adverse perinatal outcomes, as assessed in the Hyperglycemia and Adverse Pregnancy Outcomes study [23,24]. According to these criteria, a diagnosis of GDM is made if at least one plasma glucose concentration is equal to or exceeds the thresholds of 92, 180, and 153 mg/dL after fasting, and at 1-hour and 2-hour after glucose loading, respectively, in the 75-g OGTT [25]. Our findings support the criteria used for the diagnosis of GDM, as we show that the 1-hour and 2-hour abnormal values groups had worsened HOMA-B, and even the 1-hour abnormal values group had a higher HOMA-IR value.
The present study has certain limitations. First, we were unable to analyze perinatal outcomes. Second, a follow-up to the 75-g OGTT could not be conducted. However, our study comprised many gestational subjects and few articles describe insulin secretion and resistance in GIGT and gestational diabetes and NGT in Korea. In addition, we intend to study postpartum glucose tolerance status and other perinatal outcomes of insulin sensitivity status to this work.
In conclusion, the GDM group showed decreased insulin secretion and increased insulin resistance. Furthermore, the GIGT group already showed β-cell dysfunction and decreased insulin sensitivity, in contrast to the NGT group. Further studies involving more patients and follow-up periods of longer duration are needed to assess the metabolic profiles of GIGT and GDM patients.
KEY MESSAGE
1. Gestational diabetes mellitus (GDM) is associated with adverse pregnancy outcomes, metabolic complications in newborn and strong predictor of risk for impaired glucose tolerance and transitioning to overt type 2 diabetes postpartum.
2. In previous studies, not only GDM but also gestational impaired glucose tolerance (GIGT) status resulted in perinatal complications. Our study also showed that GIGT patients already had deteriorated insulin sensitivity and decreased insulin secretion in Korean women.


 PDF Links
 PubReader
 ePub Link
 Full text via DOI
 Download Citation
 Print
Print


