


INTRODUCTION
Iodine is an essential element for thyroid hormone synthesis; its deficiency and excess are associated with thyroid dysfunction and disease [1-4]. Korea is an iodine-replete area and a recent population-based study using data from the Korean National Health and Nutrition Examination Survey (KNHANES) revealed a higher iodine intake in Korea than that in many other countries [5-7]. In addition, previous studies have reported a high iodine intake among school-age children and adolescents in Korea [6,8]; the median urinary iodine concentration (UIC) in the reference Korean population was 298.5 ╬╝g/L (interquartile range [IQR], 160.2 to 694.1) and 49.9% of the population had an iodine excess status according to the World Health Organization (WHO) classification [6]. Furthermore, the UICs were higher among adolescents (median, 431.9 ╬╝g/L) and old adults (median, 412.5 ╬╝g/L) than among other age groups; however, the exact reason for the high iodine intake in these age groups is uncertain.
The major sources of dietary iodine include milk, eggs, dairy products, fish, seaweed, sea mustard, sea tangle, kelp, laver, and sea salt [9,10]. However, no study has thus far examined the association between iodine level and sea salt intake. The major source of iodine in Korea could be sea salt, as sea salt is usually used for making traditional Korean foods such as kimchi, soy sauce, and soybean paste. The sodium intake among Koreans is higher than that recommended by the WHO [11-14]. If sea salt is the major source of iodine, there may be an association between sodium intake and iodine status in Korea. A small pilot study in Korea reported lower UIC and urinary sodium concentration in the young population (age, 19 to 35 years) than those in the older population, suggesting a possible correlation between the UIC and urinary sodium concentration [15]. However, no population-based study representing Korean civilians has thus far evaluated the association between the UIC and urinary sodium concentration in different age groups. Therefore, this study aimed to evaluate the association between the iodine status and urinary sodium concentration in the Korean population using data from the KNHANES VI (2014 to 2015).
METHODS
Data source and study population
This study analyzed data from KNHANES VI-2 and VI-3 (2014 to 2015). The KNHANES is conducted by the Korean Centers for Disease Control and Prevention and is an ongoing surveillance system that assesses the health and nutritional status of the Korean population, monitors trends in health risk factors and the prevalence of major chronic diseases, and provides data for the development and evaluation of health policies and programs in Korea [7]. This nationwide, population-based, cross-sectional survey selected a representative sample of the civilian, non-institutionalized Korean population by using a stratified, multistage, clustered probability sampling design. To generate the KNHANES data, physical examinations, clinical and laboratory tests, and personal interviews were performed. From 2014 to 2015, spot urine samples were collected, and the iodine, sodium, and creatinine concentrations were measured.
We included subjects aged 10 to 75 years who had available data on urinary iodine, sodium, and creatinine concentrations as well as dietary sodium intake. Subjects with a serum creatinine level > 1.2 mg/dL (men) or 1.1 mg/dL (women) were excluded. A disease-free population was defined as subjects with no prior thyroid disease or thyroid cancer and no history of taking medicines that could influence thyroid function based on the results of a questionnaire survey. The KNHANES obtained written informed consent from every participant prior to completing the survey, and secondary anonymized data were used for analysis. The study protocol was approved by the Institutional Review Board of the Asan Medical Center, Seoul, Korea (2017-1353).
Dietary sodium intake and urinary sodium/creatinine ratio
The dietary sodium intake in the KNHANES was evaluated using the 24-hour recall method with well-established questionnaires. Based on the WHO guidelines and a previous study [16], we divided the participants into three groups according to their daily dietary sodium intake levels (mg/day): < 2,000, 2,000 to 5,000, and > 5,000. The urinary sodium concentration was measured using an Ion-Selective Electrode (Hitachi Automatic Analyzer 7600, Hitachi, Tokyo, Japan). To correct for the effects of urinary dilution, we used the creatinine-adjusted value as the urinary sodium/creatinine (Na/Cr) ratio (mmol [Na]/g [Cr]). Using the lowest and highest quantiles in the population as cutoffs, the urinary Na/Cr ratio was categorized into three groups: low (< 47 mmol/g), intermediate (47 to 114 mmol/g), and high (> 114 mmol/g).
UICs and iodine/creatinine ratio
The UICs were determined using inductively coupled plasma mass spectroscopy (Perkin Elmer, Waltham, MA, USA). The WHO classification defines iodine deficiency an UIC < 100 ╬╝g/L, adequate intake/more-than-adequate as an UIC of 100 to 299 ╬╝g/L, and an excessive iodine intake as an UIC > 300 ╬╝g/L [17]. The urinary iodine/creatinine (I/Cr) ratio (╬╝g [iodine]/g [Cr]) was used to adjust for variable water excretion rates at the time of spot urine specimen collection. A previous study showed that the urinary I/Cr ratio had a significant diagnostic value for evaluating iodine intake [18]. In our study population, there was a significant association between the UIC and urinary I/Cr ratio (Supplementary Fig. 1). Values of 100 and 300 ╬╝g/L UIC corresponded to a urinary I/Cr ratio of 85 and 220 ╬╝g/g, respectively. Based on these findings, we defined the iodine status using the urinary I/Cr ratio as follows: iodine deficiency (< 85 ╬╝g/g), adequate iodine intake (85 to 220 ╬╝g/g), and excessive iodine intake (> 220 ╬╝g/g).
Statistical analysis
All statistical analyses were conducted using RStudio version 1.0.153, the R library Survey, and Cairo packages (RStudio Inc., Boston, MA, USA; http://www.rstudio.com/). Using the KNHANES data-analysis guidelines, the data were weighted, stratified, and clustered. Because the KNHANES IV data were collected from 2013 to 2015, we assigned a weight of 192/384 to data for 2 years (2014 to 2015) in order to calculate the weighted frequency according to the guidelines. The weighted data were considered unbiased estimates representing the entire Korean population.
Continuous variables were presented as medians with IQRs, and categorical variables were presented as numbers with percentages. The characteristics were compared using chi-square test or multivariate logistic linear regression analysis after adjusting for age and sex. The p values were two-sided, and p < 0.05 were considered statistically significant.
RESULTS
Baseline characteristics of the study subjects
The baseline characteristics of the 3,645 subjects (1,817 men [52.5%], 1,828 women [47.5%], 29,532,753 weighted subjects) are presented in Table 1. The median age was 41 years (IQR, 25 to 56); 12.0% were aged 10 to 18 years, 18.5% were 19 to 29 years, 25.2% were 30 to 44 years, 26.8% were 45 to 59 years, and 17.5% subjects were 60 to 75 years. There were 1,141 obese participants (32.0%) (body mass index [BMI], 25 kg/m2 or higher) and 694 participants (19.3%) had hypertension. The median UIC was 292 ╬╝g/L (IQR, 157 to 672), and the median urinary I/Cr ratio was 195 ╬╝g/g (IQR, 104 to 478). Iodine deficiency (< 100 ╬╝g/L) and iodine excess (> 300 ╬╝g/L) were observed in 11.3% and 49.0% of subjects, respectively. The median daily sodium intake was 3,451 mg/day (IQR, 2,258 to 5,086), and the median urinary sodium concentration was 113 mmol/L (IQR, 80 to 150).
Association between UIC and urinary sodium
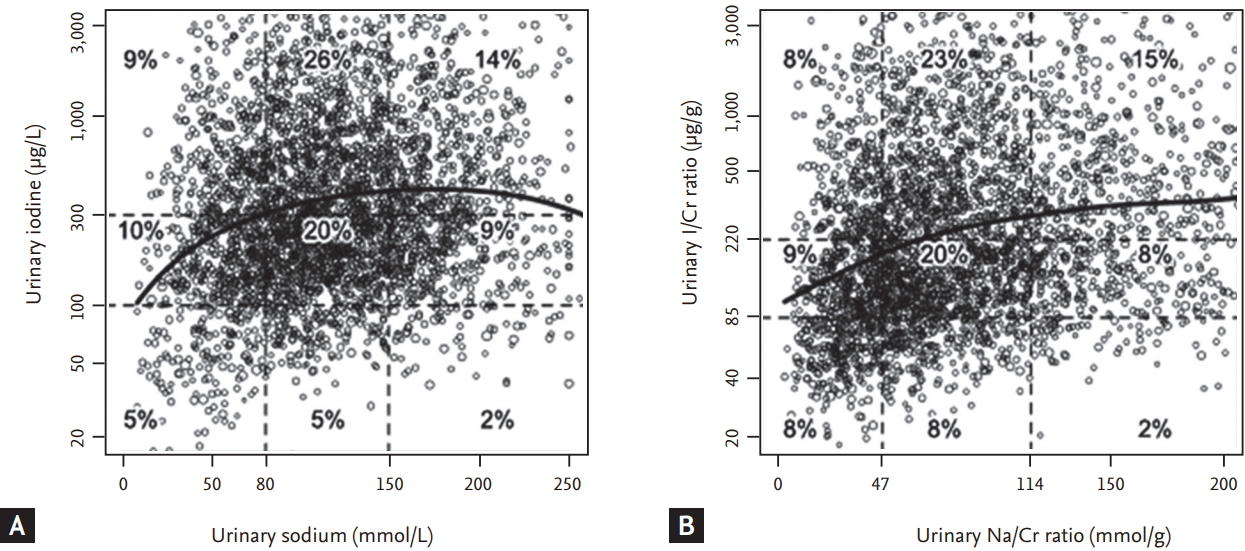
There was a significant association between the UIC and urinary sodium concentration (p < 0.001) (Table 2). In the low urinary sodium concentration group, 4.6%, 10.4%, and 9.3% of subjects had an iodine deficiency, adequate iodine intake, and excessive iodine intake, respectively. In the high urinary sodium concentration group, 2.1%, 9.2%, and 13.7% of subjects had an iodine deficiency, adequate iodine intake, and excessive iodine intake, respectively. In addition, multivariate linear regression analysis showed a significant association between the UIC and urinary sodium concentration after adjusting for age and sex (p < 0.001) (Fig. 1A).
Association between urinary I/Cr and Na/Cr ratios
There was a significant association between the urinary I/Cr and urinary Na/Cr ratios (p < 0.001) (Table 3). As the urinary Na/Cr ratio decreased, the proportion of subjects with iodine deficiency increased. In the low urinary Na/Cr ratio group, 8.2%, 8.8%, and 7.9% of subjects had iodine deficiency, adequate iodine intake, and excessive iodine intake, respectively, whereas in the high urinary Na/Cr ratio group, 2.2%, 7.9%, and 14.9% of subjects had iodine deficiency, adequate iodine intake, and excessive iodine intake, respectively. Multivariate linear regression analysis showed a significant association between the urinary I/Cr and Na/Cr ratios (p < 0.001) (Fig. 1B). The clinical characteristics of sex, BMI, and hypertension in each group were described in Supplementary Tables 1 and 2.
Urinary I/Cr ratio and Na/Cr ratio in different age groups
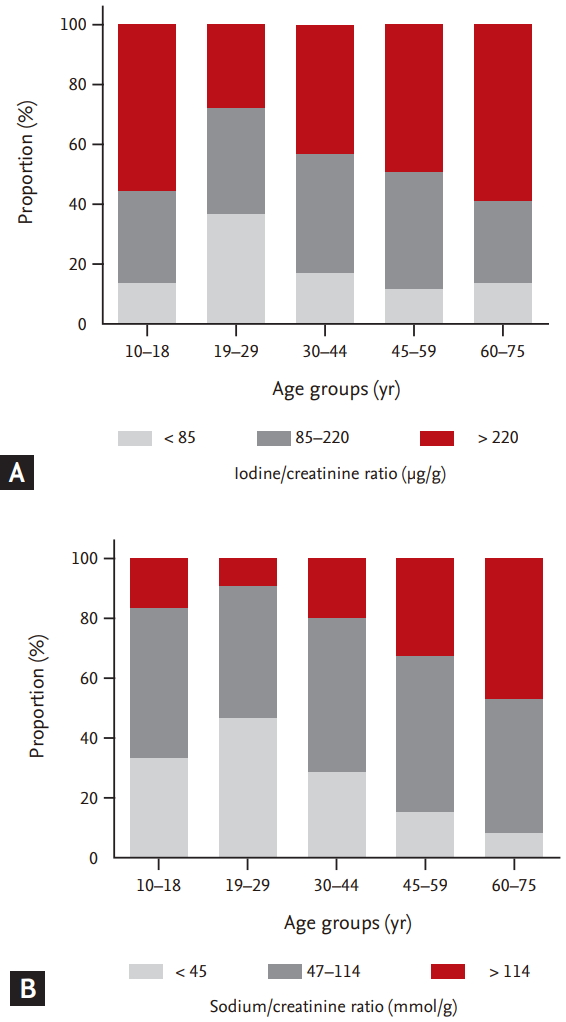
Iodine deficiency (urinary I/Cr ratio < 85 ╬╝g/g) was most common in young adults (age, 19 to 29 years), whereas iodine excess (urinary I/Cr ratio > 220 ╬╝g/g) was most common in the elderly (age, 60 to 75 years) (Table 4 [left] and Fig. 2A). Iodine deficiency was observed in 13.7%, 36.0%, 17.2%, 11.7%, and 13.3% of subjects in the 10 to 18, 19 to 29, 30 to 44, 45 to 59, and 60 to 75 years age groups, respectively (p < 0.001) (Table 4 [left] and Fig. 2A) and iodine excess was observed in 55.0%, 27.0%, 42.6%, 48.1%, and 58.8% of subjects, respectively.
Similar to the urinary I/Cr ratio, a low Na/Cr ratio (urinary Na/Cr ratio < 47 mmol/g) was most common in young adults (age, 19 to 29 years) (Table 4 [right] and Fig. 2B) and a high urinary Na/Cr ratio (> 114 mmol/g) was most common in the elderly (age, 60 to 75 years). Low urinary Na/Cr ratios were observed in 33.2%, 46.1%, 27.4%, 15.2%, and 8.0% of the subjects in the 10 to 18, 19 to 29, 30 to 44, 45 to 59, and 60 to 75 years age groups, respectively (p < 0.001) (Table 4 [right] and Fig. 2B) and high urinary Na/Cr ratios were observed in 15.9%, 8.8%, 18.7%, 32.6%, and 46.3% of the subjects, respectively.
DISCUSSION
Recent studies using KNHANES data demonstrated that the general Korean population had a higher iodine intake those in than populations from other countries [5,19,20]. In one study, about half of the Korean study population had more-than-adequate or excessive iodine intake [5]. Another study suggested that the major source of dietary iodine in Korea was seaweed, as it accounted for more than 60% of the iodine intake of the Korean adults [9]. Traditional Korean foods contain sea tangle or kelp as the basic ingredient in soups, frequently brown seaweed soup and laver [21,22]. Interestingly, previous studies reported that the sodium intake of the Korean population was higher than that recommended by WHO [11-13,15]. In the current study, the median daily sodium intake was 3,451 mg and the dietary sodium intake was > 2,000 mg in 80.9% of the study population. The consumption of sea salt and other sauces containing large amounts of sea salt could be responsible for not only the high sodium intake but also the high iodine intake. To our knowledge, this is the first study to confirm the association between iodine status and sodium intake in the general Korean population.
A previous study assessed the iodine and sodium levels in the Korean population by analyzing 540 spot urine samples obtained from healthy Korean volunteers [15] and found significantly lower urinary sodium and iodine levels in young subjects (age, 19 to 35 years) than those in older subjects [15]. Another recent study reported excessive iodine intake among school-age children in Korea [8]. This cross-sectional study reported a median UIC of 458.2 ╬╝g/L in 373 students aged 7 to 12 years. Furthermore, 76.7% of the children had excessive iodine levels (UIC > 300 ╬╝g/L), while 2.1% had iodine deficiency (UIC < 100 ╬╝g/L) [8]. These studies concluded that the intake of seaweed might be responsible for the high iodine concentration, but did not assess the sodium intake.
In the current study, the distributions of UIC, urinary I/Cr ratio, and urinary Na/Cr ratio varied among age groups. A previous study using KNHANES data demonstrated high UICs and urinary I/Cr ratios in the elderly (age, Ōēź 60 years) and young adolescents (age, 10 to 18 years) and low UICs and urinary I/Cr ratios in young adults (age, 19 to 29 years) [6]. However, the reason for the varied iodine intake among these age groups is uncertain. Differences in dietary habits between young adults and the elderly may be responsible for this variation. In this study, among all groups, young adults (age, 19 to 29 years) had the lowest urinary sodium and urinary Na/I ratio and the elderly (age, 60 to 75 years) had the highest urinary sodium and urinary Na/I ratio. These patterns of sodium intake in young adults and elderly were consistent with their UICs and urinary I/Cr ratios, which reflect the iodine intake. These findings support the significant association between sodium intake and iodine intake in the Korean population.
In this study, we evaluated the iodine intake by measuring the UIC and urinary I/Cr ratio in the general Korean population. Since iodine absorbed in the body is primarily excreted in the urine, urinary iodine concentration reflects the iodine intake [23,24]. Previous studies demonstrated that the UIC in spot urine is a good indicator of the iodine nutritional status in general populations [5,6,17,24]. If the protein intake is adequate in healthy populations, creatinine is excreted in the urine at a relatively constant rate. To adjust for the effects of urinary dilution, the urinary I/Cr ratio is used to evaluate the iodine status. In this study, we excluded subjects with abnormal renal function in order to accurately evaluate the iodine and sodium status in the urine samples. In addition, we determined the corresponding values of the urinary I/Cr ratio by using the WHO definition of UICs for the iodine nutritional status (Supplementary Fig. 1).
This study showed that the iodine intake of the Korean population was higher than that reported for other countries. In our study, the median UIC was 292 ╬╝g/L (IQR, 157 to 672). A previous Japanese study also reported a median UIC of 281.6 ╬╝g/L because the geographical environment and iodine source were similar to those of Korea [25]. However, the median UIC in the US NHANES (2007 to 2008) was 164 ╬╝g/L [26], and that in one Dutch study was 130 ╬╝g/L [20]. The association between the iodine nutritional status and salt intake was suggested in one study using US NHANES (2001 to 2004) data. That study showed that dietary salt restriction was associated with significant iodine deficiency only in women but not men. The prevalence of iodine deficiency in that study was 24.96% in men and 40.42% in women [27]. However, no study has reported the association between iodine nutritional status and salt intake in an iodine sufficient area.
Despite the important findings, this study had several limitations. First, this was a cross-sectional study. Therefore, the presence of a causal relationship between the iodine and sodium intakes could not be examined. Second, to evaluate the iodine status and sodium intake, spot urine samples were used instead of the 24-hour urine samples. Spot urine is widely used in national surveys because it can be easily collected and analyzed. However, a single spot urine sample is a poor predictor of sodium and iodine intake as compared to 24-hour urine samples, because the former varies even within a day and reflects only the recent intake [28,29]. In addition, we did not fully consider medications and gastrointestinal surgery history that may affect UICs and urinary sodium concentrations. Third, we did not evaluate the food intake of the subjects in this study. It is difficult to analyze exactly what foods contributed to our results. Nevertheless, to our knowledge, this is the first nationwide study to evaluate the possible association between iodine status and sodium intake in the Korean population.
In conclusion, there was a significant association between the iodine status and sodium intake in the Korean population. Iodine deficiency and low sodium intake were most common in young adults, whereas iodine excess and high sodium intake were most common in the elderly. Our study findings suggest that an adequately low salt intake might be helpful for preventing iodine excess in Korea. Further research is needed to confirm the causal relationship.
 PDF Links
 PubReader
 ePub Link
 Full text via DOI
 Download Citation
 Supplement 1
 Print
Print


