


INTRODUCTION
Asthma is a heterogeneous airway disease with complex pathological mechanisms. Many attempts have been made to define asthma subtypes technically, based on clinical, physiologic and pathologic heterogeneities [1]. Th2 mechanisms and eosinophils have been identified as the main target with regard to asthmatic inflammation in severe asthma [2]; however, the pathogenic mechanisms of non-eosinophilic asthma have not yet been fully characterized.
Recently, the presence of dual-positive Th2/Th17 cells has been observed in the blood [3] and bronchoalveolar lavage fluid [4] of asthmatic patients. Based on these observations, a new classification of Th2-predominant, Th2/Th17-predominant, and Th2/Th17-low asthma has been suggested. The interleukin-1╬▓ (IL-1╬▓) pathway was revealed as a critical pathway for defining the Th2/Th17-predominant or the Th2/Th17-low asthma groups, suggesting that different mechanisms are involved in the pathogenesis of neutrophilic asthma [5]. Th2-dominant asthma is characterized by elevated numbers of eosinophils [2] and levels of biomarkers such as periostin and eosinophil-derived neurotoxin (EDN), which are closely associated with eosinophilic airway inflammation [6]. Th2/Th17-predominant asthma may drive the mixed granulocytic asthma group, where the lowest lung function is observed [7]. Th2/Th17-low asthma traditionally includes both neutrophilic and paucigranulocytic asthma groups, in which neutrophils and epithelial cells play major roles.
The S100 protein family is the most abundant in neutrophils and macrophages, among which S100A9 is reported to have roles in neutrophilic asthma [8]. Additionally, folliculin is a protein derived from airway epithelial cells. Its production is increased by epithelial cell activation in asthmatic patients [9].
The results of testing procedures for induced sputum cellular profiles are often affected by multiple complex factors making them unstable and inconsistent [10]. Timing of tests and previous use of corticosteroid treatment may lead to different results. There are difficulties when implementing and interpreting sputum cell counts, so counting blood eosinophils has been revisited during clinical trials [11]. However, in cases of severe asthma, counting blood eosinophils is not sufficiently reliable to characterize airway inflammation, because the patient has been exposed to recurrent infections and frequent systemic corticosteroid therapy [12]. Therefore, there is a need to find another consistent and reliable disease marker to reflect the character and degree of airway inflammation in an adult asthma cohort.
In this study, we measured the serum levels of inflammatory mediators and cytokines in adult asthmatics and analyze their associations with the cellular profile of sputum. Furthermore, we investigated the ability of serologic markers to distinguish the various cellular profiles of the sputum of adult asthmatics.
Study subjects
Among 1,133 adult asthmatics [13] in Ajou University Medical Center (Suwon, Korea), 421 with available sputum profiles were enrolled in this study. All patients were consistent with the diagnosis of bronchial asthma and had been treated with maintenance medications, including medium-to-high doses of inhaled corticosteroids. The patients had a history of respiratory symptoms and evidence of airflow limitation such as airway reversibility and airway hyperreactivity [14]. Their demographic data were collected, including disease duration, past history, history of aspirin-exacerbated respiratory disease (AERD), and smoking status. Smoking status was classified into current and not current smokers (previous or never smoker).
The Institutional Review Board of Ajou University Hospital approved this study (AJIRB-GEN-SMP-13-108). Signed written consent and agreement to participate in the study were obtained from each subject.
Assessment of clinical parameters
All participants underwent skin prick tests with common inhalant allergens to define their atopy status. Total eosinophil counts (TEC) in peripheral blood were obtained. Total serum immunoglobulin E (IgE) and eosinophilic cationic protein (ECP) levels were measured using the ImmunoCAP system (Thermo Fisher Scientific Inc., Waltham, MA, USA). Chest/paranasal sinus X-ray and/or computed tomography and rhinoscopy were completed during enrollment into this study. Lung function tests including spirometry with bronchodilator, and methacholine challenge testing were conducted to diagnose bronchial asthma during the initial visit.
Severe asthma was diagnosed as asthma that required treatment with high doses of inhaled corticosteroids plus a second controller and/or systemic corticosteroids and that ŌĆ£remained uncontrolledŌĆØ despite this therapy. Uncontrolled asthma was defined as the presence of one or more of the following: (1) poor asthma control, asthma control test < 20; (2) frequent severe exacerbations, defined as two or more bursts of systemic corticosteroids during the previous year; (3) serious exacerbations, defined as at least one hospitalization during the previous year; (4) airflow limitation, % predicted value of post-bronchodilator forced expiratory volume in 1 second (FEV1) < 80% [15]. Patients with a previous diagnosis of chronic obstructive pulmonary disease (COPD) and/or asthma-COPD overlap by clinicians were excluded from this study.
Sputum collection and classification
Sputum induction with hypertonic saline (4.5%) was performed as previously described [16]. The subjects did not cease their currently used inhaled corticosteroid. Sputum samples were collected in a plastic container and dispersed using dithiothreitol for sputum cell count assessment and inflammatory subtype determination. Inflammatory cells were counted as a percentage of total sputum cells. Neutrophilic cut-off values were age-dependent and defined as previously described [17]. Neutrophilic or mixed granulocytic groups were determined according to the following age groups: neutrophil percentage (< 20 years old), 75.57% or greater; neutrophil percentage (20 to 40 years old), 61.61% or greater; neutrophil percentage (40 to 60 years old), 63.25% or greater; and neutrophil percentage (> 60 years old), 67.25% or greater [17].
The study groups were determined as follows: group 1 (G1, eosinophilic group) was defined as having sputum eosinophilia (eosinophil percentage Ōēź 3% in sputum); group 2 (G2, mixed granulocytic group) was defined as having both sputum eosinophilia and neutrophilia; group 3 (G3, neutrophilic group) was defined as having sputum neutrophilia; and group 4 (G4, paucigranulocytic group) was defined as having neither sputum eosinophilia nor neutrophilia.
Measurements of serum inflammatory mediators
We searched for serum inflammatory mediators reflecting the sputum cellular profiles of asthmatic patients from published literature reviews. We selected four candidate mediators; periostin, EDN, S100A9, and folliculin. We performed enzyme-linked immunosorbent assay (ELISA) for the candidate mediators. Each mediator was assayed using subjectsŌĆÖ frozen sera following ELISA kits according to the manufacturerŌĆÖs instructions. The ELISA kits used were used as follows: measuring serum levels of periostin (Shino-Test, Kanagawa, Japan), EDN (MBL International, Woburn, MA, USA), S100A9 (R&D Systems, Minneapolis, MN, USA), and folliculin (CUSA Biotech, Wuhan, China).
Statistical analysis
All serum levels of cytokines in the study participants were log-transformed before conducting statistical analysis to establish a normal distribution. Data analysis was performed using SPSS version 22.0 (IBM Co., Armonk, NY, USA). The values are expressed as means ┬▒ standard deviation or frequencies (%). One-way analysis of variance (ANOVA) was used to compare differences among the four groups, whereas StudentŌĆÖs t test was used to compare two groups. Statistical correlations were analyzed using PearsonŌĆÖs correlation coefficient.
To evaluate factors associated with G1 among G1 plus G2, a binary logistic regression was performed. All of the values were adjusted for age, gender, and smoking status. Receiver operating characteristic (ROC) curves were used to evaluate the validity of serum periostin and EDN levels for discriminating G1 from G1 plus G2, and the area under the curve (AUC) with a 95% confidence interval (CI) was computed. Sensitivity and specificity were calculated according to the identified optimal cut-offs. Values of p of < 0.05 were considered indicative of statistical significance. GraphPad Prism version 8.0 (GraphPad, La Jolla, CA, USA) was used to create graphs.
RESULTS
Clinical findings of the study subjects according to sputum cell profile
Among the 421 subjects, 149 were G1 (35.4%), 71 were G2 (16.9%), 155 were G3 (36.8%) and 46 were G4 (10.9%). Females were predominant in G2 (64.8%) and G3 (68.4%), compared to G1 (55.0%) and G4 (58.7%) (Table 1). No significant differences were observed in age and duration of asthma among the four study groups. The prevalence of atopy, AERD, current smokers, chronic rhinosinusitis, and nasal polyps were similar among the four groups. TEC was significantly elevated in G1 and G2 (p = 0.005 by ANOVA), compared to G3 or G4. Serum total IgE and ECP levels did not differ significantly among the four groups. Lung functions including FEV1 (% predicted) and PC20 (mg/mL, the methacholine concentration causing a 20% fall in FEV1) did not differ significantly among the four groups, but the mean FEV1 levels tended to be lower in G2 subjects, and the prevalence of severe asthma tended to be higher in G2 subjects.
Comparison of serum inflammatory biomarkers among the four groups
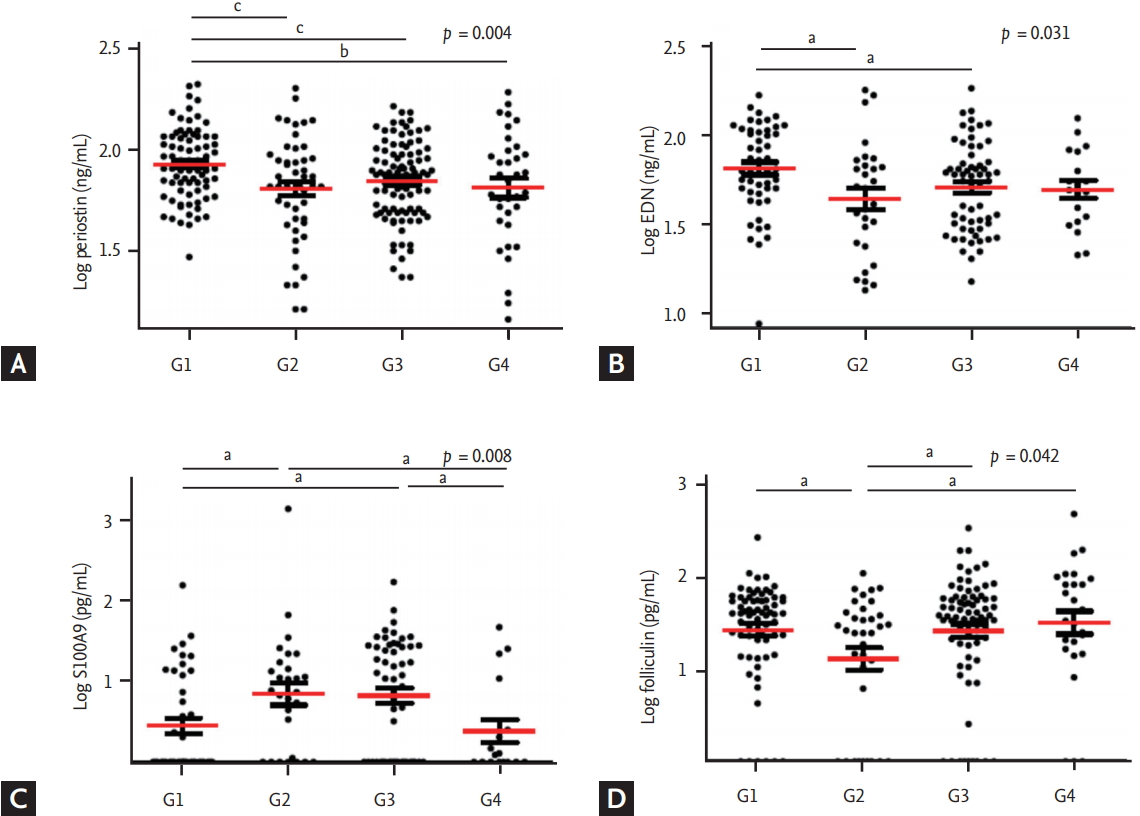
Serum levels of inflammatory mediators were log-transformed, including periostin, EDN, ECP, folliculin, and S100A9, to correct their skewed distributions. Table 2 lists the serum inflammatory parameters and the values according to each group. Serum periostin and EDN levels were significantly higher in G1 (p = 0.004 and p = 0.031, by ANOVA). Fig. 1 compares four serum inflammatory mediator concentrations within the four groups: serum periostin level was the highest in G1 (G1 vs. G2, p = 0.002; G1 vs. G3, p = 0.004; and G1 vs. G4, p = 0.007) (Fig. 1A). Serum EDN levels were more significantly elevated in G1 than G2 and G3 (G1 vs. G2, p = 0.010; and G1 vs. G3, p = 0.030) (Fig. 1B). No significant differences were observed in serum ECP levels among the groups.
Serum S100A9 levels differed significantly among the four groups (p = 0.008, by ANOVA) (Table 2). The levels in G2 and G3, the two groups with increased neutrophil counts in sputum were significantly higher than those of the other two groups (G1 vs. G2, p = 0.017; G1 vs. G3, p = 0.008; G2 vs. G4, p = 0.031; G3 vs. G4, p = 0.022) (Fig. 1C). Serum folliculin levels differed significantly among the four groups (p = 0.042 by ANOVA) (Table 2). They were significantly lower in G2 than in the other three groups, with the highest levels found in G4 (G1 vs. G2, p = 0.013; G2 vs. G3, p = 0.025; G2 vs. G4, p = 0.029) (Fig. 1D).
Comparison of serum inflammatory biomarkers among eosinophil-dominant groups
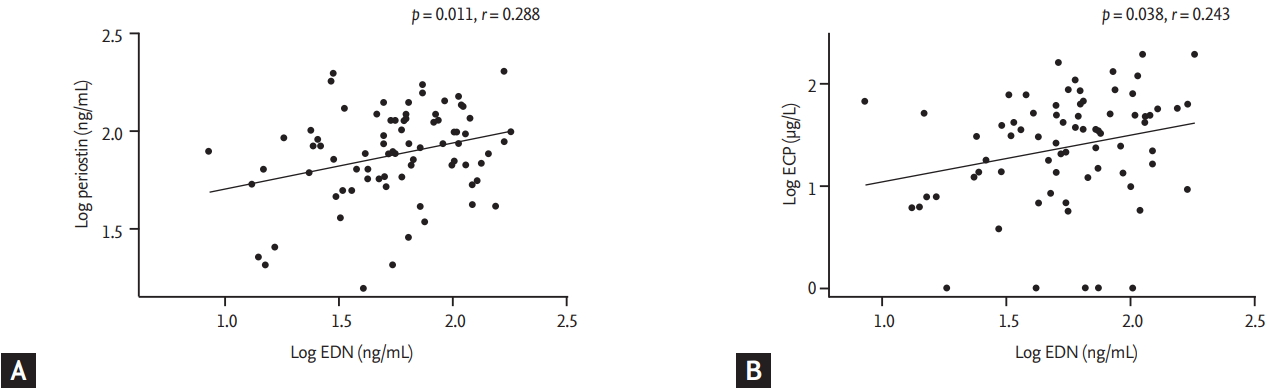
Because both G1 and G2 were eosinophil-dominant groups, we compared serum mediators to find factors that might differentiate between these two groups. Serum periostin and EDN levels were more significantly elevated in G1 than in G2 (p = 0.002 and p = 0.010) (Fig. 1), whereas S100A9 levels were significantly lower in G1 than in G2 (p = 0.017) (Fig. 1C). Serum EDN levels were positively correlated with serum periostin (r = 0.288, p = 0.011) (Fig. 2A) and ECP (r = 0.243, p = 0.038) (Fig. 2B) levels in G1 plus G2. Serum EDN levels had a stronger correlation with TEC than periostin (r = 0.335, p = 0.003 for TEC, and r = 0.217, p = 0.013 for periostin, data not shown).
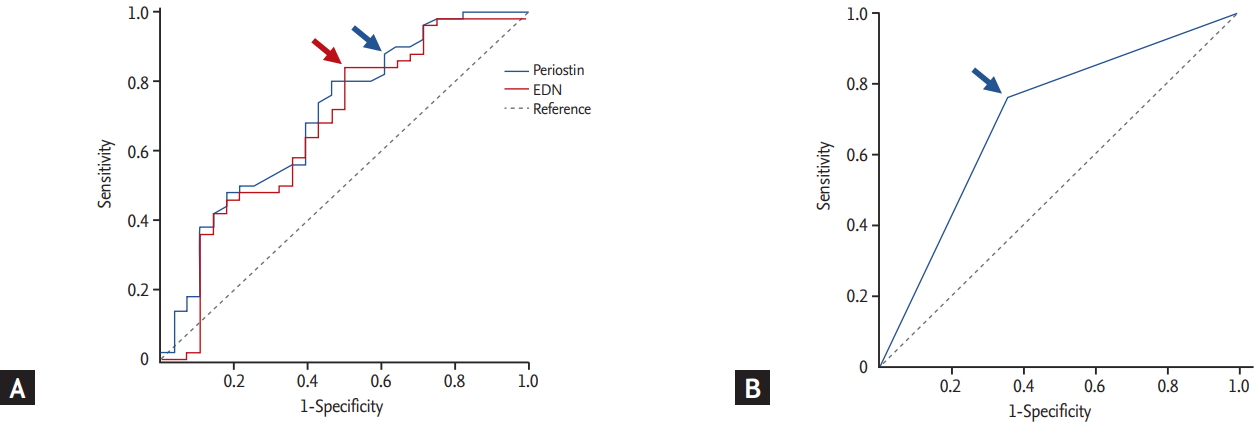
The diagnostic values of the serum EDN and periostin levels were evaluated to discriminate G1 from G1 plus G2 using a ROC curve (Fig. 3A), and we selected the appropriate cut-off values. Using the cut-off value for periostin (Ōēź 1.74 ng/mL), the sensitivity and specificity were 87.5% and 42.3% with 0.696 (95% CI, 0.563 to 0.829; p = 0.007) of the AUC value. When we applied the cut-off value of EDN (Ōēź 1.61 ng/mL), the sensitivity and specificity were 85.0% and 46.2% with 0.655 (95% CI, 0.514 to 0.796; p = 0.035) of the AUC value. When both parameters were combined, the AUC value increased to 0.701 (95% CI, 0.577 to 0.826; p = 0.004), whereas the sensitivity and specificity increased to 76.0% and 64.3%, respectively (Table 3 and Fig. 3). The p value of combined parameters was obtained using logistic regression after the adjustment by age, gender, and smoking status. Serum folliculin and S100A9 levels were excluded for the ROC curve analysis, as their p values were marginal (p = 0.038 and p = 0.048, respectively).
DISCUSSION
Asthma classification using inflammatory cell profiles of sputum has been useful for characterizing inflammatory subtypes and predicting treatment responses [18]. Sputum eosinophilia is a useful tool for defining the phenotype of eosinophilic asthma and is a good predictor of the patientŌĆÖs response to inhaled steroids [19]. However, some asthmatic patients have both sputum neutrophilia and eosinophilia; therefore, they present as mixed granulocytic asthma. The phenotypes of remaining non-eosinophilic subjects are still heterogeneous and can be further classified based on the presence of neutrophilia, as neutrophilic only, and as paucigranulocytic asthma [18,20]. Many efforts have been made to fully characterize the different subtypes of adult asthmatics based on sputum cell profiles, but they are not yet fully understood.
In this study, we assigned adult asthmatic patients into four groups based on their sputum cell profiles: G1, only eosinophilic; G2, mixed granulocytic, both eosinophilic and neutrophilic; G3, only neutrophilic; and G4, paucigranulocytic asthma. This is an easier diagnostic method in real practice, compared to flow cytometry techniques. G1 and G3 were the predominant groups, followed by G2 and G4. There have been variable differences in the prevalence of sputum cell profiles between studies, which are mainly due to differences in study populations, and the cut-offs of sputum eosinophil/neutrophil counts used. We used the same cut-off values as those of a previous study: > 3% eosinophils for eosinophilic asthma, and age-dependent cut-offs for neutrophils as neutrophilic asthma [21]. However, other studies have used different cut-off points for neutrophilic asthma: > 61% of sputum neutrophils [22] and a different cut-off point for eosinophilic asthma, > 1.1% of sputum eosinophils [18]. Another Korean study [23] used different cut-off values for sputum neutrophilia (Ōēź 40%), leading to different results from the ones that were observed in this study. We used the recommendations of a recent report stating that age-specific reference values should be used as a cut-off point for neutrophilic inflammation in clinical studies, as airway neutrophilia is related to age in adults [17]. Overall, the variable classification results in sputum inflammatory cell profiles are likely due to various cut-off values that were applied to different groups.
We compared clinical parameters among four different groups in this study. G1 and G2 have sputum eosinophilia typified by significantly high levels of peripheral blood eosinophils with no observable differences between these groups. However, other type-2 response markers such as total IgE and ECP levels did not differ significantly among the four different groups. Lung function tests revealed that G2 tended toward lower FEV1% and PC20 methacholine levels compared to the other three groups, finding that are in agreement with other studies reporting lower FEV1%/PC20 methacholine levels or poor asthma controls in G2 [7,18,24]. Previous research has shown a significant association between asthma severity and mixed granulocytic asthma [25]. Microassay screening of sputum samples has demonstrated that mediators such as brain-derived neutrophilic factor (BDNF), and IL-1╬▓, have a stronger association with neutrophils. These were elevated in patients with mixed granulocytic asthma [7]. These findings suggest that mixed granulocytic asthma is associated with reduced lung function and severe asthma in which additional Th1 inflammatory components, such as BDNF and IL-1╬▓, could contribute to a poor outcome.
Serum levels of periostin and EDN were the highest in G1 compared to the other three groups, while no significant difference was noted in ECP level among the groups. Additionally, serum EDN level was positively correlated with periostin level, suggesting that both serum periostin and EDN levels could be potential serum biomarkers to predict the phenotype of eosinophil-dominant group among asthmatic patients with sputum eosinophilia. Serum EDN levels have been suggested as a marker for monitoring the functional status of eosinophils in various allergic diseases including asthma, atopic dermatitis, allergic rhinitis, and eosinophilic esophagitis [26]. In childhood asthma, serum EDN levels were reported to be clinically relevant as a marker for predicting asthma severity and monitoring and to be more useful than ECP [27,28]. In adult asthmatics, serum EDN levels were decreased after anti IL-5 antibody treatment, indicating that this serum biomarker may represent eosinophil activation status [29]. The present study revealed that serum EDN levels had a stronger positive correlation with TEC than serum periostin did, suggesting that EDN reflects more TEC and represents the phenotypes of eosinophilic asthma.
Periostin is mainly released from airway epithelial cells stimulated by type-2 cytokines such as IL-4 and IL-13 [30], and can be used as a serum biomarker of eosinophilic airway inflammation, and to predict lung function decline and poor asthma control [31]. Because periostin is highly expressed in chronic eosinophilic inflammatory diseases, and upregulates the production of fibroblasts, periostin has an important role in airway chronic inflammation and remodeling [32]. Indeed, serum periostin is well correlated with the degree of airway eosinophilic inflammation and is suggested to be a good serologic marker for airway eosinophilia [33]. The findings of the present study indicate that serum periostin and EDN levels may be biomarkers of the phenotype of eosinophilic asthma (to determine asthmatic patient groups having sputum eosinophilia, as opposed to those with mixed granulocytic asthma). When combined, these two biomarkers can improve diagnostic discrimination. Serum EDN had more advantages with regard to reflecting TEC, while serum periostin was more effective way to represent chronic airway eosinophilic inflammation, such as airway remodeling.
Among neutrophil-dominant groups, S100A9 levels were higher in G2 and G3, and may be a useful serum marker to discriminate G2 from G1 plus G2. S100A8/9 were mainly expressed on neutrophils and secreted by bronchial epithelial cells [34] and induced the activation and migration of neutrophils [35]. In the present study, S100A9 level, not S100A8, differed significantly among the four groups. Although we measured other neutrophilic markers, such as IL-8 and myeloperoxidase, no significant differences were observed among the groups (data not shown). These findings suggest that mediators secreted by epithelial cells, such as periostin and S100A9, have important roles in modulating inflammatory cell profiles in the asthmatic airway.
Folliculin is the causative gene of Birt-Hogg-Dube syndrome. It has a role in maintaining the integrity and function of cell-to-cell adhesion in airway epithelial cells [36]. In a recent study on toluene diisocyanate-induced asthma, folliculin production was increased by airway epithelial damage [9]. In patients with AERD, serum folliculin levels (released from human airway epithelial cells) were significantly higher than those of the aspirin-tolerant group, indicating that increased serum folliculin levels represent the status of epithelial activation and disruption [37]. In the present study, the highest folliculin level was noted in G4, and the subjects with AERD had significantly higher folliculin levels than the aspirin-tolerant subjects (p = 0.024). Although the pathogenic mechanisms of paucigranulocytic asthma remain poorly understood, and its characterization is less well defined, paucigranulocytic asthma is an asthma phenotype with no evidence of increased numbers of inflammatory cells. It is considered to be noninflammatory or low-grade airway inflammation and manifests as an uncoupling of airway obstruction from airway inflammation that can be driven by structural changes within the airways [20]. Taken together, epithelial cell activation and dysintegrity rather than cellular inflammation may be a major mechanism for the development of paucigranulocytic asthma, in which various triggers may alter structural cell function (myofibroblasts, epithelial, smooth muscle, and mast cells).
Major limitations of our study were that this was a cross-sectional study enrolled at a single tertiary asthma center. Although the gold standard phenotype in sputum cellular profiles has been defined as the most common finding from sputum samples taken over 5 months [38], samples collected at enrollment were used in our study. Additionally, many factors affect inflammatory cell profiles in induced sputum, such as infections, exacerbations, and environmental air pollution [39,40]. Therefore, these results can vary according to the time of sample collection and the treatment status of each patient. It is critical to find a stable serum biomarker for monitoring the various clinical states of adult asthmatic patients.
In conclusion, the serum periostin and EDN levels may be used to discriminate eosinophilic asthma from mixed granulocytic asthma. Also, the serum S100A9 level is elevated in patients with neutrophilic asthma and the serum folliculin level is elevated in those with paucigranulocytic asthma.
KEY MESSAGE
1. The cellular profile of sputum can be used to classify the phenotype of asthma, such as eosinophilic asthma, mixed granulocytic asthma, neutrophilic asthma, and paucigranulocytic asthma.
2. Serologic markers, including eosinophil-derived neurotoxin (EDN) and periostin, can be used to identify eosinophilic asthma. Additionally, the EDN level ref lects blood eosinophilia and periostin indicates chronic eosinophilic inflammation of the airway.
3. The serum EDN and periostin levels can be useful markers of eosinophilic asthma and the serum S100A9 level is indicative of neutrophilic asthma.
 PDF Links
 PubReader
 ePub Link
 Full text via DOI
 Download Citation
 Print
Print


