


INTRODUCTION
Colorectal cancer (CRC) is one of the most prevalent cancers in men and women. Globally, 1.2 million new cases of CRC and 608,700 CRC-related deaths were estimated to have occurred in 2008 [1,2]. The prevalence of cancers of the colon and rectum appears to have increased among younger adults. Indeed, Korea has one of the highest rates of growth in the prevalence of CRC [3,4] exceeding the incidence noted in the United States. An increase of CRC is attributable to obesity and metabolic syndrome associated with a now prevalent westernized lifestyle [5]. Several studies suggest that obesity and metabolic syndrome are risk factors for CRC [6,7].
Nonalcoholic fatty liver disease (NAFLD), one of the main liver diseases worldwide [8], has been considered the hepatic manifestation of metabolic syndrome [9]. Accumulating evidence supports the hypothesis that NAFLD precedes the development of obesity or diabetes and is not solely a hepatic manifestation [10]. NAFLD independently predicts insulin resistance, enabling physicians to identify certain individuals with insulin resistance who may be missed by metabolic syndrome criteria [10]. This finding suggests that NAFLD may be associated with development of CRC even before fullblown metabolic syndrome is observed. However, only limited studies have evaluated this relationship [11,12].
Fatty liver index (FLI) is calculated using body mass index (BMI), waist circumference, triglyceride (TG), and gamma (╬│)-glutamyl transferase (GGT), and is used as a noninvasive means to predict NAFLD [13]. The formula is validated for high diagnostic accuracy in a large population [14,15].
This study aimed to evaluate the association between NAFLD, as defined by FLI, and development of CRC using Korean nationwide data.
METHODS
Data source and study population
The database of the National Health Insurance Corporation (NHIC) was used. NHIC is a national insurer managed by the Korean government to which approximately 97% of the Korean population subscribes. The NHIC recommends that subscribers undergo a standardized medical examination at least biennially. Any researcher can use the NHIC database after the official review committee approves study protocols. Operational definitions from the International Classification of Diseases, 10th revision codes were used to define disease groups.
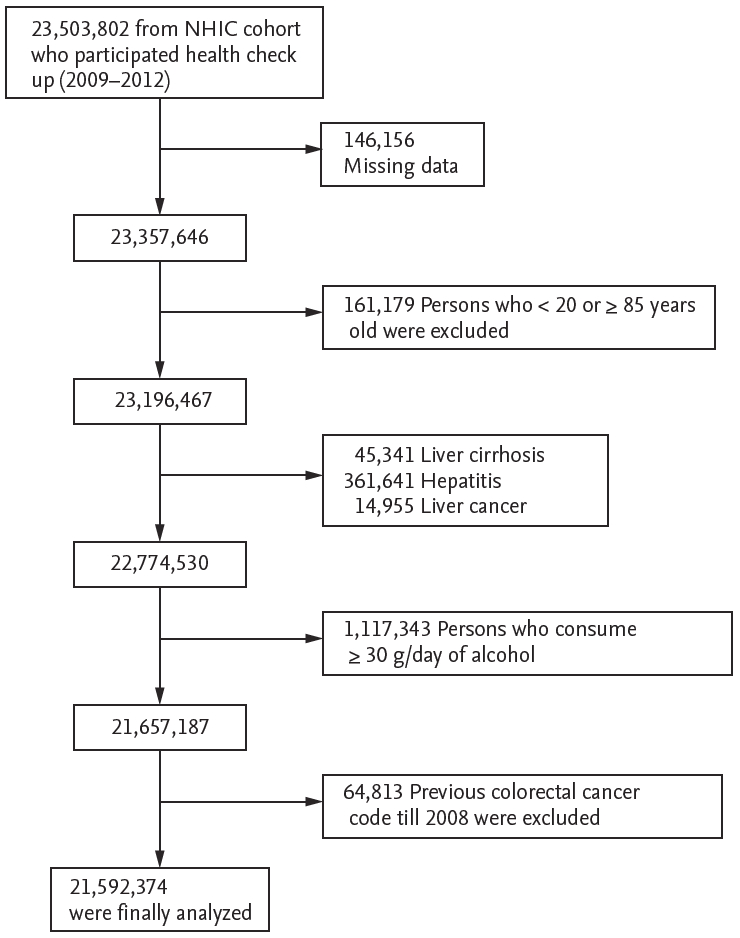
Reports for 23,503,802 individuals who had undergone an annual or biennial evaluation between 2009 and 2012 were available in the NHIC database. Because of insufficient data, 146,156 participants were excluded, Further, 45,341 persons aged less than 20 years or older than 85 years; 45,341 individuals diagnosed with liver cirrhosis (K703), 361,641 with hepatitis (K746), and 14,955 with hepatic cancer (C22) were also excluded. Finally, 1,117,343 heavy alcohol consumers (daily alcohol consumption Ōēź 30 g for men and Ōēź 20 g for women), and 64,813 participants diagnosed with CRC before 2009 were also excluded to avoid enrolling patients with pre-existing diseases. The remaining 21,592,374 participants were analyzed and followed up. A summary of the study population selection is illustrated in Fig. 1. This study was approved by the Institutional Review Board of Seoul National University Bundang Hospital (X-1608/360-904). All procedures performed in studies involving human participants were in accordance with the 1964 Helsinki declaration and its later amendments or comparable ethical standards. Since the present study involved routinely collected data, additional specific informed consent was not required.
Measurements of clinical parameters and biochemical analysis
Standardized self-reporting questionnaires were used to collect data at the time of enrollment for the following variables, which are regarded as risk factors for liver injury. These variables were included as covariates in multivariable analyses: age (years), sex (male or female), residency (rural and urban), yearly income (lower quintile vs. the remaining quintiles), alcohol consumption (frequency of alcohol consumption in 1 week and the amount of alcohol consumed on one occasion were evaluated by reviewing the questionnaire [frequency: 0 to 7 days/week and amount: drinks per occasion]), and cigarette smoking (never, former, and current). Regular exercise was defined as engaging in vigorous exercise on a regular basis (high-intensity activity Ōēź 3 times/week or moderate-intensity activity Ōēź 5 times/week) [16]. BMI and systolic and diastolic blood pressures (mmHg) were also measured. Participants were considered obese when their BMI was Ōēź 25 kg/m2 based on criteria from the Asian-Pacific region [17]. Waist circumference > 90 cm was defined as abdominal obesity [17]. Diabetes mellitus (DM) was defined based on use of insulin or oral hypoglycemic agents [8] or a fasting plasma glucose level Ōēź 126 mg/dL [18]. Participants were diagnosed as hypertensive if their systolic pressure was Ōēź 140 mmHg, if their diastolic pressure was Ōēź 90 mmHg, or if they currently used antihypertensive medication [19]. After overnight fasting for at least 8 hours, blood specimens collected from each participant were processed and transported in cold storage to the Central Testing Institute (Neodin Medical Institute, Seoul, Korea). Levels of total cholesterol (mg/dL) and liver enzymes alanine aminotransferase (ALT), aspartate aminotransferase (AST), and GGT (IU/L) in the serum were determined.
The primary endpoint for the study was newly diagnosed CRC, which was defined using the International Classification of Diseases, 10th revision codes (C180-200). The diagnosis of CRC was considered new when a patient had no such diagnosis during the preceding years.
Surrogate measure of fatty liver
Screening of asymptomatic individuals using imaging modalities, such as ultrasonography (US) and computed tomography, are expensive for mass screening [20]. Therefore, simple, noninvasive tests such as the FLI were used. To identify fatty liver, FLI was calculated according to an algorithm based on TG levels, BMI, GGT, and waist circumference: FLI = (e 0.953 ├Ś Ln [TG] + 0.139 ├Ś BMI + 0.718 ├Ś Ln [GGT] + 0.053 ├Ś waist circumference ŌĆō 15.745) / (1 + e 0.953 ├Ś Ln [TG] + 0.139 ├Ś BMI + 0.718 ├Ś Ln [GGT] + 0.053 ├Ś waist circumference ŌĆō 15.745) ├Ś 100.
FLI ranges from 0 to 100. It has been validated against fatty liver diagnosis in the US with a proven accuracy of 0.84 (95% confidence interval [CI], 0.81 to 0.87). Participants were categorized into three FLI groups, < 30, the probability of not having fatty liver is 91%; 30 Ōēż FLI < 60, an intermediate probability; and Ōēź 60, the probability of having fatty liver is 78% [21]. Participants were classified as having NAFLD if FLI was Ōēź 60 in the absence of other causes of chronic liver disease (e.g., a history of hepatitis or cirrhosis, hepatitis B surface antigen negativity, and excessive alcohol consumption [Ōēź 30 g/day]).
Statistical analyses
Data are presented as mean ┬▒ standard deviation for normally distributed continuous variables and as proportions for categorical variables. Student t tests and analysis of variance were used to analyze continuous variables, and differences between nominal variables were compared with chi-square tests. Incidence rates of cancers were calculated by dividing the number of events by person-time at risk. To evaluate the independent association of FLI with risk of cancer incidence, the Cox proportional hazard model was used after adjusting for age, smoking status, alcohol consumption, exercise, and BMI. Subgroup analyses were performed according to age, smoking status, alcohol consumption, the presence of DM, metabolic syndrome signs and symptoms, obesity, abdominal obesity, physical activity, and yearly income. Statistical analyses were performed using SAS version 9.4 (SAS Institute, Cary, NC, USA) and R version 3.2.3 (The R Foundation for Statistical Computing, Vienna, Austria). A 2-sided p < 0.05 was considered statistically significant. The cutoff of p for interaction was 0.15.
RESULTS
Demographic characteristics
Participants were divided into three groups based on FLI; baseline characteristics of the study participants are provided in Table 1. Anthropometrics, clinical variables, and biochemistry data were analyzed according to FLI grouping. Among 21,592,374 enrollees, 2,543,649 persons (11.8%) were defined as having NAFLD based on FLI.
Participants with NAFLD in the FLI Ōēź 60 group were predominantly male compared to the other two groups. Mean age of the three groups were different. The group characterized by 30 Ōēż FLI < 60 was older than the other two groups. The FLI Ōēź 60 group included more individuals who smoked currently and consumed alcohol. Moreover, participants with an FLI Ōēź 60 had higher values for waist circumference, BMI, blood pressure, fasting glucose level, TG level, total cholesterol level, AST level, ALT level, and GGT level than those in the other two groups. When the total population was divided into two groups, FLI < 60 and FLI Ōēź 60, the latter included more individuals who exercised less frequently and fewer individuals who were in the lowest quintile of yearly income (Supplementary Table 1).
Of 2,543,649 participants with NAFLD defined by the FLI, 19,785 (0.78%) developed CRC, while 80,871 (0.57%) and 40,612 (0.84%) were diagnosed as having CRC among 14,236,480 persons with an FLI < 30 and 4,812,245 individuals with 30 Ōēż FLI < 60. Overall, 121,483 persons (0.64%) developed CRC among 19,048,725 individuals with an FLI < 60. Mean follow-up time was not significantly different among the three FLI groups (5.3 ┬▒ 1.1 years vs. 5.3 ┬▒ 1.2 years vs. 5.3 ┬▒ 1.2 years).
Multivariate analyses for risk factors associated with the development of colorectal cancer
Risks of developing CRC are shown for each FLI group in Table 2. After controlling for age, BMI, smoking status, alcohol consumption, regular physical exercise, yearly income, and presence of DM, hypertension, and dyslipidemia, participants in 30 Ōēż FLI < 60 and FLI Ōēź 60 groups showed increased risk for CRC (hazard ratios [HRs], 1.07 and 1.13; 95% confidential intervals [CIs], 1.06 to 1.09 and 1.12 to 1.15, respectively).
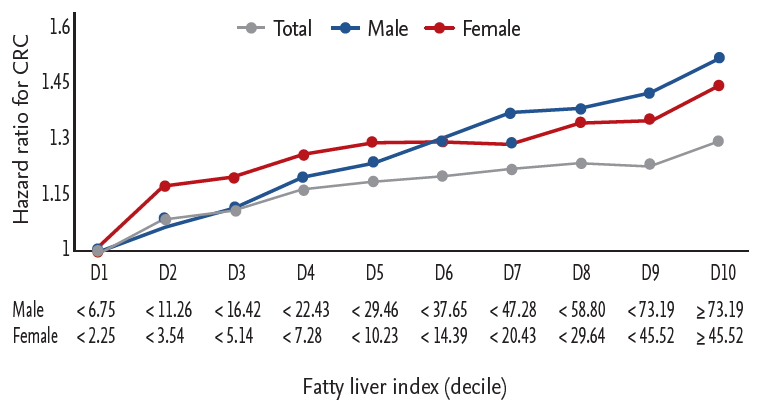
HRs for developing CRC by decile of FLI are depicted in Fig. 2. The HR for developing CRC continuously increased with decile in both men and women.
Influence of BMI on effects of non-alcoholic fatty liver disease on the development of colorectal cancer
Table 3 shows incidence rates and HRs of CRC by FLI and BMI range. The proportion of participants who took metformin or statin increased depending on BMI range. HRs were calculated after adjusting for age, sex, smoking status, alcohol consumption, regular physical exercise, yearly income, and presence of DM, hypertension, and dyslipidemia. Regardless of BMI range, an FLI Ōēź 60 was significantly correlated with an increased risk of developing CRC. The association of NAFLD with development of CRC was stronger in individuals with BMI in the range of 18.5 to 23.0 kg/m2 than in individuals with BMI in the obese range. Moreover, the association between NAFLD and development of CRC decreased in a dose-dependent manner as BMI increased in obese individuals. HRs of NAFLD for developing CRC for participants with a BMI < 18.5 and Ōēź 18.5 kg/m2 and < 23 kg/m2 were 1.44 and 1.29, respectively, whereas corresponding HRs for BMI of Ōēź 23 and < 25.0 kg/m2, Ōēź 25 and < 30 kg/m2, and Ōēź 30 kg/m2 were 1.15, 1.11, and 1.09, respectively.
Subgroup analyses according to age, smoking status, alcohol consumption, and metabolic health status
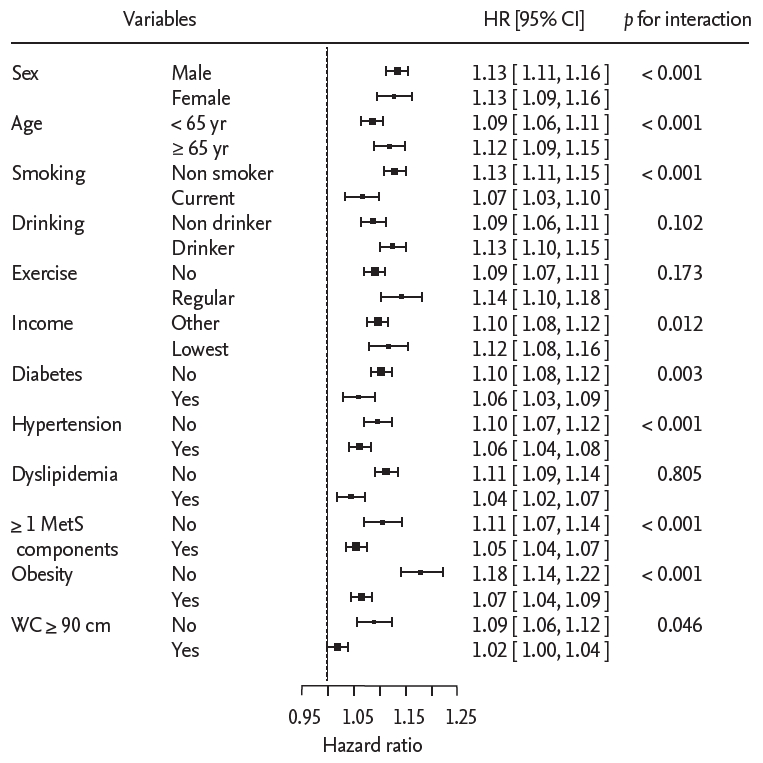
Subgroup analyses were performed according to sex, age, smoking status, alcohol consumption, regular physical exercise, yearly income, and the presence of DM, hypertension, and dyslipidemia obesity, and a combination of hypertension and dyslipidemia. Fig. 3 shows HRs of CRC and p values for interaction by subgroup after controlling for age, sex, smoking status, alcohol consumption, regular physical exercise, and yearly income.
For NAFLD defined by FLI Ōēź 60, participants aged 65 years or older showed a higher risk for CRC than the other age groups (HR, 1.12; 95% CI, 1.09 to 1.15 vs. HR, 1.09; 95% CI, 1.06 to 1.11; p for interaction < 0.001) (Fig. 3). Nonsmokers or ex-smokers, alcohol consumers (< 30 g/day), and persons with the lowest quintile of yearly income showed greater association with development CRC. Moreover, associations between NAFLD and the development of CRC were more prominent in the absence of DM, hypertension, obesity and abdominal obesity (for all p for interactions < 0.05).
Non-diabetic, normotensive, and non-dyslipidemic individuals with NAFLD had a higher risk for developing CRC than persons who had one or more elements of metabolic syndrome (DM, hypertension, or dyslipidemia) (HR, 1.11; 95% CI, 1.07 to 1.14 vs. HR, 1.05; 95% CI, 1.04 to 1.07; p for interaction < 0.001).
Effect of changes in fatty liver index score on developing colorectal cancer
Among the study population, 6,739,987 persons had undergone consecutive biennial evaluations. To evaluate the effect of changes in FLI on developing CRC, these participants were subclassified to four groups by changes in FLI over a 2-year follow-up interval (Supplementary Table 2).
Individuals whose FLI had been less than 60 at baseline but became 60 or greater at follow-up showed an increased HR for CRC than individuals whose FLI remained less than 60 (HR, 1.09; 95% CI, 1.04 to 1.15). Persons whose FLI Ōēź 60 at baseline consistently showed an increased risk for development of CRC regardless of FLI change at follow-up (Supplementary Table 2).
DISCUSSION
In the present nationwide study, which involved a large cohort of Korean individuals, NAFLD as defined by the FLI Ōēź 60 was correlated with an increase up to 13% for development of CRC. This association was dose-dependent and more prominent in persons with a normal BMI compared to obese persons after controlling for age, sex, smoking status, alcohol consumption, regular physical exercise, and yearly income. Moreover, normoglycemic, normotensive, and non-dyslipidemic individuals with NAFLD had a higher risk for developing CRC compared with persons who had one or more elements of metabolic syndrome (DM, hypertension, or dyslipidemia).
Several studies have evaluated the relationship between NAFLD and CRC [11,12,22]. Wong et al. [12] showed that patients with NAFLD had a higher prevalence of colorectal adenomas and CRC than their counterparts. In a large retrospective cohort study of 5,517 Korean women, a significant relationship between NAFLD and colorectal neoplasm was observed [11], consistent with the current finding. However, the association between NAFLD and CRC is not consistently reported. Touzin et al. [22] reported no significant difference in the development of neoplasm, despite the higher mean number of adenomas in patients with NAFLD than in the control group. Because benign colonic polyps were frequently missing in the NHIC claim data, the relationship between NAFLD and colonic adenoma was not addressed in the present study.
Within the Korean cohort, mean age at diagnosis of NAFLD was 41.6 ┬▒ 8.7, while the incidence of CRC rapidly increases after age 50 and peaks at ages 65 to 69 [2,23]. This discrepancy in ages at diagnosis can be a confounding factor; that is, the incidence of CRC was highest for individuals with 30 Ōēż FLI < 60 before adjustment of age. However, after controlling age, HR of CRC among participants with FLI Ōēź 60 was higher than HR among individuals with 30 Ōēż FLI < 60 (Table 2). These results remained consistent after controlling several covariates other than age.
Although the proposed mechanism for how NAFLD affects carcinogenesis is not completely understood, NAFLD may represent a condition of insulin resistance and a proinflammatory state [24]. Insulin and insulin-like growth factors may promote development of colorectal neoplasm through their proliferative and antiapoptotic effects. Moreover, patients with NAFLD have reduced expression of adiponectin, which has anti-inflammatory properties [25,26].
Given that obesity is the usual cause for the development of NAFLD, a condition linked to CRC [18], Lower HR for NAFLD and development of CRC in obese individuals or participants with a waist circumference > 90 cm is an interesting finding. Non-obese NAFLD participants could represent a different disease entity with prominent visceral fat distribution and special genetic predisposition when compared to obese individuals with NAFLD [27]. Visceral fat is a source of free fatty acids and pro-inflammatory cytokines [27]. High fructose diets are reported to play an important role in the development of NAFLD, particularly in young and nonobese populations [28]. Fructose is proinflammatory, causing intracellular adenosine triphosphate depletion, uric acid production and subsequent cellular injury [29]. These actions might be related to CRC carcinogenesis. By contrast, the higher HR of NAFLD and CRC in participants without diabetes, hypertension, and dyslipidemia than in individuals who have at least one of the three elements of metabolic syndrome might be a result of anti-cancer properties of a statin [30] or metformin [31]. The proportion of individuals who were administered metformin or statin increased as BMI increased (Table 3).
However, more prominent associations between NAFLD and development of CRC in individuals with normal BMI than obese individuals should not be interpreted as a healthy obesity theory. Rather, this study suggests the important insight that NAFLD (or the high FLI) may be a more sensitive early marker for development of CRC than BMI or metabolic syndrome criteria. Rapidly increasing incidence of CRC and previously undocumented high incidence among young adults indicates that CRC screening in this group may become an important issue [32].
Changes in FLI score for individuals who participated in consecutive biennial exams indicates an increased risk of CRC in participants who became FLI-based NAFLD at the 2-year follow-up. However, established FLI-based NAFLD patients whose FLI went down to less than 60 during the follow-up period did not show reduced risk. Participants in the 30 Ōēż FLI < 60 may have a condition that encourages development of CRC, or some confounding factors may reverse any beneficial effect of a reduction in FLI score. Whether reduction in FLI score could lead to a decreased risk for CRC needs further long-term, well-organized studies.
The limitations of the present study include lack of data from imaging modalities and biopsy to evaluate NAFLD, and some misclassification may exist. Previous external validation data from Taiwan shows that FLI can accurately identify ultrasonographic fatty liver in a large-scale population [33]. The study suggests that optimal cut-off values are lower than cut-offs for Western populations; FLI Ōēź 35 and Ōēź 20 to rule in ultrasonographic fatty liver for men and women. Indeed, the risk for CRC increased in participants with an FLI Ōēź 30, suggesting that risk stratification using FLI can be useful. To compensate for this limitation, a sensitivity analysis used a simple AST/ALT ratio. An increasing AST/ALT ratio is associated with advanced fibrosis [34]. When 1.0 was used as a cut-off value, an AST/ALT ratio Ōēź 1 was consistently associated with an increased risk for CRC in multivariable analyses (Supplementary Table 3).
A lack of information on histological type and stage is also a limitation. Rectal cancer could not be differentiated from CRC because most claims did not precisely specify tumor location. Although the association was significant, it was modest.
Nonetheless, the largest nationwide database ever used formed the basis for the study. The sample size of this study exceeds the sum of previous case-control or cohort studies. This study presents preliminary data that should promote further studies on individuals with high FLI.
NAFLD defined by the FLI is significantly associated with the presence of CRC in asymptomatic patients undergoing screening. This finding provides a clinical means for risk stratification of CRC and for screening strategies using FLI.
KEY MESSAGE
1. High fatty liver index score is correlated with development of colorectal cancer.
2. High fatty liver index is correlated with colorectal cancer regardless of body mass index, but the association was more prominent in persons with a normal body mass index.
3. Individuals with a fatty liver index Ōēź 60 require close consideration for development of colorectal cancer even in the absence of obesity or other elements of metabolic syndrome.
 PDF Links
 PubReader
 ePub Link
 Full text via DOI
 Download Citation
 Supplement 1
 Print
Print


